. 2023 Aug 10;14(31):7126-7133.
doi: 10.1021/acs.jpclett.3c01447. Epub 2023 Aug 3.

Time-Resolved X-ray Photoelectron Spectroscopy: Ultrafast Dynamics in CS2 Probed at the S 2p Edge

Affiliations

Time-Resolved X-ray Photoelectron Spectroscopy: Ultrafast Dynamics in CS2 Probed at the S 2p Edge

Ian Gabalski et al. J Phys Chem Lett. .

Abstract

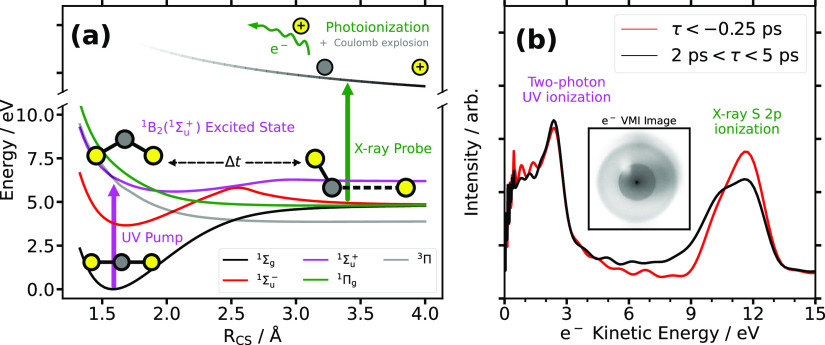
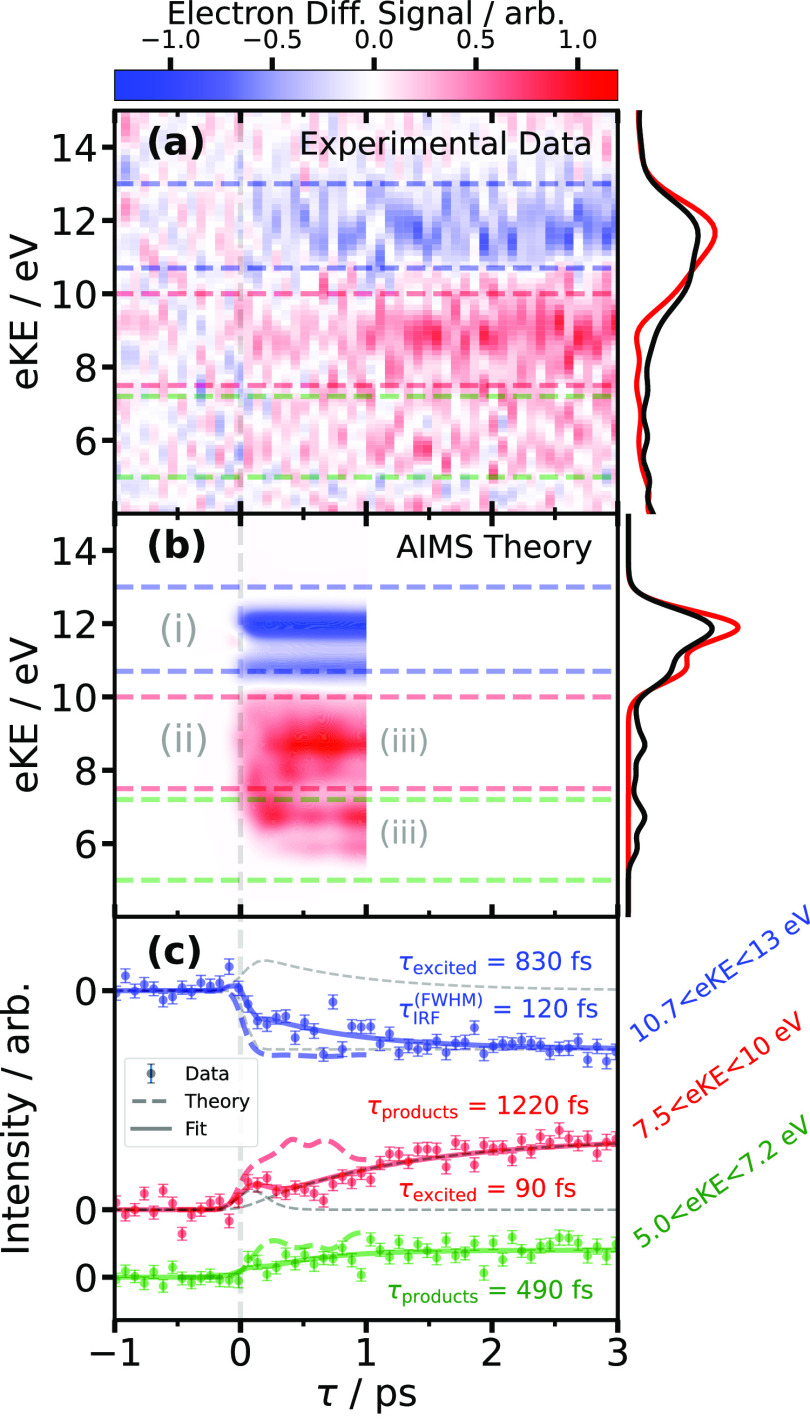
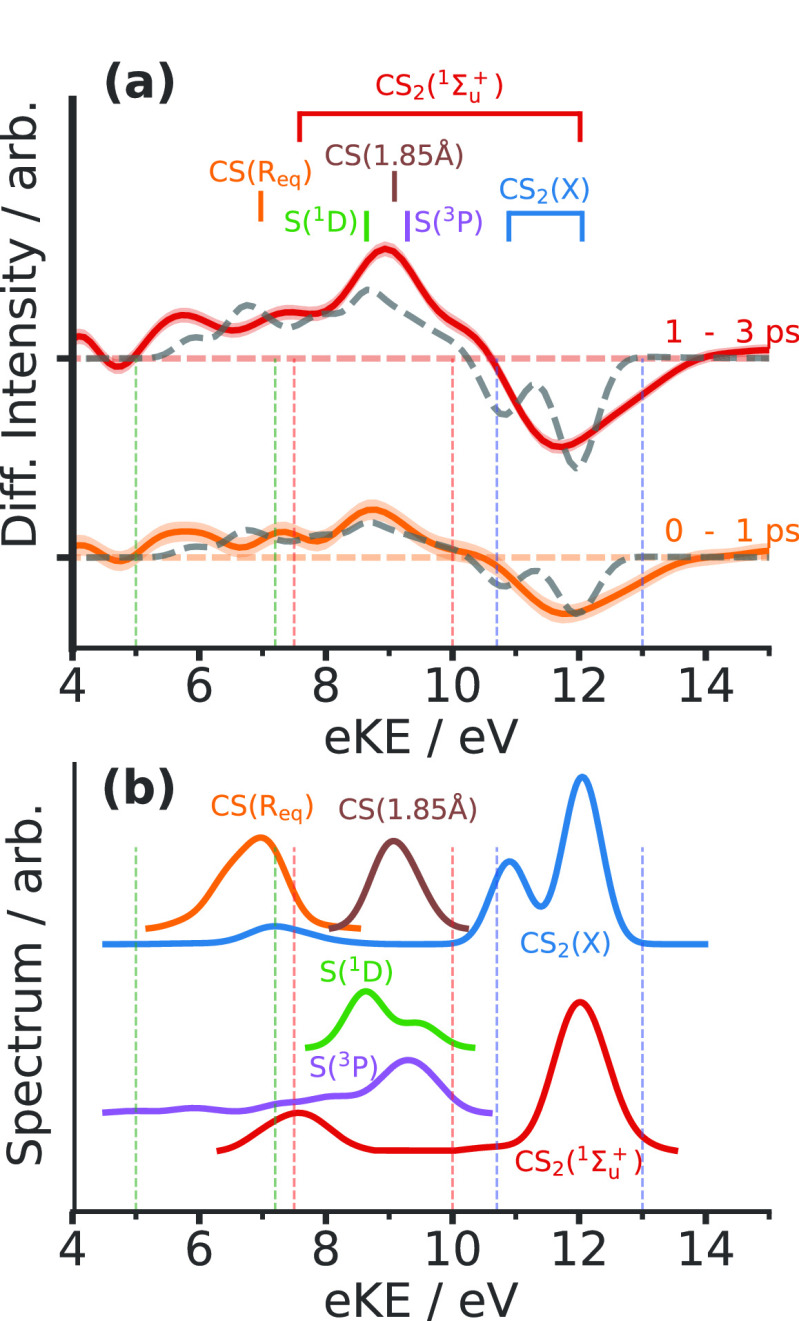
Recent developments in X-ray free-electron lasers have enabled a novel site-selective probe of coupled nuclear and electronic dynamics in photoexcited molecules, time-resolved X-ray photoelectron spectroscopy (TRXPS). We present results from a joint experimental and theoretical TRXPS study of the well-characterized ultraviolet photodissociation of CS2, a prototypical system for understanding non-adiabatic dynamics. These results demonstrate that the sulfur 2p binding energy is sensitive to changes in the nuclear structure following photoexcitation, which ultimately leads to dissociation into CS and S photoproducts. We are able to assign the main X-ray spectroscopic features to the CS and S products via comparison to a first-principles determination of the TRXPS based on ab initio multiple-spawning simulations. Our results demonstrate the use of TRXPS as a local probe of complex ultrafast photodissociation dynamics involving multimodal vibrational coupling, nonradiative transitions between electronic states, and multiple final product channels.


Conflict of interest statement

The authors declare no competing financial interest.

Figures

Figure 1
Figure 1
(a) Cartoon of the relevant potential energy surfaces of CS2. The UV photoexcitation (purple arrow), time evolution of the molecular system, and X-ray photoionization (green arrow) processes are shown alongside cartoons of the approximate CS2 geometry and charge state at each step. (b) Measured CS2 photoelectron kinetic energy spectrum for pre-time zero (“τ < −0.25 ps”, red) and late time (“2 ps < τ < 5 ps”, black). The peak at 2.23 eV is due to two-photon ionization of ground-state CS2 by the UV pump alone. The inset shows an illustrative photoelectron VMI detector image that is subsequently Abel-inverted to obtain the spectra in the figure.
Figure 2
Figure 2
(a) Experimental TRXPS difference signal as a function of pump–probe delay τ and electron kinetic energy (eKE). Pre-time-zero (red, “τ < −0.25 ps”) and late-time (black, “2 ps < τ < 5 ps”) spectra are shown beside the time-resolved difference signal. (b) Simulated TRXPS difference signal calculated using an ensemble of singlet AIMS trajectories. Three regions of interest (i–iii) described in the text are indicated. (c) Energy-integrated time-dependent intensities of the TRXPS data (dots with error bars) and theory (dashed colored lines), signal fits (solid colored lines), and the components of the signal fits (gray dashed lines). The instrument response function (IRF), excited-state, and photoproduct time constant parameter fits are indicated alongside each curve. The energy integration bounds are indicated with translucent colored dashed lines in panels a and b.
Figure 3
Figure 3
(a) Comparison of experimental and calculated photoelectron difference spectra in two pump–probe delay ranges. Solid lines with shaded error bars show experimental data, while the dashed black lines are obtained from integrating the simulated TRXPS over the same temporal region. The locations of individual calculated fragment spectra are indicated above. (b) Calculated XPS spectra of the CS2 ground () and excited (1Σu+) states at the Franck–Condon geometry and of the CS and S fragments, scaled by the ionization cross section. “CS(Req)” is computed in the 1Σg+ ground state at the equilibrium bond geometry with an RCS of 1.54 Å. “CS(1.85 Å)” is computed with an elongated bond length (RCS) of 1.85 Å. The colored vertical dashed lines indicate the corresponding energy integration regions employed in Figure 2. The small features around 7–8 eV in the ground- and excited-state CS2 spectra are the shakeup peaks that leave the molecule in a valence excited state following core ionization.

References

    1. Stolow A.; Bragg A. E.; Neumark D. M. Femtosecond Time-Resolved Photoelectron Spectroscopy. Chem. Rev. 2004, 104, 1719–1758. 10.1021/cr020683w. - DOI - PubMed
    1. Suzuki T. Femtosecond Time-resolved Photoelectron Imaging. Annu. Rev. Phys. Chem. 2006, 57, 555–592. 10.1146/annurev.physchem.57.032905.104601. - DOI - PubMed
    1. Neumark D. M. Time-Resolved Photoelectron Spectroscopy of Molecules and Clusters. Annu. Rev. Phys. Chem. 2001, 52, 255–277. 10.1146/annurev.physchem.52.1.255. - DOI - PubMed
    1. Schuurman M. S.; Blanchet V. Time-Resolved Photoelectron Spectroscopy: The Continuing Evolution of a Mature Technique. Phys. Chem. Chem. Phys. 2022, 24, 20012–20024. 10.1039/D1CP05885A. - DOI - PubMed
    1. Schuurman M. S.; Stolow A. Dynamics at Conical Intersections. Annu. Rev. Phys. Chem. 2018, 69, 427–450. 10.1146/annurev-physchem-052516-050721. - DOI - PubMed