. 2023 Nov;149(15):13811-13821.
doi: 10.1007/s00432-023-05115-0. Epub 2023 Aug 3.

AML consolidation therapy: timing matters

Affiliations

AML consolidation therapy: timing matters

Adrian-Manuel Reimann et al. J Cancer Res Clin Oncol. 2023 Nov.

Abstract

Purpose: Infections due to severe neutropenia are the most common therapy-associated causes of mortality in patients with acute myeloid leukemia (AML). New strategies to lessen the severity and duration of neutropenia are needed.

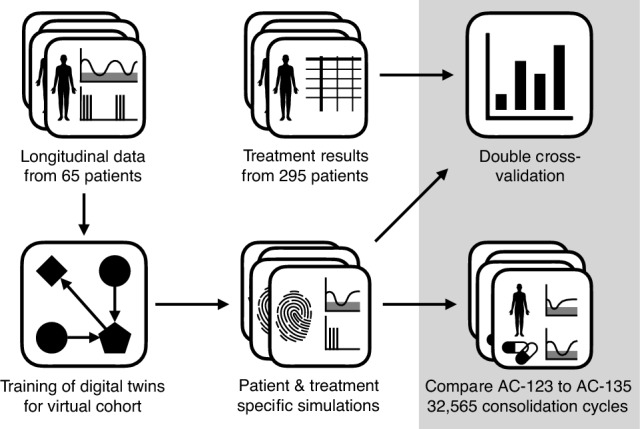
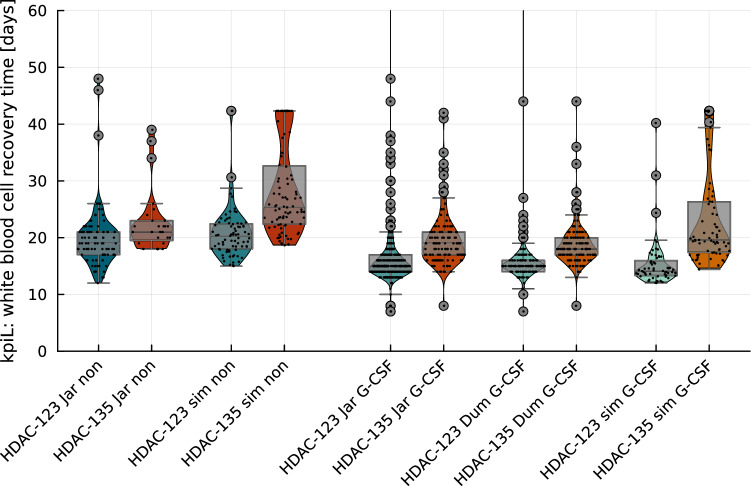
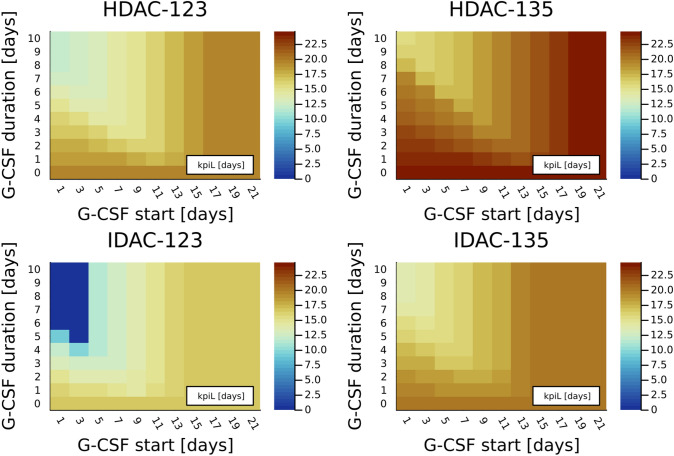
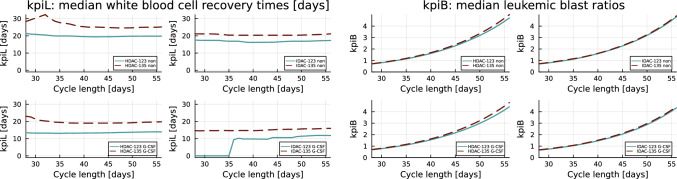
Methods: Cytarabine is commonly used for AML consolidation therapy; we compared high- and intermediate-dose cytarabine administration on days 1, 2, and 3 (AC-123) versus days 1, 3, and 5 (AC-135) in consolidation therapy of AML. Recently, clinical trials demonstrated that high-dose AC-123 resulted in a shortened white blood cell (WBC) recovery time compared with high-dose AC-135. Our main hypothesis is that this is also the case for different cytarabine dosage, granulocyte colony-stimulating factor (G-CSF) administration, and cycle lengths. We analyzed 334 treatment schedules on virtual cohorts of digital twins.

Results: Comparison of 32,565 simulated consolidation cycles resulted in a reduction in the WBC recovery time for AC-123 in 99.6% of the considered cycles (median reduction 3.5 days) without an increase in the number of leukemic blasts (lower value in 94.2% of all cycles), compared to AC-135.

Conclusion: Our numerical study supports the use of AC-123 plus G-CSF as standard conventional AML consolidation therapy to reduce the risk for life-threatening infectious complications.

Keywords: Acute myeloid leukemia; Chemotherapy; Digital twin; Mathematical modeling; Myelosuppression; Neutropenia.


Conflict of interest statement

DM consults for Abbvie, Beigene, BMS, Gilead, Janssen, Novartis, and Takeda. HD consults Abbvie, Agios, Amgen, Astellas, AstraZeneca, Berlin-Chemie, Bristol Myers Squibb, Celgene, Daiichi Sankyo, GEMoaB, Gilead, Janssen, Jazz Pharmaceuticals, Novartis, Servier, Stemline, and Syndax. His institute has been receiving support from Abbvie, Agios, Amgen, Astellas, Bristol Myers Squibb, Jazz Pharmaceuticals, Kronos-Bio, Novartis, and Pfizer. CR is on the advisory boards of Abbvie, Astellas, BMS, Jazz Pharma, Novartis, Servier, and Takeda; his institution is supported by Abbvie, Astellas, BMS, Jazz Pharmaceuticals, and Iqvia. PYD consults for Daiichi-Sankyo, Jazz Pharmaceutical, Astellas, Abbvie, BMS, Janssen, and Novartis; his institution is supported by Astellas, Roche, Gilead, Daiichi-Sankyo, BMS, Servier, and Novartis. All other authors declare no competing interests.

Figures

Fig. 1
Fig. 1
Our workflow built on retrospective longitudinal data from n=65 patients. Most importantly, the data contained 1869 white blood cell (WBC) measurements as well as cytarabine (Ara-C) and lenograstim timing and dosage. We used these data together with a pre-trained mathematical model published in the previous studies (Jost et al. 2019, 2020) to estimate six patient-specific model parameters. This allowed patient- and treatment-specific simulations in a virtual cohort. In addition to a first cross-validation reported in Jost et al. (2019), here, we compared the distributions of individual WBC recovery times to those of two independent clinical studies (Dumas et al. ; Jaramillo et al. 2017). By satisfying with the close similarity of the simulated predictions to clinical data, we compared the effect of Ara-C administration on days 1, 2, and 3 (AC-123) versus days 1, 3, and 5 (AC-135) for 334 simulated treatment schedules with varying administration of lenograstim, Ara-C dosage, and time between two consecutive cycles. As key performance indicators for a treatment, we evaluated key performance indicators for neutropenia/leukopenia (kpiL) and differences in simulated leukemic blast ratios (kpiB). The main result was a superiority of AC-123 compared to AC-135 in 99.6% of the considered cycles, using the same virtual cohort
Fig. 2
Fig. 2
We compared WBC recovery time as a key performance indicator (kpiL) for different treatments. For different treatment schedules on the horizontal axis, dots indicate kpiL values from one of the consolidation cycles of different patients. The distributions, including median, standard deviations, and outliers, are illustrated. The treatments were always compared between HDAC-123 (123, blue) and HDAC-135 (135, red). Columns 1–2 show data from the clinical trial Jar (Jaramillo et al. 2017) for a cohort without granulocyte colony-stimulating factor (G-CSF) treatment (non); columns 3–4 show simulated data for our HDAC-virtual cohort of patients (sim) without G-CSF (non). For columns 5–10, either pegfilgrastim or lenograstim was administered (G-CSF). Columns 5–6 show the corresponding cohorts of Jar, columns 7–8 of another clinical trial Dum (Dumas et al. 2020), and columns 9–10 simulated values. The HDAC-virtual cohort used in columns 3, 4, 9, and 10 is approximately 10 years older compared to the Jar and Dumas cohorts shown in the other columns (compare Table 1), giving an explanation for slightly increased kpiL values. We visually demonstrate that the HDAC-123 treatments (in comparison to HDAC-135) resulted in a significant reduction in kpiL in all five comparisons and that the simulations resulted in very similar WBC recovery times when compared to the clinical studies
Fig. 3
Fig. 3
The heatplots show median values of the WBC recovery times (key performance indicator, kpiL) for different simulated lenograstim schedules and the first consolidation cycle per patient. The four subplots show different chemotherapy schedules, namely HDAC-123, HDAC-135, IDAC-123, and IDAC-135. HDAC indicates high Ara-C dosage of 3gm2 of body surface area, IDAC intermediate dosage of 1gm2. The numbers indicate the days of drug administration (either day 1, 2, and 3 or day 1, 3, and 5). The median is either taken from the HDAC-virtual cohort with n=30 patients (for HDAC-123 and HDAC-135) or from the IDAC-virtual cohort (n=35, for IDAC-123 and IDAC-135). Within the subplots, the lenograstim timing is varied with fixed daily dosage of 263μg. On the horizontal axis, we compared different starting points, where the number indicates the number of days between the end of the Ara-C treatment and the start of the Lenograstim treatment, while the vertical axis decodes the number of consecutive days lenograstim was administered. For example, G-CSF start 5 and G-CSF duration 5 correspond to 5 consecutive days of lenograstim treatment starting at day 8 for AC-123, and day 10 for AC-135. No granulocyte colony-stimulating factor (G-CSF) (non) corresponds to the field at duration 0. In all the subplots, we observed a valley corresponding to lower kpiL values that starts around G-CSF start 13 and G-CSF duration 1 and reaches the minimum in the top left corner. For later G-CSF starts, no impact on the first consolidation cycle was observed any more. Decreased kpiL values were observed for HDAC-123 and IDAC-123 in comparison to HDAC-135 and IDAC-135, respectively, for all of the lenograstim schedules, including no lenograstim application
Fig. 4
Fig. 4
Similar to Fig. 3, but for the median values of the ratios of simulated absolute leukemic blast numbers at the end and at the beginning of the first consolidation cycle, denoted as key performance indicator kpiB. By design, a decrease in the leukemic blasts over the cycle would correspond to a kpiB value below 1, while most values for a cycle length of 42 days are above 1. Granulocyte colony-stimulating factor (G-CSF) administration reduces the ratio in all the settings, with best performance starting approximately 11 days after the end of the chemotherapy. We observe that AC-123 treatment (two subplots to the left) does not result in worse (but rather slightly better) outcomes compared to AC-135 (right) considering proliferation of leukemic blasts
Fig. 5
Fig. 5
Left four subplots: similar to Fig. 3, but now the median values of white blood cell recovery times (key performance indicator, kpiL) are shown as one-dimensional plots with the consolidation cycle length in days (CC dist) as independent variable. One can observe that for high (HDAC-123) and intermediate dose (IDAC-123) of cytarabine (Ara-C) and for administration of no lenograstim (non, topmost subplots) and of lenograstim for 5 days starting at day 5 (G-CSF, subplots 3 and 4), the median kpiL values of AC-123 are better than those of AC-135, respectively. Right four subplots: the same setting, but similar to Fig. 4, the ratios between the leukemic blasts at the end and the beginning of the first consolidation cycle (kpiB) are plotted. In simulation, the cycle lengths exceeding 35–42 days resulted in greatly increased numbers of leukemic blasts. Similar to Fig. 4, AC-123 did not lead to worse outcomes compared to AC-135 considering the numbers of leukemic blasts

References

    1. Bodey GP, Buckley M, Sathe YS, Freireich EJ (1966) Quantitative relationships between circulating leukocytes and infection in patients with acute leukemia. Ann Intern Med 64(2):328–340. 10.7326/0003-4819-64-2-328 - PubMed
    1. Brady R, Enderling H (2019) Mathematical models of cancer: when to predict novel therapies, and when not to. Bull Math Biol 81(10):3722–3731. 10.1007/s11538-019-00640-x - PMC - PubMed
    1. Burnett AK, Russell NH, Hills RK, Hunter AE, Kjeldsen L, Yin J, Gibson BES, Wheatley K, Milligan D (2013) Optimization of chemotherapy for younger patients with acute myeloid leukemia: results of the Medical Research Council AML15 trial. J Clin Oncol 31(27):3360–3368. 10.1200/JCO.2012.47.4874 - PubMed
    1. Chulián S, Martínez-Rubio Á, Rosa M, Pérez-García VM (2022) Mathematical models of leukaemia and its treatment: a review. SeMA J 79(3):441–486. 10.1007/s40324-022-00296-z
    1. Clairambault J (2009) Modelling physiological and pharmacological control on cell proliferation to optimise cancer treatments. Math Model Nat Phenom 4(3):12–67. 10.1051/mmnp/20094302

LinkOut - more resources