

Super-swelling behavior of stacked lipid bilayer systems
- PMID: 37535300
- PMCID: PMC10400704
- DOI: 10.1140/epje/s10189-023-00322-6
Super-swelling behavior of stacked lipid bilayer systems
Erratum in
-
Correction to: Collection of Festschrift in honor of Philip (Fyl) Pincus.Eur Phys J E Soft Matter. 2023 Oct 20;46(10):101. doi: 10.1140/epje/s10189-023-00351-1. Eur Phys J E Soft Matter. 2023. PMID: 37864022 No abstract available.
Abstract
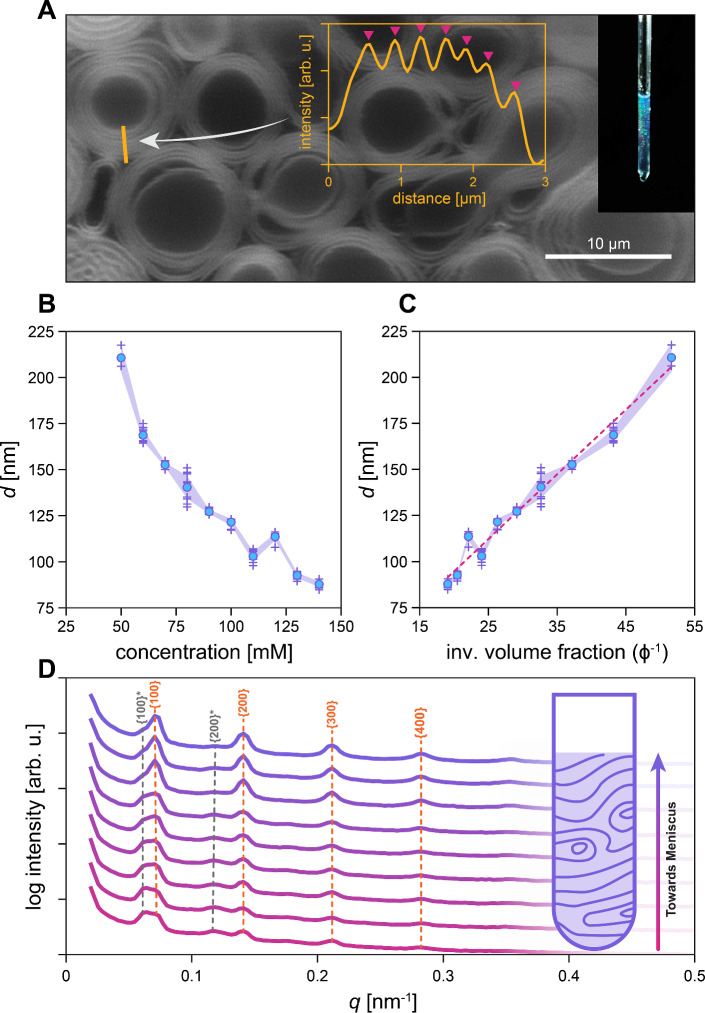
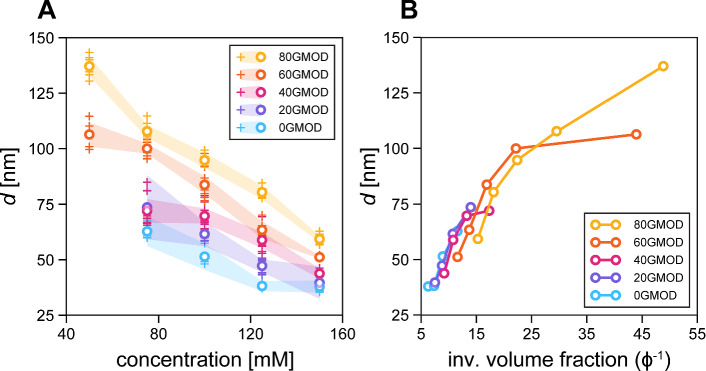
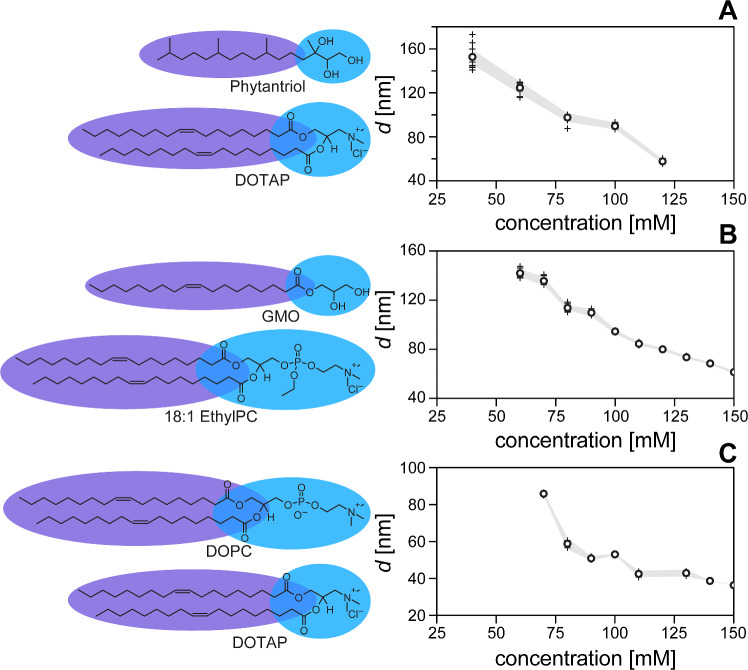
Bilayer systems comprising lipid mixtures are the most well-studied model of biological membranes. While the plasma membrane of the cell is a single bilayer, many intra- and extra-cellular biomembranes comprise stacks of bilayers. Most bilayer stacks in nature are periodic, maintaining a precise water layer separation between bilayers. That equilibrium water separation is governed by multiple inter-bilayer forces and is highly responsive. Biomembranes re-configure inter-bilayer spacing in response to temperature, composition, or mass transport cues. In synthetic bilayer systems for applications in cosmetics or topical treatments, control of the hydration level is a critical design handle. Herein we investigate a binary lipid system that leverages key inter-bilayer forces leading to unprecedented levels of aqueous swelling while maintaining a coherent multilamellar form. We found that combining cationic lipids with bicontinuous cubic phase-forming lipids (lipids with positive Gaussian modulus), results in the stabilization of multilamellar phases against repulsive steric forces that typically lead to bilayer delamination at high degrees of swelling. Using ultra-small-angle X-ray scattering alongside confocal laser scanning microscopy, we characterized various super-swelled states of 1,2-dioleoyl-3-trimethylammonium-propane (DOTAP) and glycerol monooleate (GMO) lipids, as well as other analogous systems, at varied concentration and molar ratios. Through these experiments we established swelling profiles of various binary lipid systems that were near-linear with decreasing lipid volume fraction, showing maximum swelling with periodicity well above 200 nanometers. Confocal fluorescence micrograph of super-swelled multilamellar structures in 90GMOD sample at 25 mM concentration. Inset plot shows intensity profile of orange line, with pink triangles indicating maxima.
© 2023. The Author(s).
Figures

References
-
- Reinat Nevo, Silvia G. Chuartzman, Onie Tsabari, Ziv Reich, Dana Charuvi, Eyal Shimoni, Architecture of Thylakoid Membrane Networks, in Lipids in Photosynthesis: Essential and Regulatory Functions. ed. by H. Wada, N. Murata. Advances in Photosynthesis and Respiration. (Springer, Netherlands, Dordrecht, 2009), pp.295–328
-
- Yoshioka-Nishimura Miho, Nanba Daisuke, Takaki Takashi, Ohba Chikako, Tsumura Nodoka, Morita Noriko, Sakamoto Hirotaka, Murata Kazuyoshi, Yamamoto Yasusi. Quality control of photosystem II: direct imaging of the changes in the thylakoid structure and distribution of FtsH proteases in spinach chloroplasts under light stress. Plant Cell Physiol. 2014;55(7):1255–1265. doi: 10.1093/pcp/pcu079. - DOI - PubMed
MeSH terms
Substances
Grants and funding
LinkOut - more resources
Full Text Sources
