. 2024 Apr;32(2):158-172.
doi: 10.1037/pha0000674. Epub 2023 Aug 3.

Cocaine and heroin interact differently with nondrug reinforcers in a choice situation

Affiliations

Cocaine and heroin interact differently with nondrug reinforcers in a choice situation

Madeline M Beasley et al. Exp Clin Psychopharmacol. 2024 Apr.

Abstract

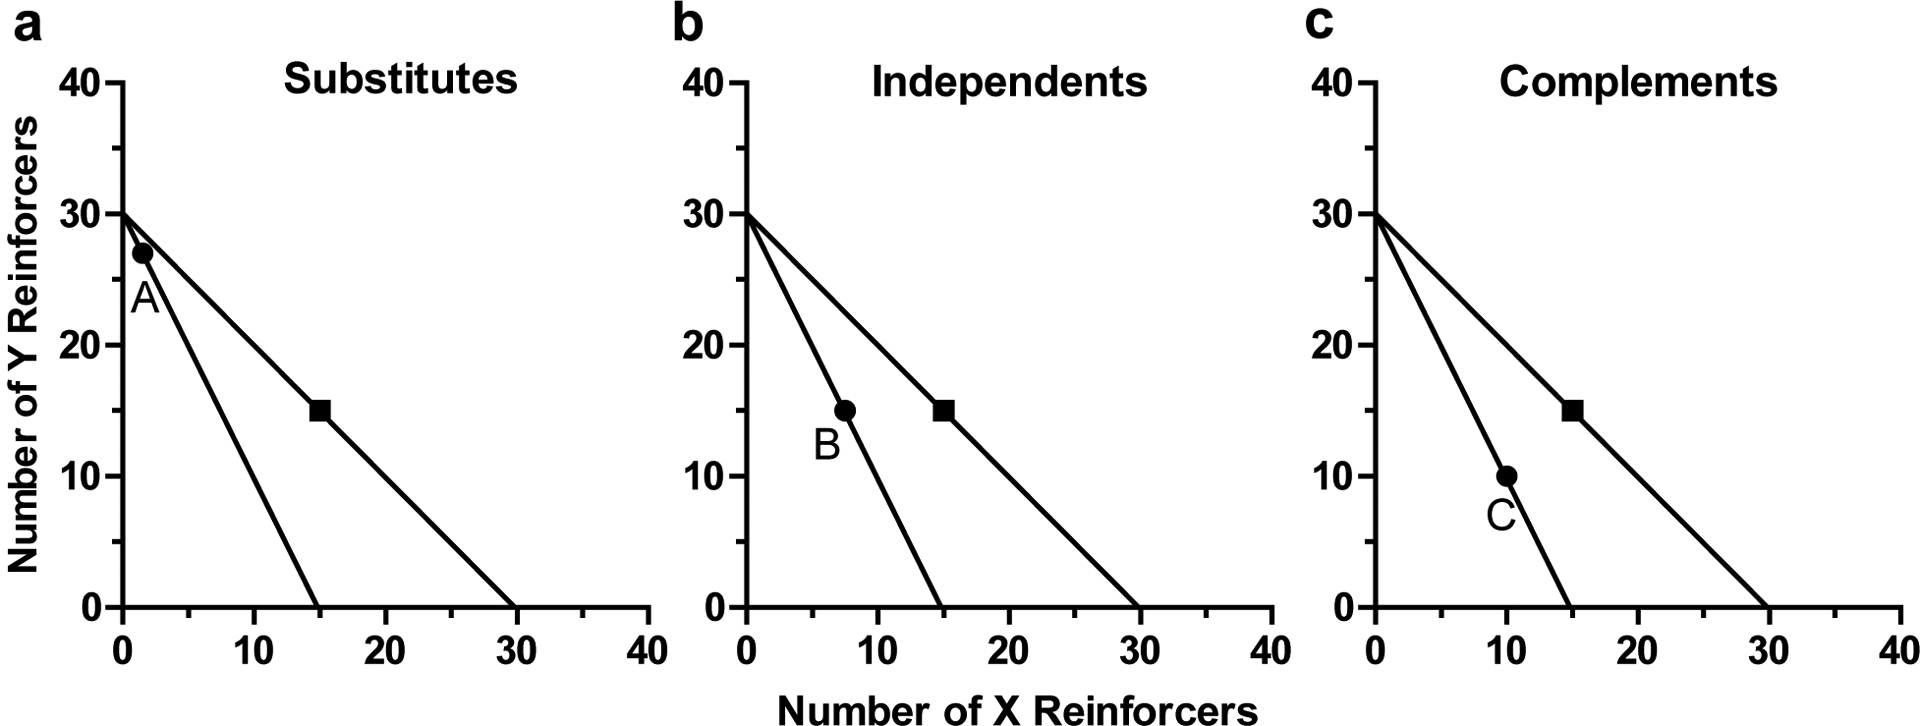
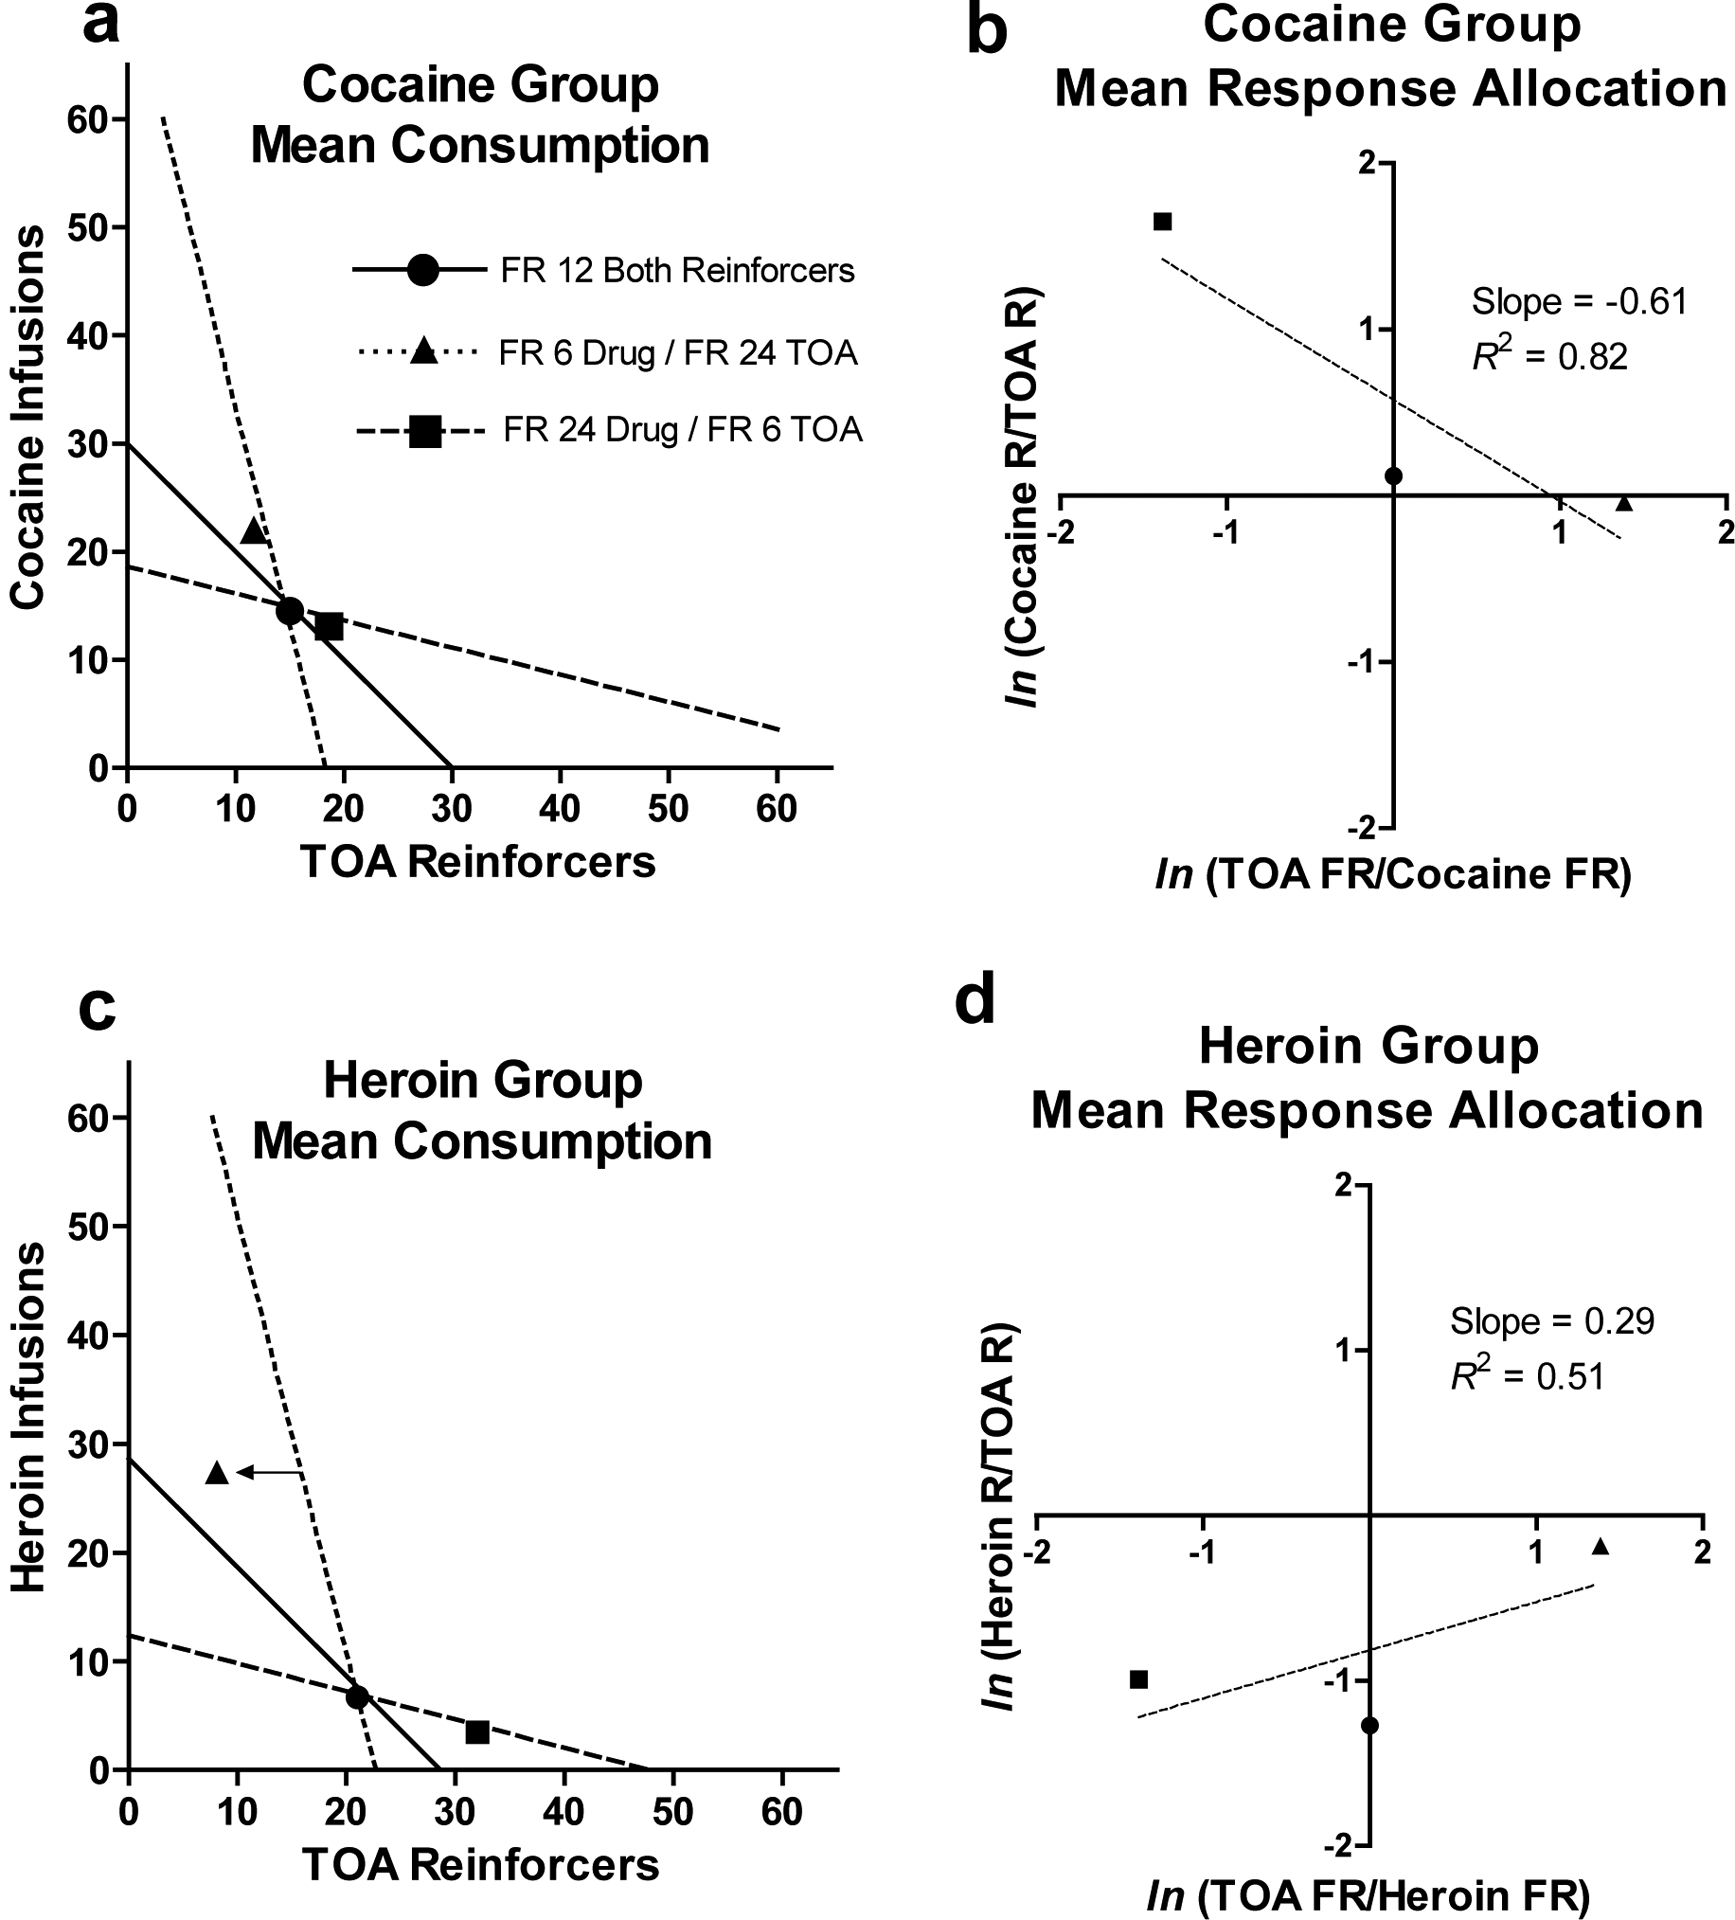
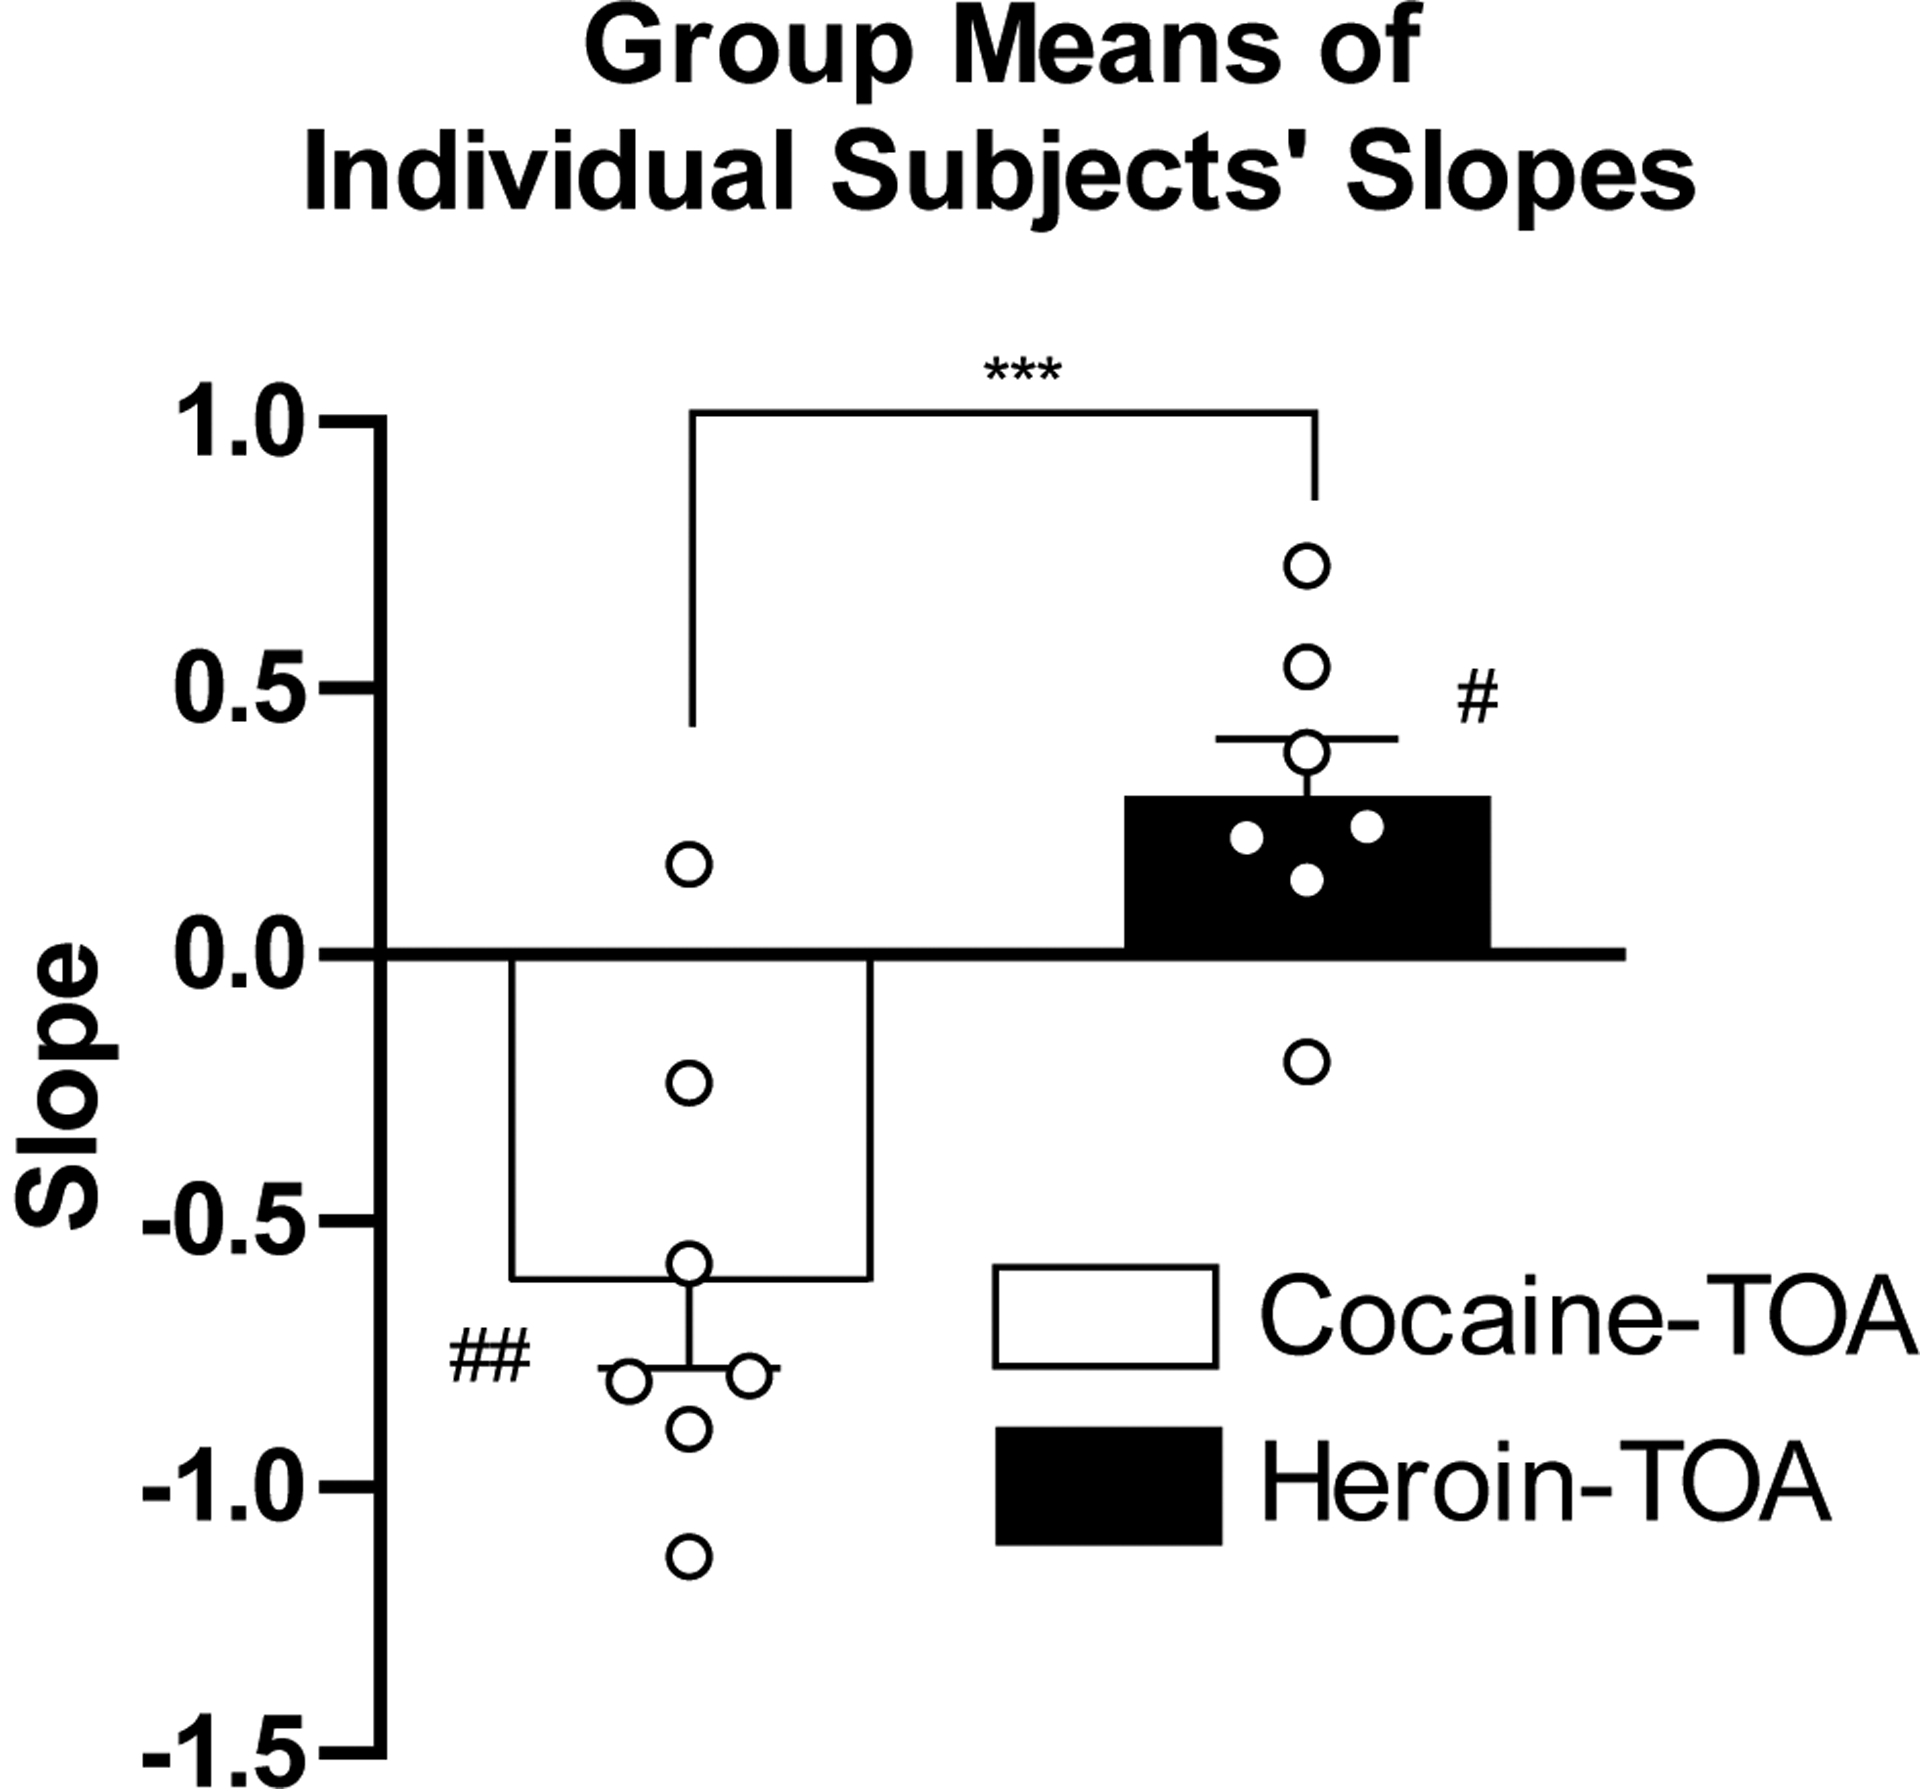
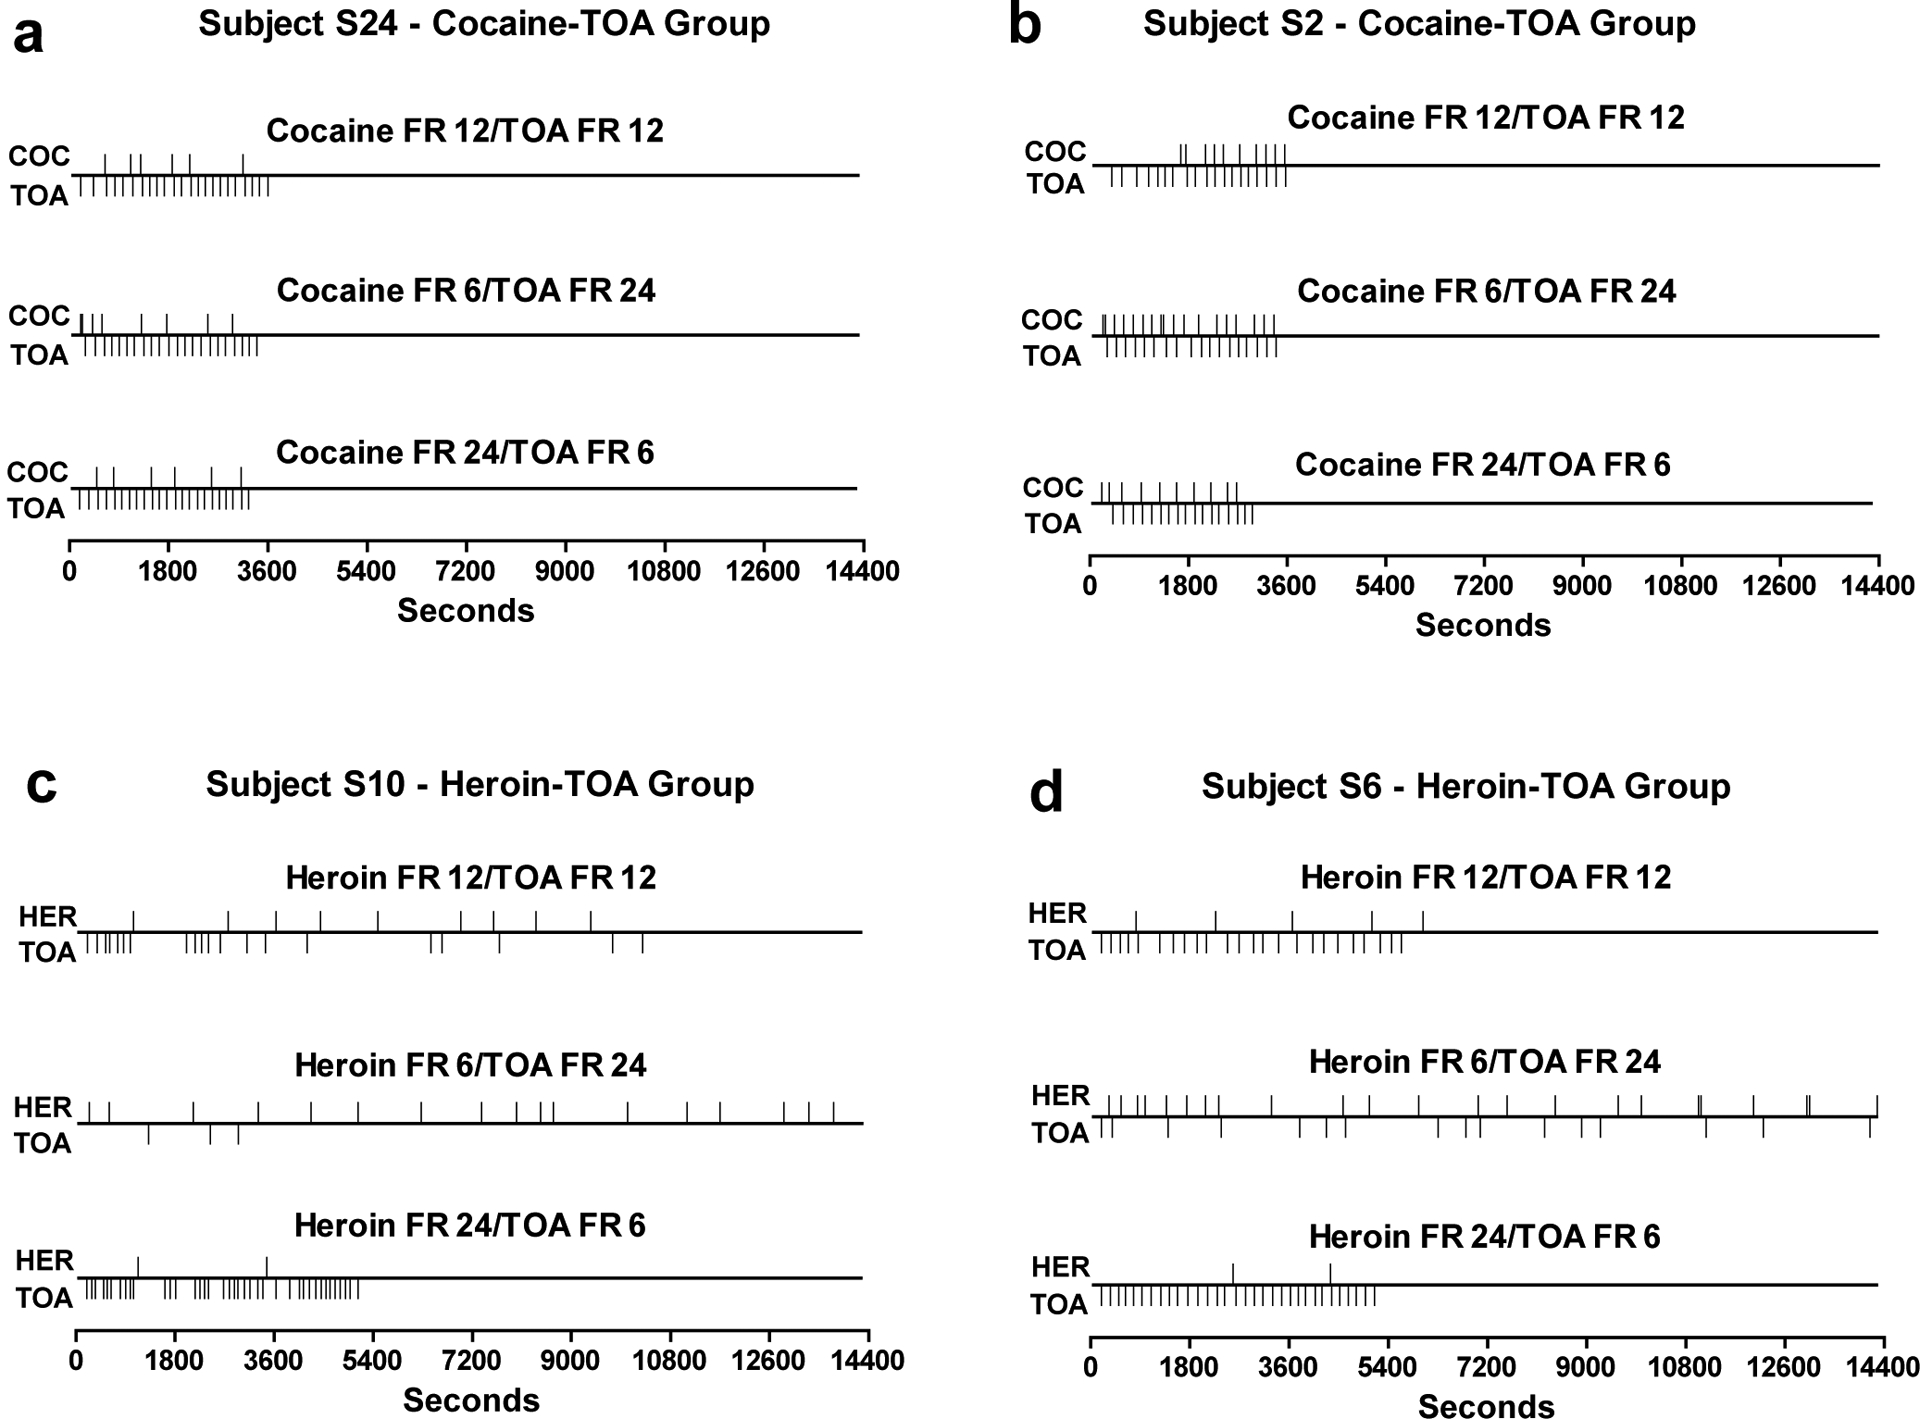
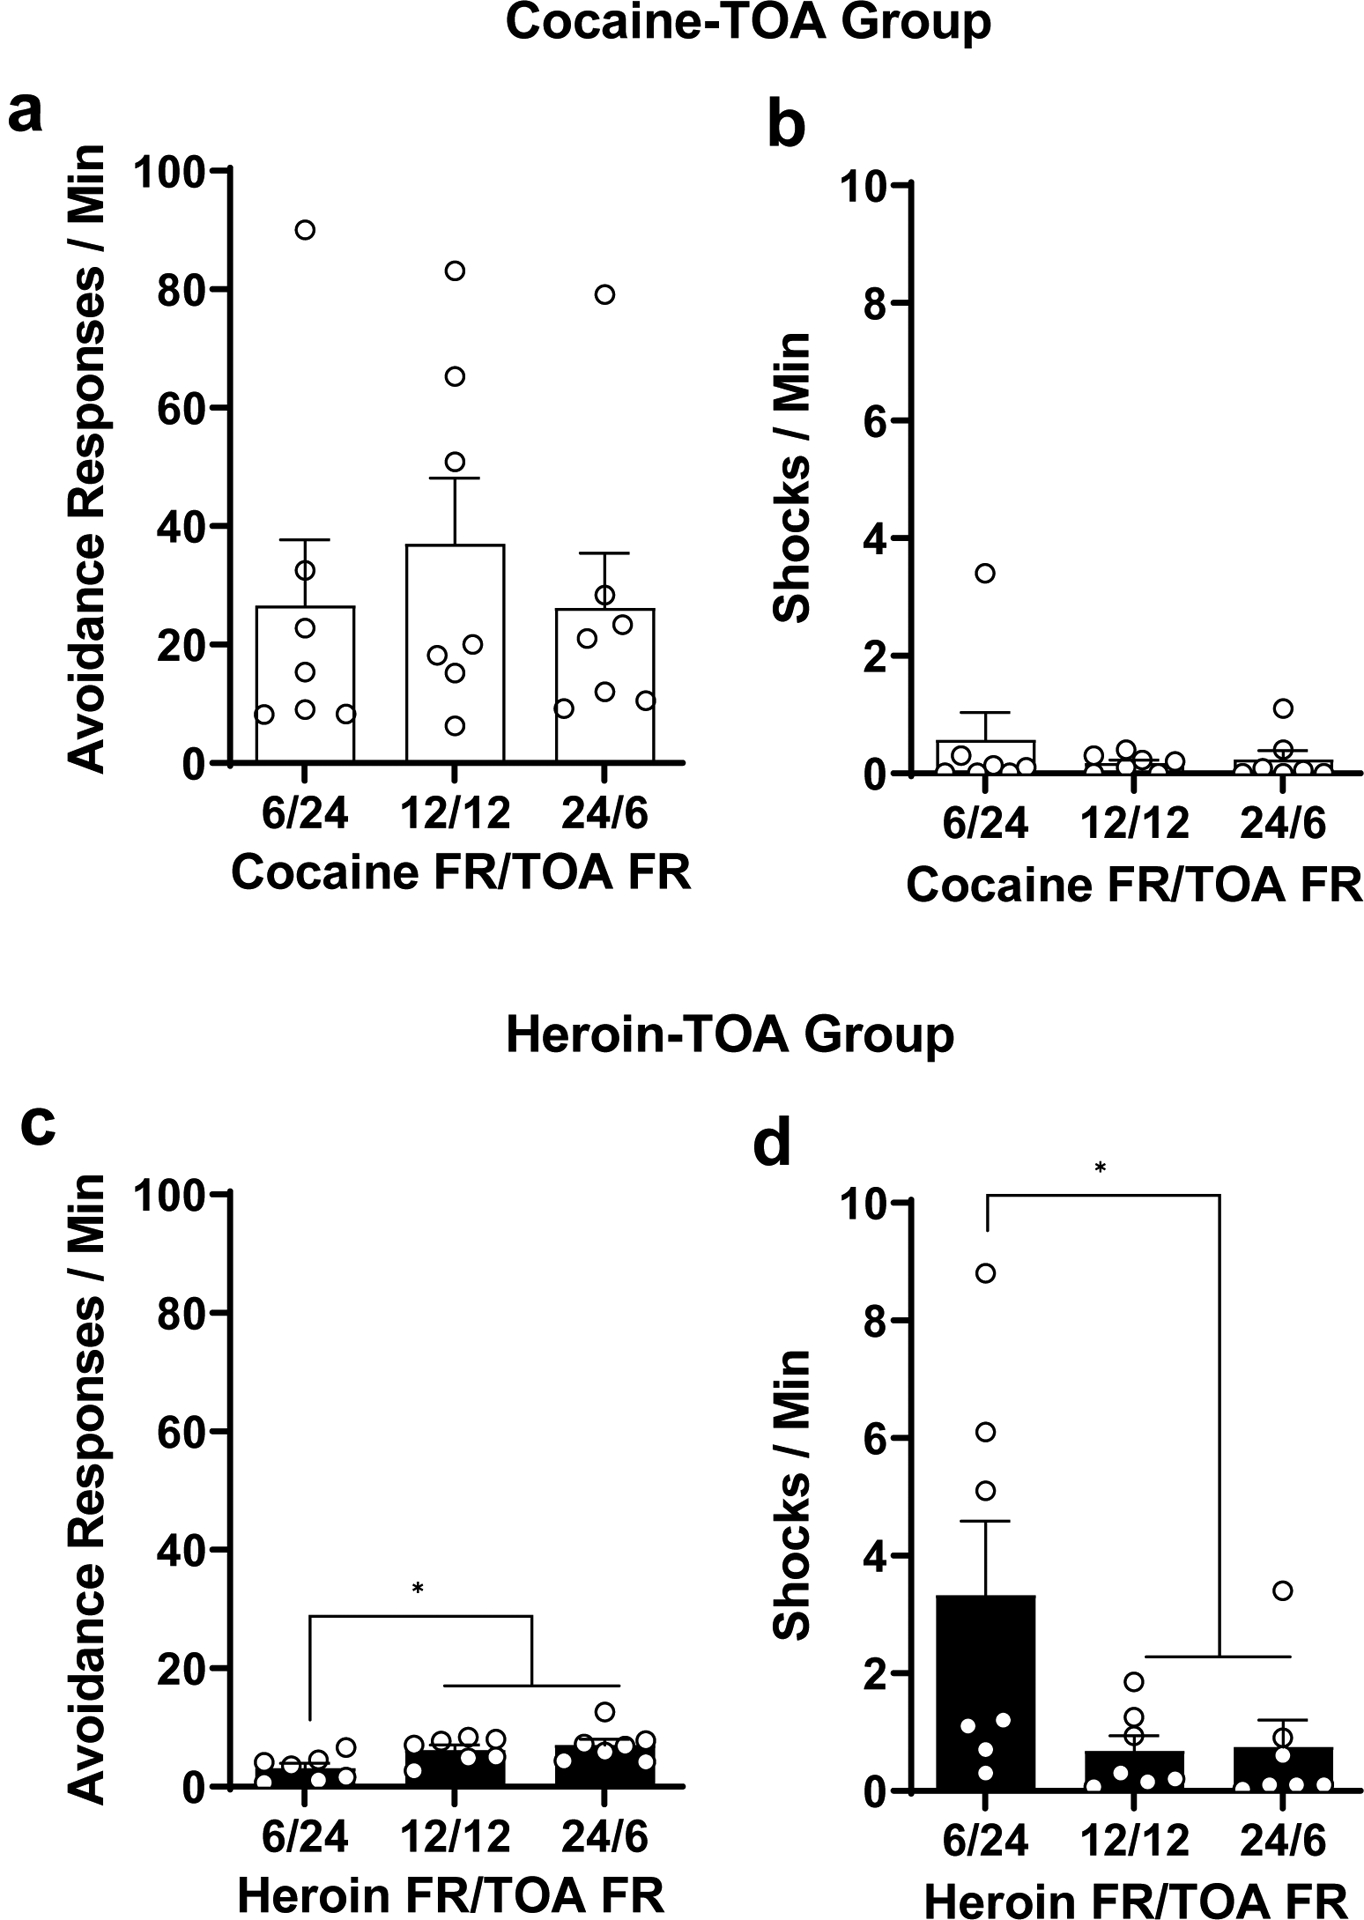
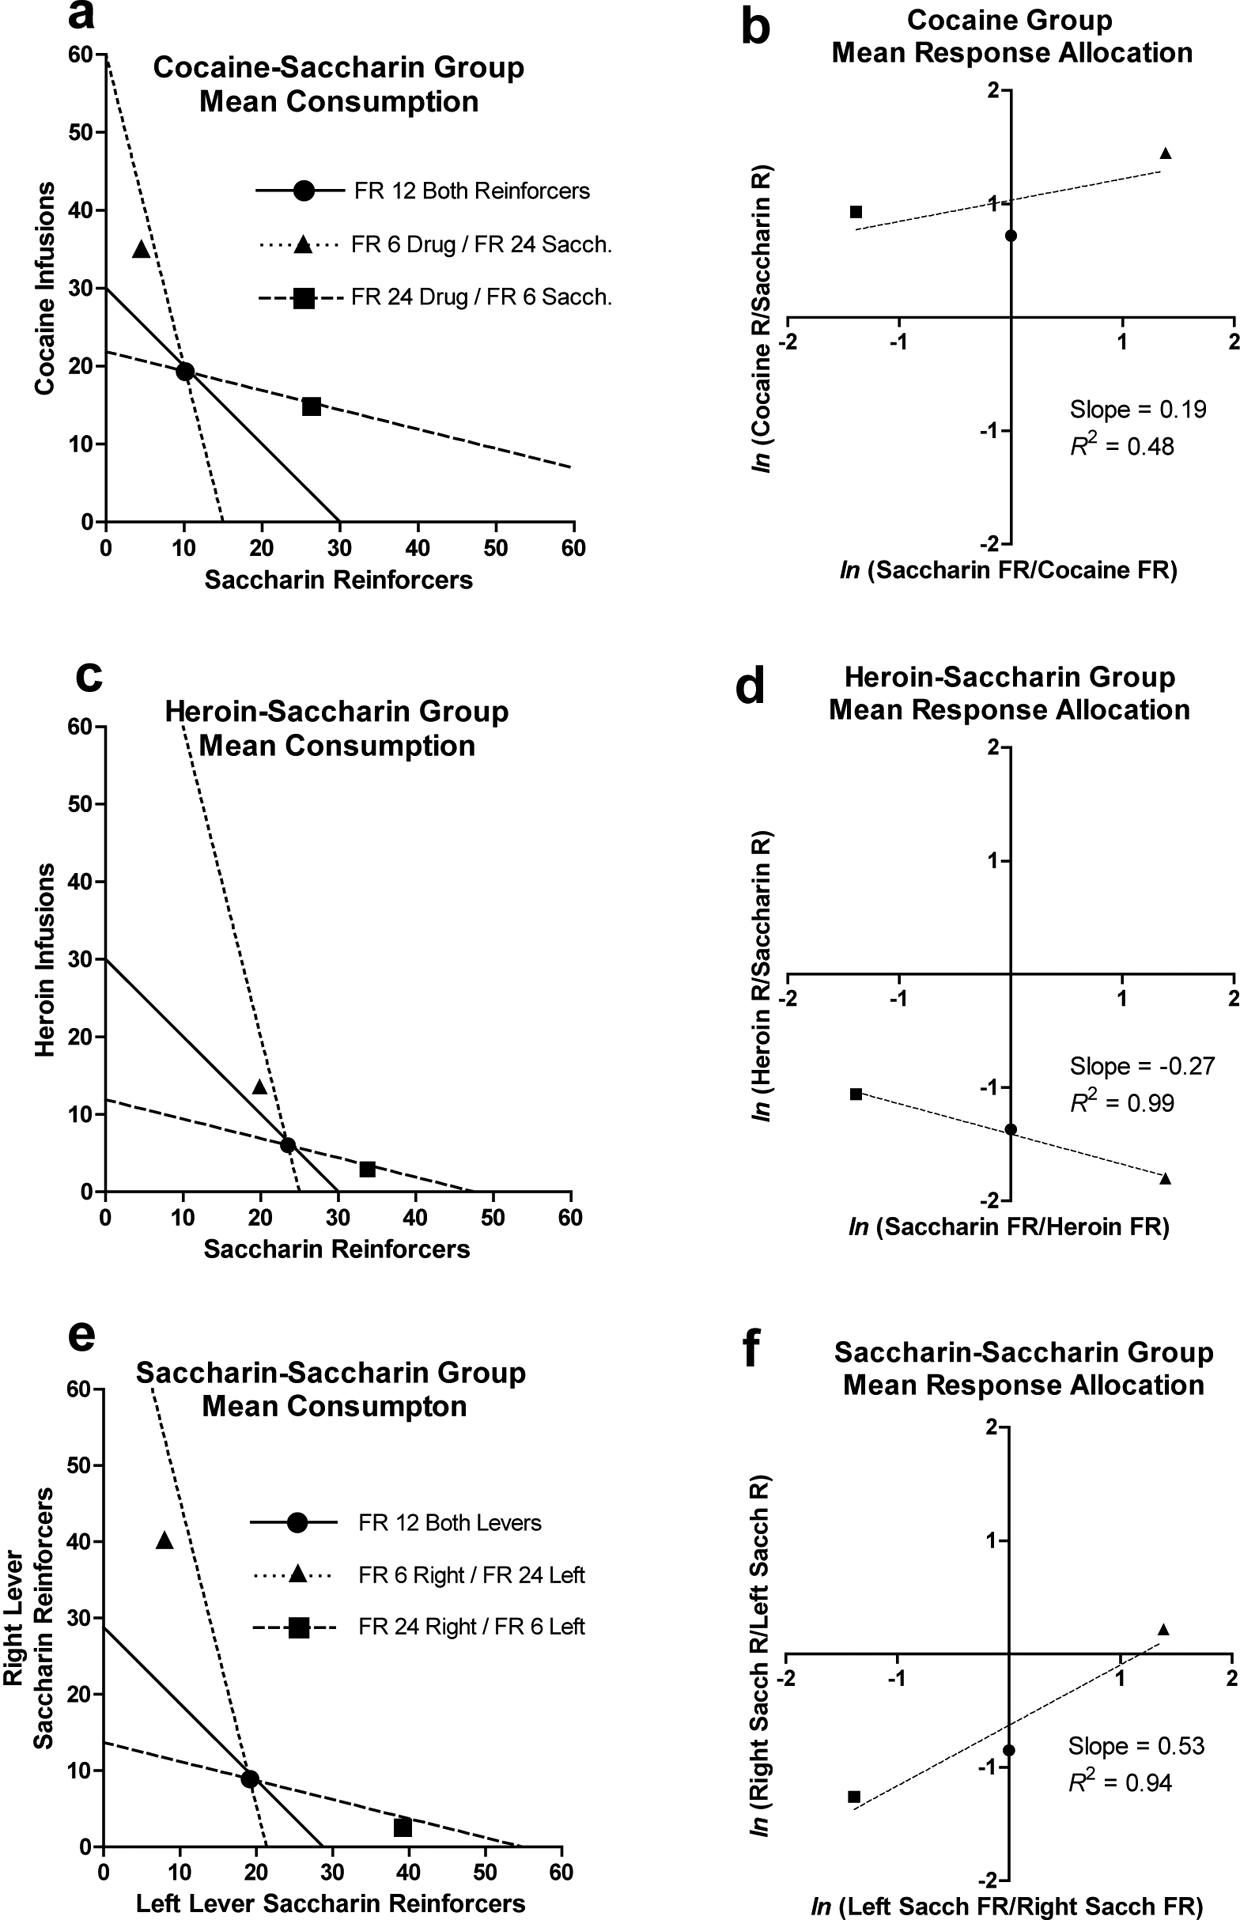
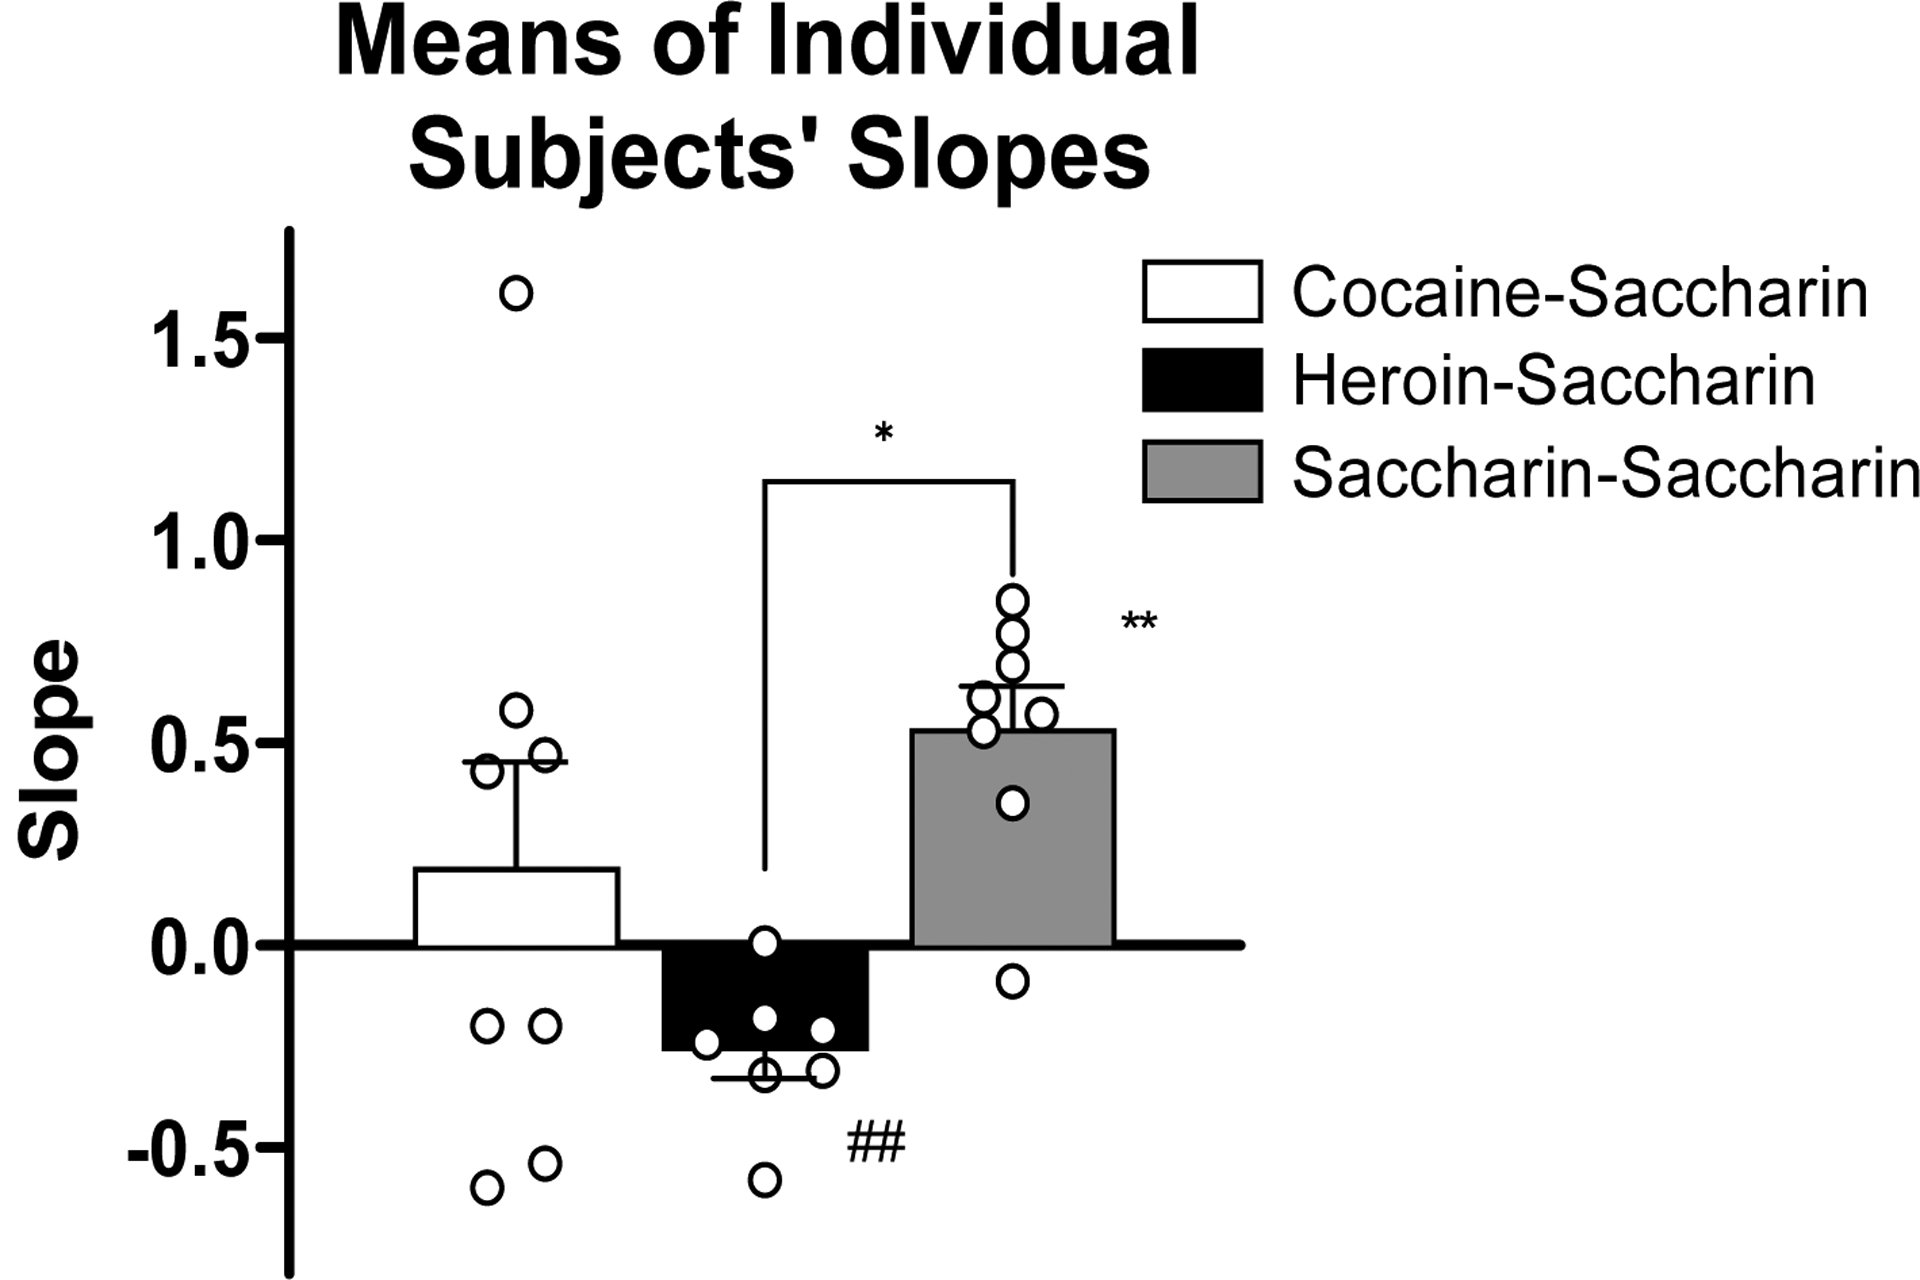
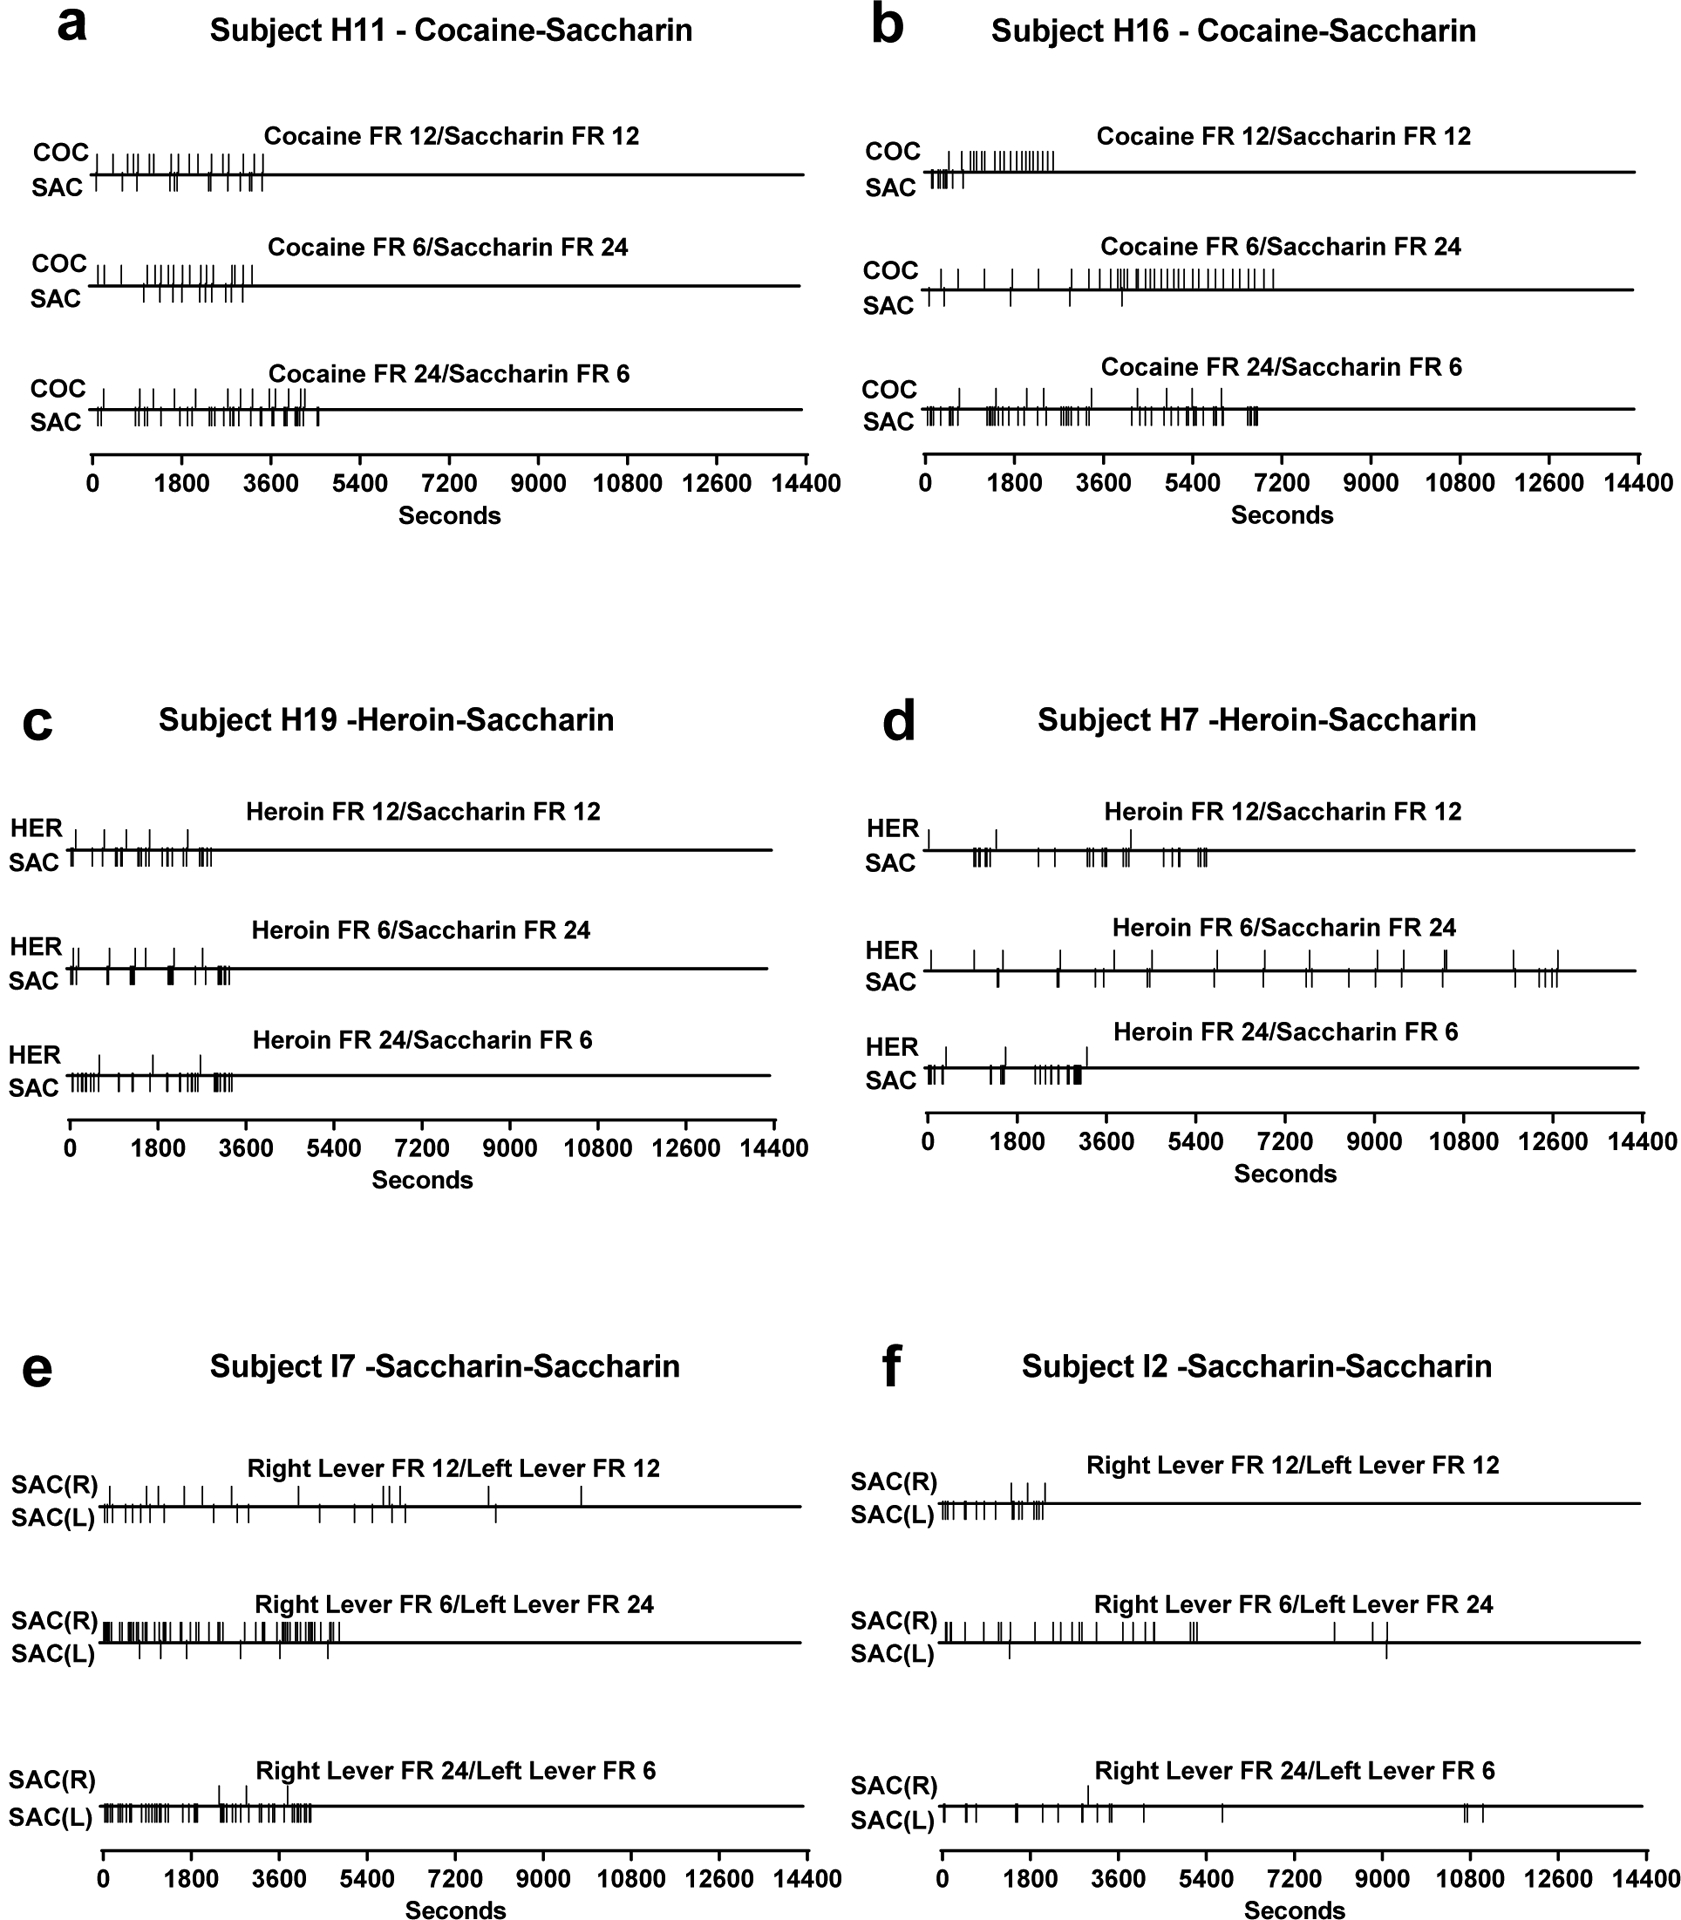
The present study used a rat choice model to test how cocaine or heroin economically interacted with two different nondrug reinforcers along the substitute-to-complement continuum. In Experiment 1, the nondrug alternative was the negative reinforcer timeout-from-avoidance (TOA)-that is, rats could press a lever to obtain a period of safety from footshock. One group of rats chose between cocaine and TOA and another group chose between heroin and TOA. The relative prices of the reinforcers were manipulated across phases while controlling for potential income effects. When cocaine was the reinforcer, rats reacted to price changes by increasing their allocation of behavior to the more expensive option, thereby maintaining relatively proportional intake of cocaine and TOA reinforcers across prices, suggesting these reinforcers were complements here. In contrast, when heroin became relatively cheap, rats increased allocation of income to heroin and decreased allocation of income to TOA, suggesting that heroin substituted for safety. Additionally, rats were willing to accept more footshocks when heroin was easily available. In Experiment 2, the nondrug alternative was saccharin, a positive reinforcer. Heroin and saccharin were complements, but there was no consistent effect of price changes on the allocation of behavior between cocaine and saccharin. As a model of the processes that could be involved in human drug use, these results show that drug-taking behavior depends on the type of drug, the type of nondrug alternative available, and the prices of both. (PsycInfo Database Record (c) 2024 APA, all rights reserved).


Figures

Figure 1.
Figure 1.
Illustration of how consumption of goods that are substitutes, independents, or complements change in response to price changes (based on Fig. 5.19, Allison, 1983). In this hypothetical example, the subject has a budget of 300 responses that can be allocated between reinforcers X and Y. The budget line stretching from 30 on the Y axis to 30 on the X axis in each panel represents the possible bundles of X and Y reinforcers the subject could obtain when the price of each reinforcer is 10 lever presses (i.e., FR 10). The square falling on the line represents the bundle obtained if the subject allocated half its budget to each reinforcer. The more steeply sloped budget line in each panel represents the possible bundles obtained if the price of X were doubled to FR 20 and the price of Y were maintained at FR 10. In panel a, this price change causes the subject to increase its allocation of behavior to Y, a result expected when X and Y are substitutes. In panel b, the subject does not change its allocation of behavior, an outcome observed when X and Y are independents. In panel c, the subject maintains proportional intake of X and Y by increasing its allocation of behavior to the more expensive option, a pattern observed with complements.
Figure 2.
Figure 2.
The left panels show group mean consumption of drug infusions (Y axis) and timeout-from-avoidance (TOA) reinforcers (X axis) in the Cocaine-TOA group (panel a) and the Heroin-TOA group (panel c). The diagonal lines are budget lines, with the solid line representing the equal-price (FR 12 for both reinforcers) condition, the dotted line representing the drug-cheaper condition (drug FR 6, TOA FR 24), and the dashed line representing the TOA cheaper condition (drug FR 24, TOA FR 6). The circles, triangles, and squares represent mean observed consumption in the equal-price, drug-cheaper, and TOA cheaper conditions, respectively. The budget lines are group averages. The budget line in the equal price condition in the Heroin-TOA group intersects the axes at less than 30 because one rat had a budget of 240 instead of 360. The budget lines in the other conditions vary across groups because the budgets were based on the mean reinforcers obtained in the equal-price condition, which varied across groups. The right panels show group mean relative responding [ln(Drug responses:TOA responses)] plotted as a function of relative price (ln(TOA FR:Drug FR) for the Cocaine-TOA group (panel b) and the Heroin TOA group (panel d). The dotted line is the linear regression best-fit line. The circles, triangles, and squares represent mean observed relative responding in the equal-price, drug-cheaper, and TOA cheaper conditions, respectively.
Figure 3.
Figure 3.
Group (± SEM) means of the slopes of the linear regression best-fit lines for individual subjects in Exp. 1. Dots represent individual subjects. *** indicates group mean difference at p < 0.001, ## indicates mean is significantly below zero at p < 0.01, # indicates mean is significantly above zero at p < 0.05.
Figure 4.
Figure 4.
Event records from two subjects in the Cocaine-TOA group (panels a and b) and two subjects in the Heroin-TOA group (panels c and d). The final session from the equal-price (FR 12 FR12), drug cheaper (drug FR 6 TOA FR24), and TOA cheaper (drug FR 24, TOA FR 6) conditions are presented. Upward slash marks indicate cocaine (COC) or heroin (HER) infusions and downward slash marks indicate TOA reinforcers.
Figure 5
Figure 5
(a) Mean (± SEM) avoidance responses per minute on the middle lever in the Cocaine-TOA group averaged over the final three sessions of each price combination. (b) Mean (± SEM) shock rates per minute (over the whole session) in the Cocaine-TOA group averaged over the final three sessions of each price combination. (c) Mean (± SEM) avoidance response rates for the Heroin-TOA group. (d) Mean (± SEM) shock rates for the Heroin-TOA group.
Figure 6.
Figure 6.
The left panels show group mean reinforcer consumption. Panels a and c show group mean consumption of drug infusions (Y axis) and saccharin reinforcers (X axis) in the Cocaine-Saccharin and Heroin-Saccharin groups, respectively. Panel e shows group mean consumption of right lever saccharin reinforcers and left lever saccharin reinforcers in the Saccharin-Saccharin group. The diagonal lines are budget lines, with the solid line representing the equal-price (FR 12 for both reinforcers) condition, the dotted line representing the drug-cheaper condition (or right-lever cheaper condition, in the Saccharin-Saccharin group), and the dashed line representing the saccharin-cheaper condition (or left-lever cheaper condition, in the Saccharin-Saccharin group). The circles, triangles, and squares represent mean observed consumption in each of these conditions, respectively. The budget lines are group averages. The budget line in the equal price condition in the Saccharin-Saccharin group intersects the axes at less than 30 because one rat had a budget of 240 instead of 360. The budget lines in the other conditions vary across groups because the budgets were based on the mean reinforcers obtained in the equal-price condition, which varied across groups. The right panels show group mean relative responding (e.g., ln[Cocaine responses:saccharin responses]) plotted as a function of relative price (e.g., ln(saccharin FR:Cocaine FR) for the Cocaine-Saccharin group (panel b), the Heroin-Saccharin group (panel d), and the Saccharin-Saccharin group (panel f). The dotted line is the linear regression best-fit line. The circles, triangles, and squares represent mean observed relative responding in the equal-price, drug-cheaper (or right-lever cheaper, in the Saccharin-Saccharin group), and saccharin-cheaper (or left-lever cheaper) conditions, respectively.
Figure 7.
Figure 7.
Group means (± SEM) of the best-fit regression line slopes calculated for individual subjects in the Cocaine-Saccharin, Heroin-Saccharin, and Saccharin-Saccharin groups. Dots represent individual subjects. * indicates significant group difference at p < 0.05. ** indicates mean is significantly above zero at p < 0.01. ## indicates mean is significantly below zero at p < 0.01.
Figure 8.
Figure 8.
Event records from two subjects in the Cocaine-Saccharin group (panels a and b), two subjects in the Heroin-Saccharin group (panels c and d), and two subjects in the Saccharin-Saccharin group. The final session from each price combination is presented. Upward slash marks indicate cocaine infusions (COC), heroin (HER) infusions, or saccharin reinforcers obtained from the right lever [SAC (R)]. Downward slash marks indicate saccharin (SAC) reinforcers obtained by the Cocaine-Saccharin and Heroin-Saccharin group and saccharin reinforcers specifically obtained by pressing the left lever [SAC (R)] in the Saccharin-Saccharin group.

Similar articles

Cited by

References

    1. Addicott MA, Pearson JM, Sweitzer MM, Barack DL, & Platt ML (2017). A primer on foraging and the explore/exploit trade-off for psychiatry research. Neuropsychopharmacology, 42, 1931–1939. - PMC - PubMed
    1. Ahmed SH (2010). Validation crisis in animal models of drug addiction: beyond non-disordered drug use toward drug addiction. Neuroscience & Biobehavioral Reviews, 35, 172–184. - PubMed
    1. Allison J (1983). Behavioral Economics. New York: Praeger.
    1. Beardsley PM, & Shelton KL (2012). Prime‐, Stress‐, and Cue‐Induced Reinstatement of Extinguished Drug‐Reinforced Responding in Rats: Cocaine as the Prototypical Drug of Abuse. Current Protocols in Neuroscience, 61, 9–39. - PMC - PubMed
    1. Belke TW, Pierce WD, & Duncan ID (2006). Reinforcement value and substitutability of sucrose and wheel running: Implications for activity anorexia. Journal of the Experimental Analysis of Behavior, 86, 131–158. - PMC - PubMed