. 2023 Aug 3;18(8):e0289343.
doi: 10.1371/journal.pone.0289343. eCollection 2023.

Understanding the efficacy of wastewater surveillance for SARS-CoV-2 in two diverse communities

Affiliations

Understanding the efficacy of wastewater surveillance for SARS-CoV-2 in two diverse communities

Matthew T Flood et al. PLoS One. .

Abstract

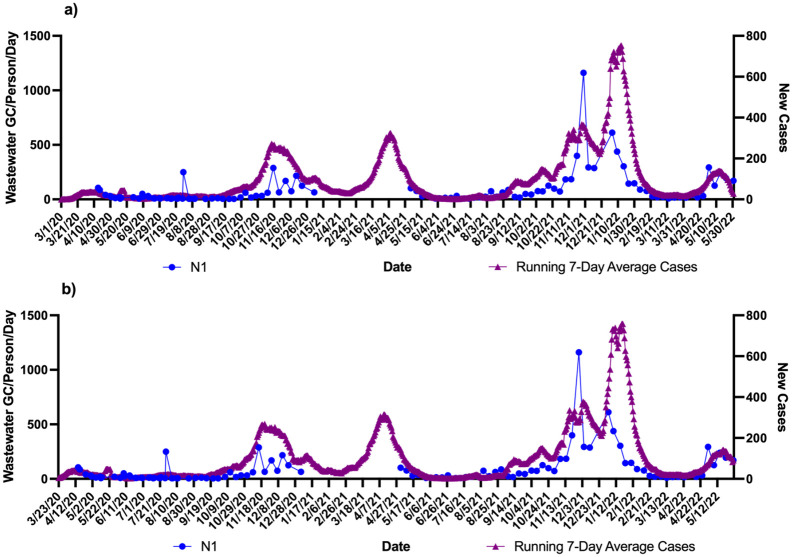
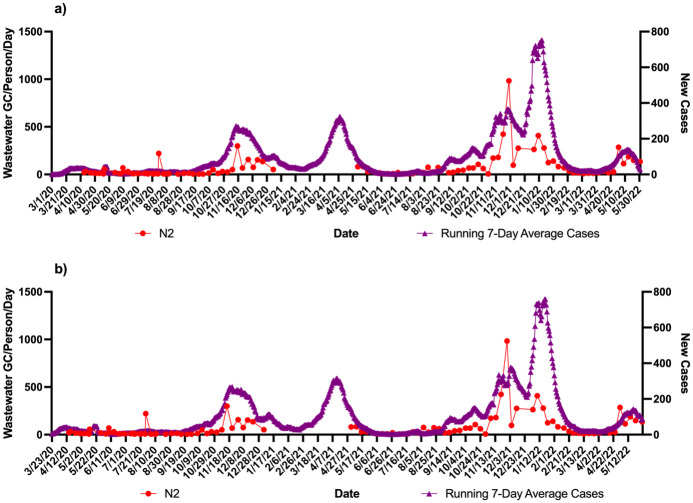
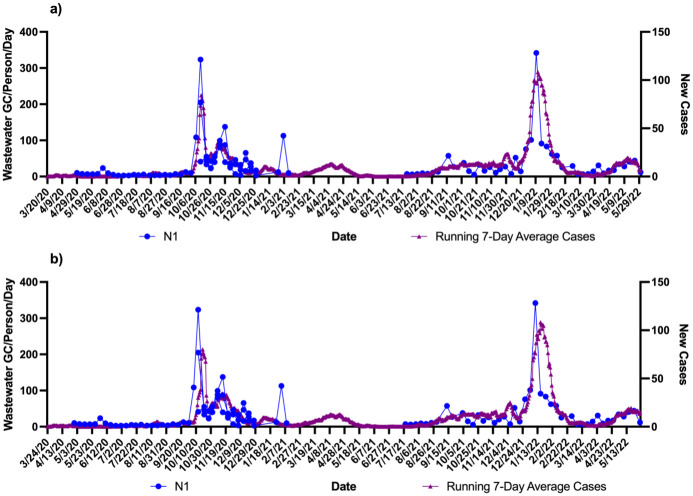
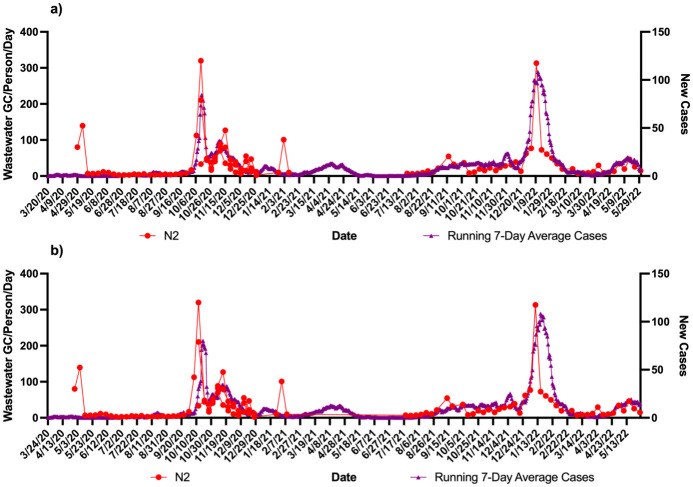
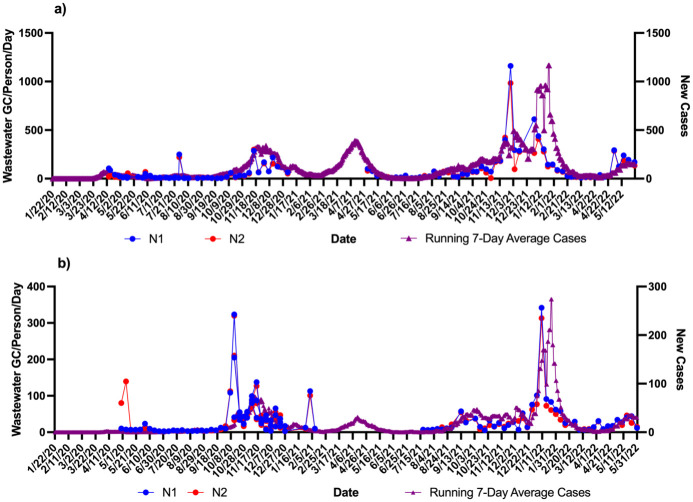
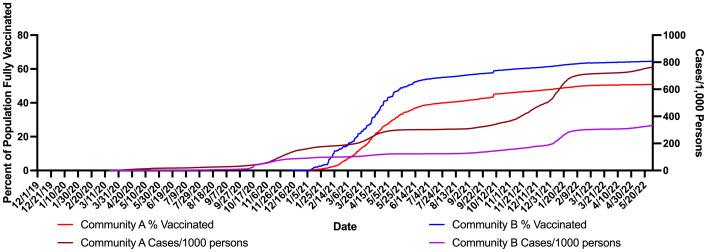
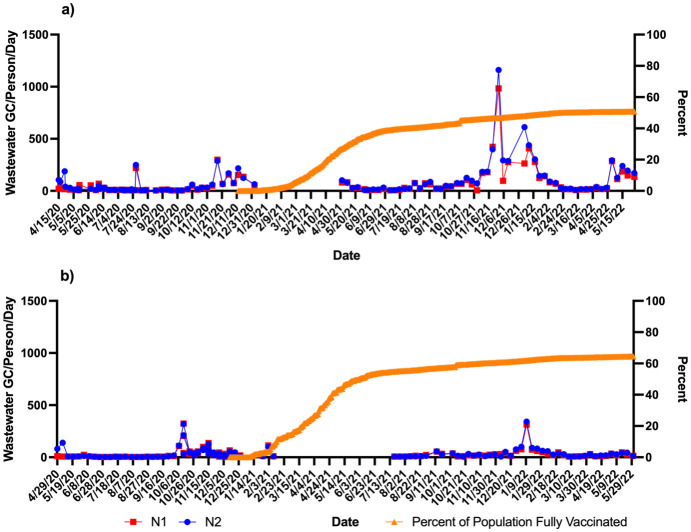
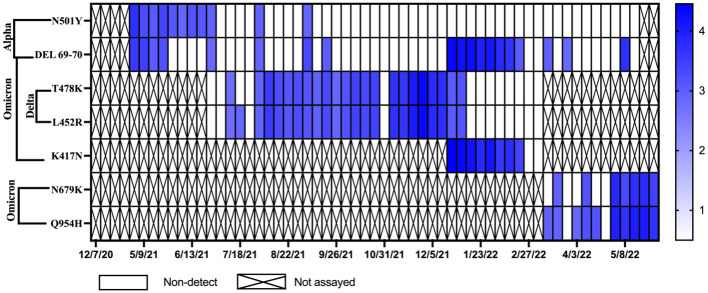
During the COVID-19 pandemic, wastewater-based surveillance has been shown to be a useful tool for monitoring the spread of disease in communities and the emergence of new viral variants of concern. As the pandemic enters its fourth year and clinical testing has declined, wastewater offers a consistent non-intrusive way to monitor community health in the long term. This study sought to understand how accurately wastewater monitoring represented the actual burden of disease between communities. Two communities varying in size and demographics in Michigan were monitored for SARS-CoV-2 in wastewater between March of 2020 and February of 2022. Additionally, each community was monitored for SARS-CoV-2 variants of concern from December 2020 to February 2022. Wastewater results were compared with zipcode and county level COVID-19 case data to determine which scope of clinical surveillance was most correlated with wastewater loading. Pearson r correlations were highest in the smaller of the two communities (population of 25,000) for N1 GC/person/day with zipcode level case data, and date of the onset of symptoms (r = 0.81). A clear difference was seen with more cases and virus signals in the wastewater of the larger community (population 110,000) when examined based on vaccine status, which reached only 50%. While wastewater levels of SARS-CoV-2 had a lower correlation to cases in the larger community, the information was still seen as valuable in supporting public health actions and further data including vaccination status should be examined in the future.


Conflict of interest statement

The authors have declared that no competing interests exist.

Figures

Fig 1
Fig 1. Wastewater surveillance data (N1 gene target) for WWTP A (N = 106) (GC/Person/Day) and COVID-19 zipcode case data over time.
a) N1 vs. case using onset of symptoms for running 7-day average case data for COVID-19 (r = 0.71 p<0.0001; n = 106 paired data points); b) N1 vs. case using referral date for running 7-day average case data for COVID-19 (r = 0.62 p<0.0001; n = 106 paired data points). aZipcode level population data were used for wastewater results normalization; bA gap in sampling occurred between January/February and May/July 2021 due to the ending of one project’s funding and the start of another.
Fig 2
Fig 2. Wastewater surveillance data (N2 gene target) for WWTP A (N = 106) (GC/Person/Day) and COVID-19 zipcode case data over time.
a) N2 vs. case using onset of symptoms for running 7-day average case data for COVID-19 (r = 0.66 p<0.0001; n = 106 paired data points); b) N2 vs. case using referral date for running 7-day average case data for COVID-19 (r = 0.60 p<0.0001; n = 106 paired data points). aZipcode level population data were used for wastewater results normalization; bA gap in sampling occurred between January/February and May/July 2021 due to the ending of one project’s funding and the start of another.
Fig 3
Fig 3. Wastewater surveillance data (N1 gene target) for WWTP B (N = 108) (GC/Person/Day) and COVID-19 zipcode case data over time.
a) N1 vs. case using onset of symptoms for running 7-day average case data for COVID-19 (r = 0.81 p<0.0001; n = 82 paired data points); b) N1 vs. case using referral date for running 7-day average case data for COVID-19 (r = 0.60 p<0.0001; n = 73 paired data points). aZipcode level population data were used for wastewater results normalization; bA gap in sampling occurred between January/February and May/July 2021 due to the ending of one project’s funding and the start of another.
Fig 4
Fig 4. Wastewater surveillance data (N2 gene target) for WWTP B (N = 108) (GC/Person/Day) and COVID-19 zipcode case data over time.
a) N2 vs. case using onset of symptoms for running 7-day average case data for COVID-19 (r = 0.72 p<0.0001; n = 82 paired data points); b) N2 vs. case using referral date for running 7-day average case data for COVID-19 (r = 0.51 p<0.0001; n = 73 paired data points). aZipcode level population data were used for wastewater results normalization; bA gap in sampling occurred between January/February and May/July 2021 due to the ending of one project’s funding and the start of another.
Fig 5
Fig 5. Wastewater surveillance data (N = 108) (GC/person/day using zipcode level population) compared to county level COVID-19 clinical case data over time using referral dates only.
a) WWTP A SARS-CoV-2 gene target results vs. county level case data for COVID-19 (N1 r = 0.59 p<0.0001, N2 r = 0.56 p<0.0001; n = 106 paired data points); b) WWTP B SARS-CoV-2 gene target results vs. county level COVID-19 case data (N1 r = 0.53 p<0.0001, N2 r = 0.46 p<0.0001; n = 73 paired data points). aZipcode level population data were used for wastewater results normalization; bA gap in sampling occurred between January/February and May/July 2021 due to the ending of one project funding and the start of another.
Fig 6
Fig 6. Percent of population fully vaccinated compared with county level cases per 1,000 persons for Community A and Community B.
Fig 7
Fig 7. Percent of population fully vaccinated compared with wastewater SARS-CoV-2 gene targets (N1 and N2 (GC/Person/Day).
a) WWTP A; b) WWTP B. aZipcode level population data were used for wastewater results normalization; bA gap in sampling occurred between January/February and May/July 2021 due to the ending of one project’s funding and the start of another.
Fig 8
Fig 8. Concentrations of SARS-CoV-2 variant genes for the Alpha, Delta, and Omicron variants over time in Community A.
Samples positive for the N501Y and DEL 69–70 gene mutations indicate the potential presence of the Alpha variant. Samples positive for the T478K and L452R gene mutations indicate the presence of the Delta variant. Samples positive for the K417N and DEL 69–70 gene mutations indicate the presence of the Omicron variant. Empty squares represent Non-detects (NDs) and X’s were samples that were not assayed for that marker.
Fig 9
Fig 9. Concentrations of SARS-CoV-2 variant genes for the Alpha, Delta, and Omicron variants over time in Community B.
Samples positive for the N501Y and DEL 69–70 gene mutations indicate the potential presence of the Alpha variant. Samples positive for the T478K and L452R gene mutations indicate the presence of the Delta variant. Samples positive for the K417N and DEL 69–70 gene mutations indicate the presence of the Omicron variant. Empty squares represent Non-detects (NDs) and X’s were samples that were not assayed for that marker.

References

    1. National Academies of Sciences, Engineering, and Medicine. 2023. Wastewater-based Disease Surveillance for Public Health Action. Washington, DC: The National Academies Press. - PubMed
    1. Ferraro GB; Veneri C; Mancini P; Iaconelli M; Suffredini E; Bonadonna L; et al. A State-of-the-Art Scoping Review on SARS-CoV-2 in Sewage Focusing on the Potential of Wastewater Surveillance for the Monitoring of the COVID-19 Pandemic 2022. Food and Environmental Virology Volume14 Issue4, Page 315–354. doi: 10.1007/s12560-021-09498-6 - DOI - PMC - PubMed
    1. Parasa S., Desai M., Chandrasekar V.T., Patel H.K., Kennedy K.F., Roesch T., et al. Prevalence of Gastrointestinal Symptoms and Fecal Viral Shedding in Patients with Coronavirus Disease 2019. Jama Netw Open 2020;3: e2011335. doi: 10.1001/jamanetworkopen.2020.11335 - DOI - PMC - PubMed
    1. Wang W., Xu Y., Gao R., Lu R., Han K., Wu G., et al. Detection of SARS-CoV-2 in Different Types of Clinical Specimens. Jama 2020;323: 1843–1844. doi: 10.1001/jama.2020.3786 - DOI - PMC - PubMed
    1. Zheng S., Fan J., Yu F., Feng B., Lou B., Zou Q., et al. Viral Load Dynamics and Disease Severity in Patients Infected with SARS-CoV-2 in Zhejiang Province, China, January-March 2020: Retrospective Cohort Study. Bmj 2020;369: m1443. doi: 10.1136/bmj.m1443 - DOI - PMC - PubMed

Publication types

Supplementary concepts