. 2023 Aug 3;18(8):e0289358.
doi: 10.1371/journal.pone.0289358. eCollection 2023.

Transcriptional signatures measured in whole blood correlate with protection against tuberculosis in inbred and outbred mice

Affiliations

Transcriptional signatures measured in whole blood correlate with protection against tuberculosis in inbred and outbred mice

Sherry L Kurtz et al. PLoS One. .

Abstract

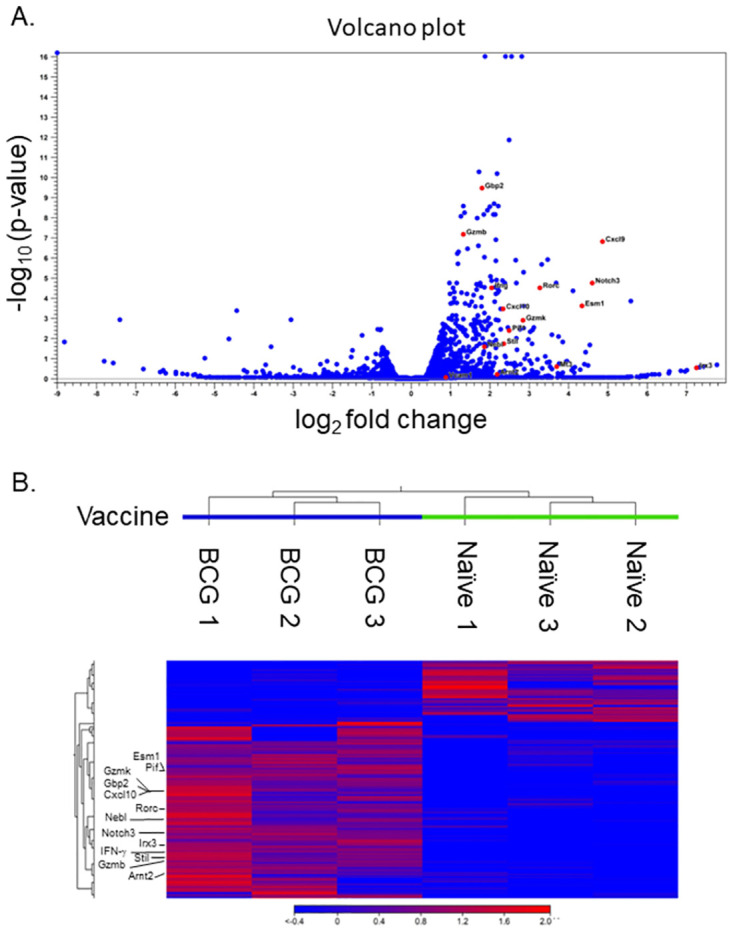
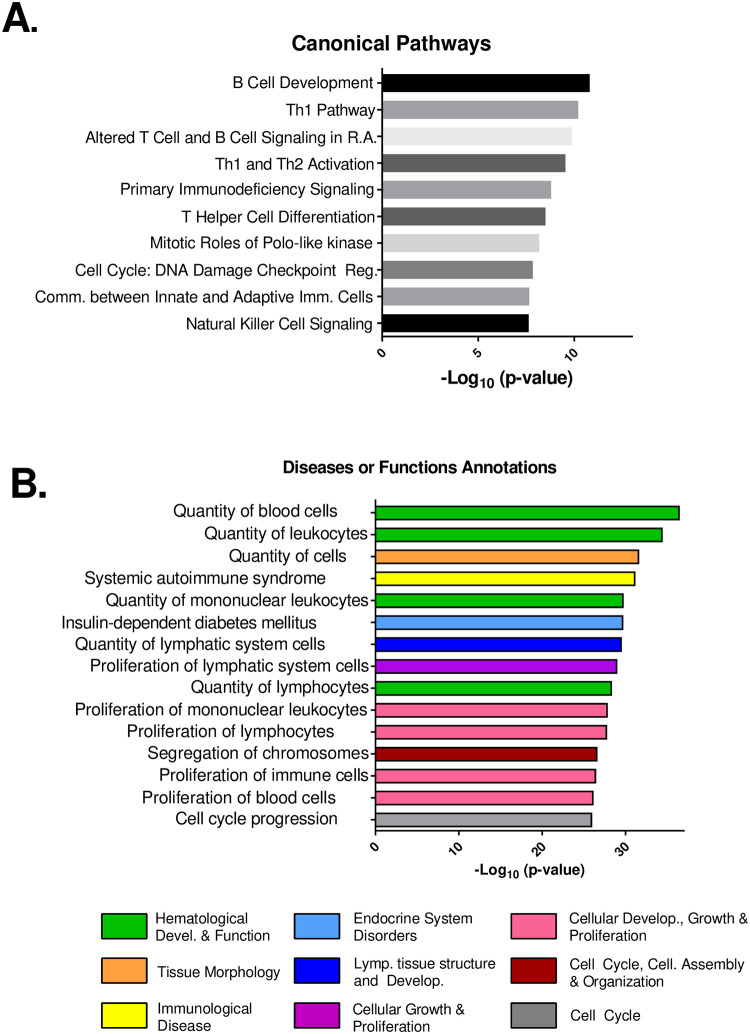
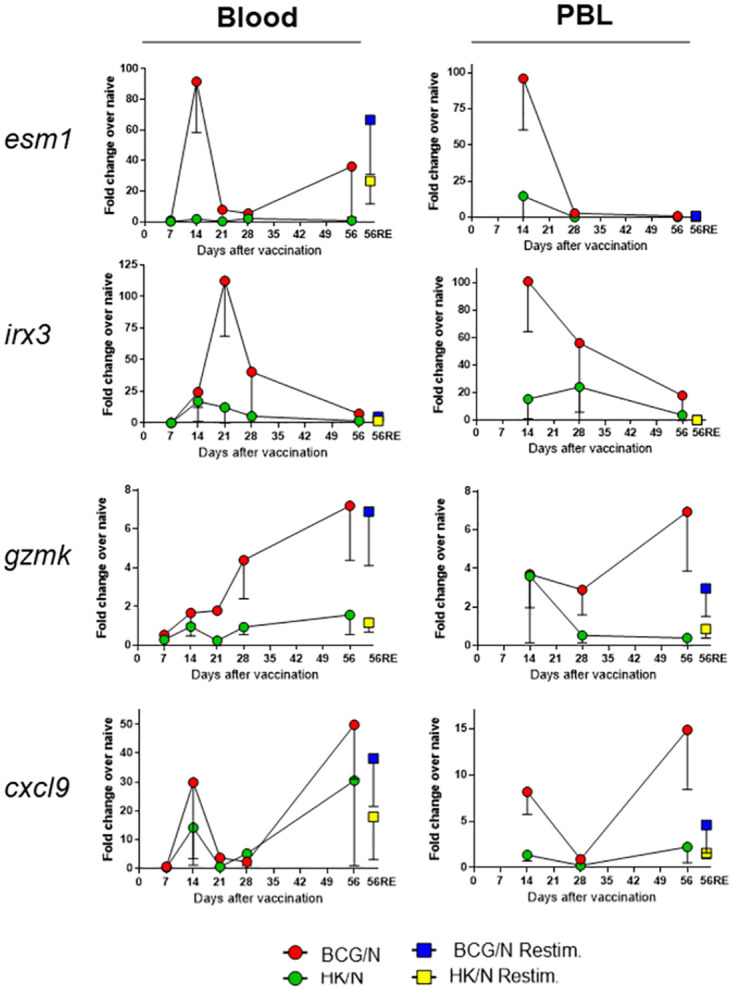
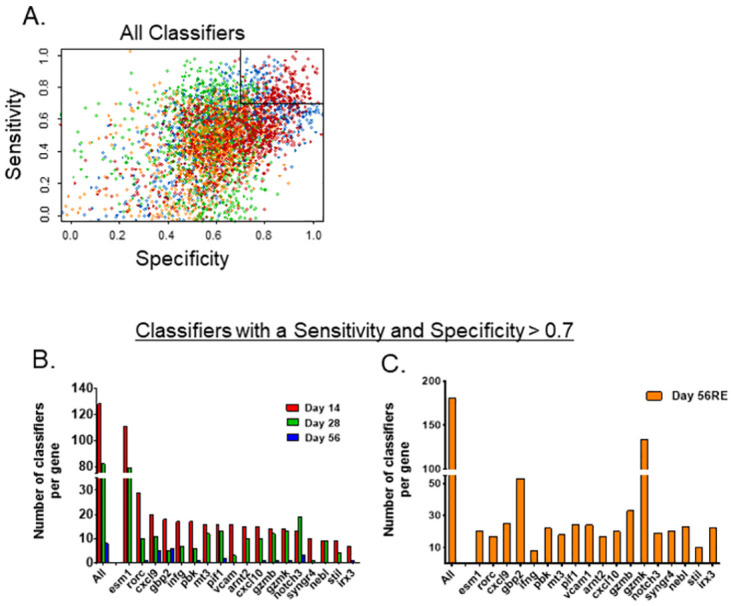
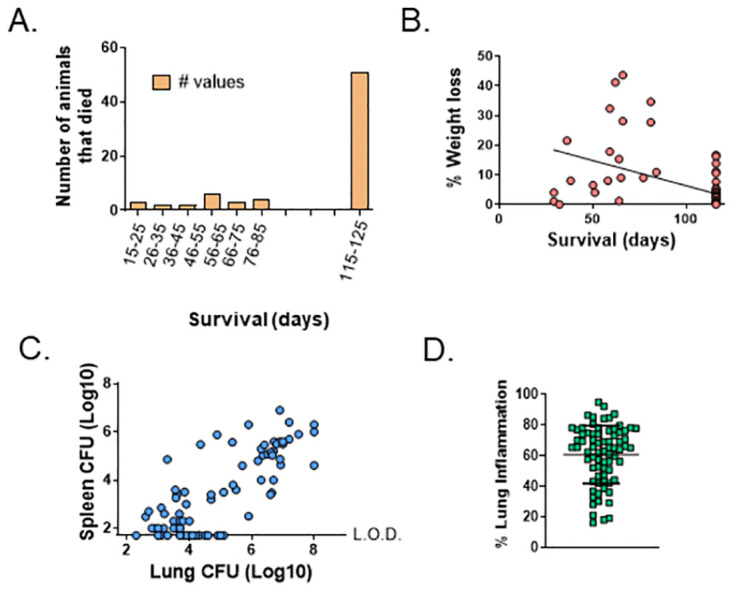
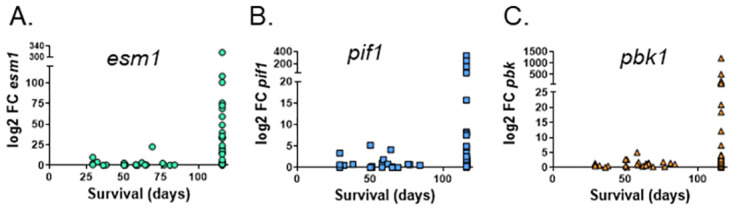
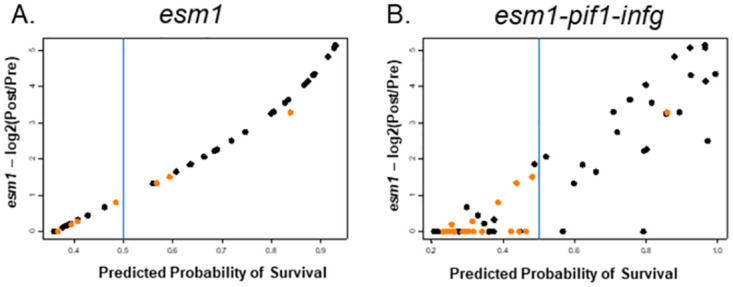
Although BCG has been used for almost 100 years to immunize against Mycobacterium tuberculosis, TB remains a global public health threat. Numerous clinical trials are underway studying novel vaccine candidates and strategies to improve or replace BCG, but vaccine development still lacks a well-defined set of immune correlates to predict vaccine-induced protection against tuberculosis. This study aimed to address this gap by examining transcriptional responses to BCG vaccination in C57BL/6 inbred mice, coupled with protection studies using Diversity Outbred mice. We evaluated relative gene expression in blood obtained from vaccinated mice, because blood is easily accessible, and data can be translated to human studies. We first determined that the average peak time after vaccination is 14 days for gene expression of a small subset of immune-related genes in inbred mice. We then performed global transcriptomic analyses using whole blood samples obtained two weeks after mice were vaccinated with BCG. Using comparative bioinformatic analyses and qRT-PCR validation, we developed a working correlate panel of 18 genes that were highly correlated with administration of BCG but not heat-killed BCG. We then tested this gene panel using BCG-vaccinated Diversity Outbred mice and revealed associations between the expression of a subset of genes and disease outcomes after aerosol challenge with M. tuberculosis. These data therefore demonstrate that blood-based transcriptional immune correlates measured within a few weeks after vaccination can be derived to predict protection against M. tuberculosis, even in outbred populations.


Conflict of interest statement

The authors have declared that no competing interests exist.

Figures

Fig 1
Fig 1. Live BCG protects C57BL/6 mice against M. tuberculosis aerosol challenge and induces expression of a subset of immune-related genes in blood over time.
A) Groups of five C57 mice were intradermally vaccinated with 105 CFU of BCG (BCG), heat-killed BCG (HK-BCG), or PBS (naïve) as a naïve control group. Mice were aerogenically challenged with ~ 100 CFU of M.tb. eight weeks after vaccination and euthanized 4 weeks after challenge to enumerate M.tb. CFU. Data presented represent the mean log10 M.tb. burden ± SD in lungs. Results shown are from one representative experiment of three of similar design and outcome. B) Groups of three C57 mice were intradermally vaccinated with 105 CFU of BCG or PBS as a naïve control group. Mice were euthanized at the indicated times after vaccination, and cardiac blood and PBL were collected. RNA from blood or PBL for each group was pooled and assessed by qRT-PCR for the expression of ifng, gzmb, prf, nos2, csf2, and hmox1. The relative expression of each gene in BCG samples compared to naïve (PBS) samples was calculated. The average fold change for single representative of three independent experiments is represented. * p < 0.05 by Student’s t test.
Fig 2
Fig 2. RNASeq analyses identify genes in mouse blood whose expression is induced by BCG vaccination.
Groups of three C57 mice were intradermally vaccinated with 105 CFU of BCG or PBS as a naïve control group. Mice were euthanized 14 days after vaccination, cardiac blood was collected for RNA isolation, and RNA was pooled from mice within each group. This experiment was repeated three times, and three sets of pooled BCG-vaccinated and naïve RNA samples were submitted for RNASeq. Gene expression was evaluated by comparing samples from BCG-vaccinated and naïve mice. (A) Differentially expressed genes are visualized by volcano plot, where the magnitude of expression difference is presented (log2 ratio) on the X-axis compared to the significance (-log10 FDR p-value) on the Y-axis for each gene, reflecting expression changes between BCG-vaccinated and naïve mice. Representative genes that were chosen for downstream analyses are shown in red dots and labeled with their gene names. (B) The heat map illustrates the log2 fold change up (red) or down (blue) for the top DEG, as selected by genes from RNASeq analyses with a minimum fold change of 1.5 and with p < 0.05. Cluster relationships based on Euclidian distance among samples from three independent experiments are annotated. Representative genes that were chosen for downstream analyses are labeled with their gene names.
Fig 3
Fig 3. RNASeq analyses of transcriptional changes induced by BCG vaccination reveal canonical biological pathways associated with protection.
Using transcriptional expression data derived from RNASeq, we performed analyses with Ingenuity Pathway Analysis software (IPA, Qiagen). Analyses focused on genes with a minimum of 1.5-fold change by RNASeq and a p-value < 0.05, calculated from triplicate independent samples from BCG vs. naïve (PBS) mice. This dataset included 814 genes. A) Core Expression analyses revealed canonical biological pathways predicted to be influenced by changes in gene expression. Bars depict the -log10 p-value for each canonical pathway, based on the number of representative genes in that pathway and the strength of the transcriptional changes. B) Bioprofiler analyses revealed disease associations or functional biological pathways predicted to be influenced by changes in gene expression. Bars depict the -log10 p-value for each disease or functional subset based on the number of representative genes in that pathway and the strength of the transcriptional change. Colors indicate the biological process superfamily that incorporates the noted individual pathways.
Fig 4
Fig 4. Independent validation of a subset of genes by qRT-PCR demonstrates differential expression in blood and PBL between protective versus non-protective vaccination conditions.
Groups of five mice were vaccinated with PBS, BCG, or HK-BCG, and were euthanized at 7, 14, 21, 28, and 56 days after vaccination. Blood and PBL were collected and isolated from individual animals, and RNA was prepared as described. Additionally, aliquots of blood and PBL from day 56 samples were re-stimulated ex vivo with heat-killed BCG (56RE). From the RNASeq results, 94 of the strongest gene candidates were chosen for re-screening by qRT-PCR across the time course. Of these 94 genes, expression results for the top four candidates in blood and PBL are depicted: esm1, irx3, gzmk, and cxcl9. These experiments were repeated two (day 7 and 21) to four (days 14, 28, 56, and 56RE) times using independent batches of vaccinated mice. Data represent the average and standard deviation (half error bars) for experimental replicates at each time point.
Fig 5
Fig 5. Selected gene classifiers exhibit strong sensitivity and specificity.
A) The specificity and sensitivity for all classifiers from blood transcriptional analyses considered are shown for day 14 (blue), day 28 (green), day 56 (orange), and 56 re-stimulated (red). For each time point, 987 classifiers were constructed, of which 18 included one variable (i.e., one gene), 153 included two variables, and 816 included three variables. 401 classifiers with both sensitivity and specificity above 0.7 were considered to be good (upper right boxed region). B) The bar graphs depict the number of good classifiers (i.e., classifiers with both sensitivity and specificity above 0.7), in which each gene was an explanatory variable in the classifier for the indicated time points (B) day 14 (red), day 28 (green), day 56 (blue), and (C) day 56 re-stimulated (56RE, orange).
Fig 6
Fig 6. Heterogenous outcomes following BCG-vaccination/M.tb. challenge in DO mice selected for these studies.
From a larger study of ~ 1000 DO mice, animals were ranked based on lung and spleen CFU and survival; for the present analyses, animals with the highest and lowest CFU burdens, as well as those and that succumbed to infection before 14 weeks early, were chosen. Outcomes are illustrated for the 107 female DO mice included here that were vaccinated with 105 CFU of BCG, challenged aerogenically with M.tb. 8 weeks after vaccination, and monitored for survival through 14 weeks. Animal weights were collected weekly throughout the experiment. Lungs and spleens were processed and plated to enumerate M.tb. CFU from animals that survived through 14 weeks or that were humanely euthanized prior to 14 weeks due to early morbidity. A lobe was taken from each mouse lung at necropsy and fixed in formalin. Tissues were sectioned, slides were prepared, and slides were H&E stained for histopathological analyses. The proportion of lung tissue with disease involvement was quantitated by densitometry. A) Number of animals that succumbed to infection or were euthanized within each time period. B) Weight loss of each animal as determined by the final body weight/peak body weight. C) Spleen and lung M.tb. burdens for each animal. D) Proportion (%) lung inflammation with mean and standard deviation across the DO population.
Fig 7
Fig 7. Expression of a subset of correlates genes increases after vaccination in outbred mice.
Blood was collected by the tail vein 2 weeks before and 2 weeks after vaccination for each of the selected 107 DO mice (Fig 6) and was processed for RNA isolation. A subset of 11 genes were chosen from the C57 correlate gene panel for analyses in the DO blood RNA (S1 Table). Gene expression was determined by qRT-PCR using gene-specific TaqMan primers/probes, and each gene was normalized to a housekeeping control gene. Gene expression was determined in each pre- and post- vaccination sample, and the log2 change in the fold expression between post/pre vaccination was calculated. Data from the genes A) esm1, B) pif1, and C) pbk1 are presented, where each dot represents the value from an individual mouse, linked to the survival of that mouse on the X-axis.
Fig 8
Fig 8. Single and multigene classifiers can predict survival of BCG-vaccinated/M.tb. challenged DO with high specificity and sensitivity.
Modeling analyses were performed with gene expression data from selected DO mice. The predictive probability of survival for individual mice (dots) is presented on the X-axis, with the log2 transformed differential expression of the gene esm1 between post-vaccination and pre-vaccination blood samples (log2 POST/PRE) represented on the Y-axis. Orange represents animals that were predicted to be “unprotected” (i.e., to succumb early). A) The differential gene expression of esm1 alone predicted survival of the mice with high specificity. B) Combining gene expression data from esm1, pif1, and ifng improved sensitivity and specificity for predicting survival. For A, sensitivity = 0.468, specificity = 0.900 (n = 66 mice). For B, sensitivity = 0.590, specificity = 0.961 (n = 77 mice).

Similar articles

Cited by

References

    1. World Health Organization. Global tuberculosis report 2022. 2022.
    1. Ahmed A, Rakshit S, Adiga V, Dias M, Dwarkanath P, D’Souza G, et al.. A century of BCG: Impact on tuberculosis control and beyond. Immunol Rev. 2021. Epub 2021/05/07. doi: 10.1111/imr.12968 . - DOI - PubMed
    1. Scriba TJ, Netea MG, Ginsberg AM. Key recent advances in TB vaccine development and understanding of protective immune responses against Mycobacterium tuberculosis. Semin Immunol. 2020;50:101431. Epub 2020/12/07. doi: 10.1016/j.smim.2020.101431 - DOI - PMC - PubMed
    1. Kurtz SL, Elkins KL. Correlates of vaccine-induced protection against Mycobacterium tuberculosis revealed in comparative analyses of lymphocyte populations. Clin Vaccine Immunol. 2015;22(10):1096–108. doi: 10.1128/CVI.00301-15 - DOI - PMC - PubMed
    1. Kurtz SL, Gardina PJ, Myers TG, Ryden P, Elkins KL. Whole genome profiling refines a panel of correlates to predict vaccine efficacy against Mycobacterium tuberculosis. Tuberculosis (Edinb). 2020;120:101895. Epub 2020/02/25. doi: 10.1016/j.tube.2019.101895 . - DOI - PubMed