. 2023 Aug 4;381(6657):508-514.
doi: 10.1126/science.adf8974. Epub 2023 Aug 3.

Human STING is a proton channel

Affiliations

Human STING is a proton channel

Bingxu Liu et al. Science. .

Abstract

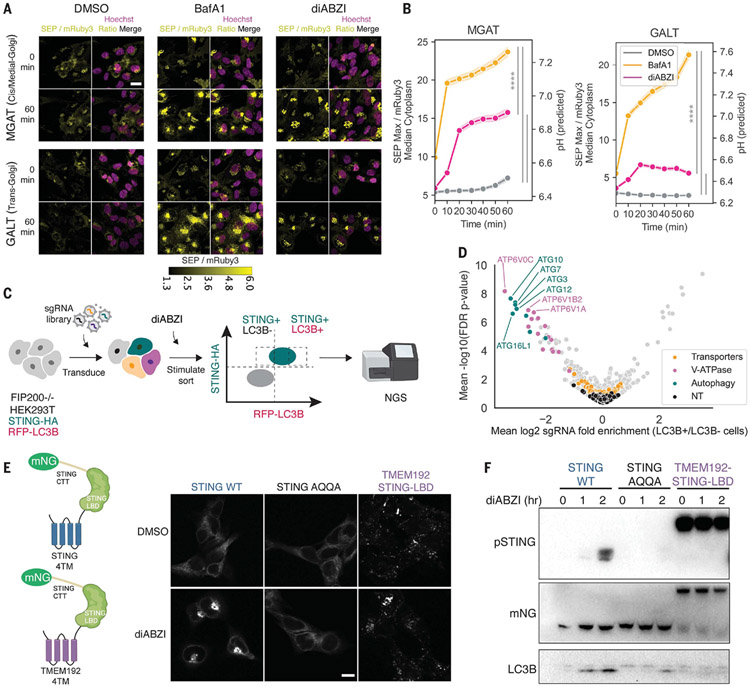
Proton leakage from organelles is a common signal for noncanonical light chain 3B (LC3B) lipidation and inflammasome activation, processes induced upon stimulator of interferon genes (STING) activation. On the basis of structural analysis, we hypothesized that human STING is a proton channel. Indeed, we found that STING activation induced a pH increase in the Golgi and that STING reconstituted in liposomes enabled transmembrane proton transport. Compound 53 (C53), a STING agonist that binds the putative channel interface, blocked STING-induced proton flux in the Golgi and in liposomes. STING-induced LC3B lipidation and inflammasome activation were also inhibited by C53, suggesting that STING's channel activity is critical for these two processes. Thus, STING's interferon-induction function can be decoupled from its roles in LC3B lipidation and inflammasome activation.


Figures

Fig. 1.
Fig. 1.. STING activation leads to a pH increase in the Golgi, and a genome-wide screen for regulators of STING-induced LC3B lipidation did not identify transporters that could mediate this effect.
(A) Representative images of BJ1 cells expressing a ratiometric SEP and mRuby3 reporter localized to MGAT or GALT at 0 and 60 min after 1 μM diABZI or 1 μM BafA1 stimulation. Scale bar, 20 μm. (B) Quantification of experiment in (A); data were combined from three independent biological replicates. The pH was predicted with the linear regression model in fig. S1B. The shaded region denotes SD. One-way analysis of variance (ANOVA) followed by Tukey’s post hoc test at 60-min time point: ****P < 0.0001. (C) Workflow for the genome-wide CRISPR screen. (D) Volcano plot of genome-wide CRISPR screen results across two replicates; V-ATPase, noncanonical autophagy components, and known ion transporters (GO:0015075, ion transmembrane transporter activity) are highlighted. NT indicates nontargeting control single-guide RNAs. FDR, false discovery rate. (E) STING-mNeonGreen (mNG) constructs and representative images of STING mNG localization in 293T cells expressing WT STING, STING AQQA, or TMEM192-STING-LBD and stimulated with dimethyl sulfoxide (DMSO) or 1 μM diABZI for 1 hour. Scale bar, 10 μm. One representative experiment of n = 2 experiments. (F) Immunoblotting of phosphorylated STING (pSTING) and LC3B lipidation in 293T cells expressing WT STING, STING AQQA, or TMEM192-STING-LBD stimulated as in (E). One representative experiment of n = 3 experiments.
Fig. 2.
Fig. 2.. A pore-binding small molecule inhibits pH increase in cells stimulated with STING agonist, and STING transports protons in an in vitro liposome assay.
(A) Predicted pore for chicken cGAMP–bound STING but not the apo conformation; key parameters were calculated with MOLEonline. (B) Quantification of pH increase in BJ1 cells from 0 to 60 min after 1 μM diABZI or 1 μM BafA1 stimulation with or without 10 μM C53; data from three biological replicates were combined. The shaded region denotes SD. One-way ANOVA followed by Tukey’s post hoc at the end point measurements: ***P < 0.001; ****P < 0.0001; n.s., not significant, P > 0.05. (C) Representative images of BJ1 cells in (B) and fig. S2b. Scale bar, 20 μm. (D) Quantification of super-resolution Airyscan images of BJ1 MGAT SEP mRuby3 STING knockout cells overexpressing STING WT miRFP680 stimulated with 1 μM diABZI, representing four biological replicates and five individual cells. STING intensity was normalized to the per-cell baseline median intensity. Shaded region denotes SD. Two-tailed Student’s t test at the end point measurements: ****P < 0.0001. (E) Representative super-resolution Airsycan images of BJ1 cell from (D) at 0 min and 30 min after 1 μM diABZI stimulation. Scale bar, 10 μm; inset scale bar, 1 μm. (F) Schematic of the ACMA-based fluorescence flux assay. (G) ACMA-based fluorescence influx assay performed using preformed liposomes loaded with STING protein (protein:lipid at a 1:200 mass ratio) or matched detergent micelle containing buffer (Control). Loaded liposomes were treated with DMSO, 100 μM C53, or 1 μM diABZI. One representative experiment of n = 4 experiments carried out with two distinct batches of purified STING protein. Error bars indicate SD. Two-way ANOVA followed by Tukey’s post hoc at the end point measurements: ****P < 0.0001; n.s., P > 0.05. For multiple comparisons, only “STING + diABZI” versus “STING + DMSO” and “Control + DMSO” versus “Control + C53” have n.s. P value; comparisons between other groups all have P < 0.0001.
Fig. 3.
Fig. 3.. STING-induced LC3B lipidation is inhibited by C53, and STING S53L is less sensitive to C53-mediated inhibition of pH increase and LC3B lipidation.
(A) Representative images of stably expressed RFP-LC3B and STING-HA in FIP200 KO 293T cells upon 1 μM diABZI stimulation for 1 hour with or without 10 μM C53 cotreatment. Scale bar, 20 μm. DAPI, 4′,6-diamidino-2-phenylindole. (B) Quantification of experiment in (A), representing three biological replicates combined. Error bars indicate SD. One-way ANOVA followed by Tukey’s HSD: ***P < 0.001; ****P < 0.0001; n.s., P > 0.05. (C) Immunoblots for indicated proteins in BJ1 cells with or without cotreatment with 10 μM C53 upon 20 μg/ml cGAMP (permeabilized with 5 μg/ml digitonin), 40 μM MSA-2, or 2 μM nigericin stimulation. One representative experiment of n = 3 experiments. (D) Quantification of pH change from 0 to 60 min after 1 μM diABZI stimulation with or without 10 μM C53; data from three biological replicates were combined. STING was knocked out in BJ1 cells followed by overexpression of STING WT (left) or STING S53L (right). Shaded region denotes SD. One-way ANOVA followed by Tukey’s post hoc at the end point measurements: **P < 0.01; ****P < 0.0001; n.s., P > 0.05. (E) Representative images of BJ1 cells assayed in (D). Scale bar, 20 μm. (F). Immunoblots of indicated proteins in 293T cells expressing STING WT or STING S53L treated with 1 μM diABZI with or without 10 μM C53 for 1 hour. One representative experiment of n = 3 experiments.
Fig. 4.
Fig. 4.. STING-induced NLRP3 inflammasome activation and IL-1β release are inhibited by C53.
(A) Representative images of pSTING, STING, and NLRP3 in HEK293T cells expressing STING-HA and NLRP3-mNeongreen (NLRP3-mNg) treated with DMSO and 1 μM diABZI with or without 10 μM C53 for 1 hour. Scale bar, 20 μm. (B) NLRP3 translocation quantified as the per-cell maximum NLRP3 intensity from experiment in (A) from three biological replicates combined. One-way ANOVA followed by Tukey’s post hoc: ****P < 0.0001; n.s., P > 0.05. (C) Same as (B) but quantifying pSTING intensity. (D) Experimental workflow for inflammasome induction in primary human monocytes. (E) Immunoblots of processed IL-1β from human monocytes (primed with R848) upon no stimulus (NS), 10 μg/ml cGAMP, 1 μM diABZI, or 6.7 μM nigericin stimulation in the absence or presence of 10 μM C53 or 5 μM NLRP3 inhibitor MCC950 (MCC). One representative donor of n = 3 donors tested. (F) Supernatant cytokine measurement from stimulated human monocytes [(left) Pam3CSK4 primed, (right) R848 primed] of processed IL-1β upon NS, 10 μg/ml cGAMP, 1 μM diABZI, or 6.7 μM nigericin stimulation in the absence or presence of 10 μM C53 or the 5 μM NLRP3 inhibitor MCC950; each data point represents one donor with total n = 4 donors. Error bars indicate SD. Two-way ANOVA followed by Dunnett’s multiple comparisons test: n.s., P > 0.05; *P < 0.05; ***P < 0.001; ****P < 0.0001.

Comment in

References

    1. Burdette DL et al., Nature 478, 515–518 (2011). - PMC - PubMed
    1. Sun L, Wu J, Du F, Chen X, Chen ZJ, Science 339, 786–791 (2013). - PMC - PubMed
    1. Wu J et al., Science 339, 826–830 (2013). - PMC - PubMed
    1. Ishikawa H, Barber GN, Nature 455, 674–678 (2008). - PMC - PubMed
    1. Gui X et al., Nature 567, 262–266 (2019). - PMC - PubMed