. 2023 Aug 4;381(6657):515-524.
doi: 10.1126/science.ade2292. Epub 2023 Aug 3.

CXCL9:SPP1 macrophage polarity identifies a network of cellular programs that control human cancers

Affiliations

CXCL9:SPP1 macrophage polarity identifies a network of cellular programs that control human cancers

Ruben Bill et al. Science. .

Abstract

Tumor microenvironments (TMEs) influence cancer progression but are complex and often differ between patients. Considering that microenvironment variations may reveal rules governing intratumoral cellular programs and disease outcome, we focused on tumor-to-tumor variation to examine 52 head and neck squamous cell carcinomas. We found that macrophage polarity-defined by CXCL9 and SPP1 (CS) expression but not by conventional M1 and M2 markers-had a noticeably strong prognostic association. CS macrophage polarity also identified a highly coordinated network of either pro- or antitumor variables, which involved each tumor-associated cell type and was spatially organized. We extended these findings to other cancer indications. Overall, these results suggest that, despite their complexity, TMEs coordinate coherent responses that control human cancers and for which CS macrophage polarity is a relevant yet simple variable.


Conflict of interest statement

M.J.P. has served as consultant for AstraZeneca, Elstar Therapeutics, ImmuneOncia, KSQ Therapeutics, Merck, Siamab Therapeutics, Third Rock Ventures., Tidal. A.M.K. is a founder and shareholder in 1CellBio, Inc. R.W. is cofounder of T2 Biosystems, Lumicell, Aikili, Accure Health, and advises Moderna, Alivio Therapeutics and Tarveda Therapeutics; he reports personal fees from ModeRNA, Tarveda Pharmaceuticals, Lumicell, Alivio Therapeutics, and Accure Health. R.W. is an adviser to ModeRNA, Lumicell and Accure Health. S.I.P. has served as consultant for Abbvie, Astrazeneca/MedImmune, Cue Biopharma, Fusion Pharmaceuticals, MSD/Merck, Newlink Genetics, Oncolys Biopharma, Replimmune, Scopus Biopharma, Sensei Bio, and Umoja Biopharma. She has received grants/ research support from Abbvie, Astrazeneca/MedImmune, Cue Biopharma, Merck, Sensei, and Tesaro. The wife of R.B. is an employee and shareholder of CSL Behring and R.B. received speakers fee from Janssen and is a mentee of the ENDEAVOUR-Breast program of Daiichi Sankyo. P.W. has served as consultant for Merck-Serono, Novartis, Sanofi, Bayer and Genentech. W.R. is currently a Senior Computational Biologist at Pfizer Inc. N.H. advises and holds equity in Related Sciences/Danger Bio, advises Repertoire Immune Medicines, holds equity in BioNTech and receives funding from Bristol Myers Squibb. G.G. receives research funds from IBM, Pharmacyclics, Ultima Genomics and is an inventor on patent applications related to MSMuTect, MSMutSig, MSIDetect, POLYSOLVER, SignatureAnalyzer-GPU and MinimuMM-seq. G.G. is a founder, consultant and holds privately held equity in Scorpion Therapeutics. G.G. received travel support from Caris Life Sciences. R.B., P.W., R.W., S.I.P and M.J.P. are listed as authors on a patent (provisional application number 63/503,528) submitted by Massachusetts General Hospital that covers a predictive signature of tumor prognosis and treatment efficacy.

Figures

Fig. 1.
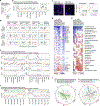
Fig. 1.. CXCL9:SPP1 polarity of tumor-associated macrophages is a major contributor to the clinical outcome of HNSCCs.
(A) Uniform manifold approximation and projection (UMAP) visualization of single-cell transcriptomic profiles combined from all 52 samples from the MGH/MEE-HNSCC cohort, highlighting separation of main cell lineages and showing finer clustering within each. (B) Identification of genes that are dominantly expressed (with fold-change > 3 relative to the next most-expressing cell type; multiple-test testing p-value < 0.05 for patient-level comparison) in each major cell type, and based on scRNAseq data from the MGH/MEE-HNSCC cohort (left panel). Projection of these genes to bulk RNAseq data from public datasets (totalling n=886 HNSCC patients) shows their relative expression pattern together with associated cohort of origin, HPV status and molecular subtypes (middle panel). Pairwise correlations between the same genes (right panel). The patients were sorted according to hierarchical clustering based on the tumor-specific genes only. (C) Comparison of three prognostic signatures, each derived using tumor, stromal and immune genes only. Multivariable Cox regression was used to obtain the hazard ratios (with Wald 95% confidence intervals, shown as horizontal bars, and p-values), based on the cross-validated prognostic scores derived using the GLMNET Cox model and applied to pairwise differences of expression of the genes. (D) Similar analysis as in (C), but using genes dominant in each subdivision of the immune cell types. (E) Kaplan-Meier plot of cross-validated macrophage prognostic score from (D) at 50% cutoff, showing the genes with opposite effects selected by the model. (F) Scatter plot of CXCL9 and SPP1 expression in each of 16,292 macrophages, and a contingency table based on dichotomized expression (positive if UMI counts >3), with odds ratio and Fisher’s exact test p-value to indicate mutual exclusion (odds ratio < 1). (G) Histological analysis with combined RNA-ISH/IF, using RNA probes for CXCL9 and SPP1 and antibody marker for macrophages (CD68) on 10 samples from the MGH/MEE-HNSCC cohort. Representative histology images (left) and quantification of TAM positive or not for CXCL9 and/or SPP1 (right) are shown. (H) Cox regression analysis in bulk RNAseq cohorts (as in Fig 1B and 1E) comparing the prognostic impact of TAM abundance signature (derived from the pseudo-bulk profiles of the scRNAseq data using GLMNET classifiers) and the CXCL9:SPP1 (CS) ratio. Wald 95% confidence intervals and p-values were shown. (I) Scatter plots showing lack of correlations between the macrophage signature score (Fig 1D-E) and common M1/M2 markers, and substantial correlations between the whole signature with individual expression of CXCL9 and SPP1, as well as the CS ratio. Spearman’s rank correlation is used and when significant a fitted red line is shown. (J) Association between CS ratio and response to an anti-PD1 mAb-containing treatment regimen in 14 patients of the MGH/MEE-HNSCC cohort, with significant Fisher’s exact test.
Fig. 2.
Fig. 2.. CXCL9:SPP1 tumor-associated macrophage polarity determines the broader TME.
(A) Patient ranking according to the CS TAM ratio. (B) Cell counts of major cell types. Patients were ranked from lowest to highest CS TAM ratio. Significant correlation based on Spearman’s rank correlation with CS TAM is indicated with a red line. Each dot represents the value for one sample with the dot size being representative of the cell number contributing to that value. (C) Quantitative immunofluorescence on 23 samples showing correlation between CS TAM ratio and CD8+ T-cell abundance in both tumor nest and stroma. (D) Correlations between T, B and dendritic cell abundance (relative to TAM counts) and common M1/M2 markers, CXCL9, SPP1 and CS ratio. Spearman rank correlation is used, and when significant, a fitted red line is shown. (E) Cell-type- and patient-specific expression of example genes, plotted according to patient order defined by CS ratio. The left panels show genes that are positively correlated with CS ratio, and the right panels show negatively correlated genes. (F) Association between CS TAM polarity and the expression of CXCL9 (left), and SPP1 (right) in minor TAM states. (G) Heat-map summarizing the correlation analysis (similar to Fig 2E) when applied to 195 cytokines in all cell types and indicating those that are significant in at least one cell type (FDR < 0.05). (H) Heat-map of gene set enrichment analysis results, applied separately to each cell type and taking as the input the correlation with CS ratio of Fig 2F, showing significant MSigDB hallmark gene sets. (I) Circos plots showing well-known ligand-receptor pairs from curated databases (as compiled in the NicheNet software package) under the requirement that either the ligand or the receptor (or both) is correlated with CS ratio, in addition to both being expressed. Arrows are pointing from the ligand towards the receptors. Only selected example pairs are labeled and highlighted for CXCL9 network. Abbreviations: Tu: tumor, T: T-cells, B: B-cells, N: neutrophils, MC: mast cells, DC: dendritic cells, Mo/Mø: monocyte/macrophages, EC endothelial cells, F fibroblasts. **** p < 0.0001, *** p < 0.001, ** p <0.01, * < 0.05. P-values are adjusted for the number of cell types. ECs: endothelial cells, DCs: dendritic cells.
Fig. 3.
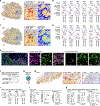
Fig. 3.. IFNγ and hypoxia respectively increase and decrease CXCL9:SPP1 tumor-associated macrophage polarity.
(A) “Pseudo-image” of summarized biomarker status per cell from a combined RNA-ISH and IF histology from a HNSCC tissue sample. Each one of the 650,340 cells is plotted as a dot located at the center of the original cell image, colored according to categorized biomarker combinations. Two magnified regions highlighting concentration of CXCL9+ or SPP1+ TAMs are shown to the right. (B) Quantitative analysis comparing the density of the CXCL9+ TAMs (top row) and SPP1+ TAMs (bottom) in the neighborhood surrounding every SPP1+ or CXCL9+ TAM cell (horizontal axis). The neighborhood is defined as four layers of cells according to Delaunay triangulation (with approximately ~40 µm distance to the outmost layer and a total of ~70 cells per neighborhood). The percentage of the cell type of interest is compared by t-test (summarized by the fold change and p-value). The box plots show Tukey’s lower and upper hinges, the quartiles and the median. Data from 6 samples were analyzed in the same manner. (C) Similar plot to Fig 3A, adding CK+ tumor cells that expresses CXCL9 or SPP1. (D) Similar analysis to Fig 3B, but comparing the percentage of CXCL9+ or SPP1+ tumor cells in the neighborhood surrounding CXCL9+ or SPP1+ TAMs. (E) Histology image from a HNSCC sample, with antibody markers for TAMs (CD68) and T-cells (CD3), as well as RNA-ISH probes for CXCL9 and IFNG. Areas with different CXCL9+ TAMs densities are magnified, showing enrichment of IFNG+ CD3+ cells around CXCL9+ TAMs. (F) Quantitative analysis of the histological images as in Fig 3E from 5 patients with CShi score, showing consistent enrichment of IFNG+ T-cells in areas with high CXCL9+ TAM density. (G) Percentage of CD3+ cells among IFNG+ cells. (H) RNA-ISH-IF analysis of IFNG and hypoxia marker GLUT1 in the context of SPP1+ and SPP1 TAMs. (I) Quantitative analysis comparing GLUT1 occurrence in the neighborhood of SPP1+ versus SPP1 TAMs, in samples from 3 patients (with the same method as that for Fig 3B and 3D). (J) Impact of IFNγ and hypoxia on the expression of CXCL9 and SPP1 by THP-1 macrophage-like cells. Cells were exposed to 40 ng/ml of IFNγ or 1 % O2 for 24 hours. Expression of CXCL9 and SPP1 was measured by RT-qPCR and the combined CS ratio was calculated. Shown are technical triplicates representative of one out of two independent experiments. (K) Impact of IFNγ or hypoxia on the expression of CXCL9 and SPP1 by TAMs obtained from two primary human HNSCC samples (HUG-01 and HUG-02). The cells were obtained by enzymatic digestion of fresh biopsies immediately exposed to 40 ng/ml of IFNγ or 1 % O2. TAMs were FACS-enriched after 72 hours for analysis of CXCL9 and SPP1 content by RT-qPCR.
Fig. 4.
Fig. 4.. CXCL9:SPP1 tumor-associated macrophage polarity identifies a coordinated network of cellular programs in a wide range of human cancers.
(A) Scatter plot of CXCL9 and SPP1 expression in single TAMs from three independent scRNAseq datasets, including HNSCC (UPit cohort), lung and colorectal cancer patients. The number of patients for each cohort is indicated above. The inserts show contingency tables based on dichotomized expression (positive if UMI counts >3), with odds ratio and Fisher’s exact test p-value to indicate mutual exclusion (odds ratio < 1). (B) CXCL9 and SPP1 expression in macrophages or monocytes, from tumor or adjacent normal tissue, in colorectal cancer. Healthy tissue is highlighted in green. (C) Comparison between cell-type specific gene expression correlations with CS ratio in the MGH/MEE-HNSCC cohort (fig S21 and Table S5) and the corresponding correlations in three independent scRNAseq datasets, quantified by the “correlation of correlations” (p-value by Spearman’s rank correlation test). (D) Rank correlation between CS TAM polarity and relative abundance of T, B and dendritic cells (Fig 2D), on the three independent scRNAseq datasets. P-values are indicated to the right of the forest plot and the 95% confidence intervals are shown as horizontal bars. The totals are summarized by random-effect meta-analysis. (E) Spatial transcriptomics analysis of CosMx lung cancer data, showing spatial separation of CXCL9+ versus SPP1+ TAMs density in the same tumor sample (left panel), quantified by the same analysis as in Fig 3B. Enrichment of SLC2A1+ cells around SPP1+ TAMs and INFG+ T-cells around CXCL9+ TAMs are also observed (middle and right panel, respectively). (F) Assessment of overall survival prognostic impact of bulk RNAseq CS ratio in HNSCC cohorts (as in Fig 1B-E), simultaneously with an EMT signature as competing explanatory variable in Cox regression analysis (HR: hazard ratios, Wald 95% confidence intervals are shown as horizontal bars). (G) As in (F), applied to TCGA pan-cancer collection. (H) As in (F), on HNSCC cohorts comparing CS ratio pairwise to single-gene expression of IFNG and CD8A, as well as the effector cells and Th1 signatures from Bagaev’s TME signature collection. (I) As in (H) applied to TCGA pan-cancer collection.

References

    1. Binnewies M et al., Nat Med 24, 541 (2018). - PMC - PubMed
    1. Bruni D, Angell HK, Galon J, Nat Rev Cancer 20, 662 (2020). - PubMed
    1. Galon J et al., Science 313, 1960 (2006). - PubMed
    1. Mahmoud SM et al., J Clin Oncol 29, 1949 (2011). - PubMed
    1. Nguyen N et al., Head Neck 38, 1074 (2016). - PMC - PubMed

MeSH terms