. 2023 Aug 4;381(6657):eade4995.
doi: 10.1126/science.ade4995. Epub 2023 Aug 4.

The genetic legacy of African Americans from Catoctin Furnace

Collaborators, Affiliations

The genetic legacy of African Americans from Catoctin Furnace

Éadaoin Harney et al. Science. .

Abstract

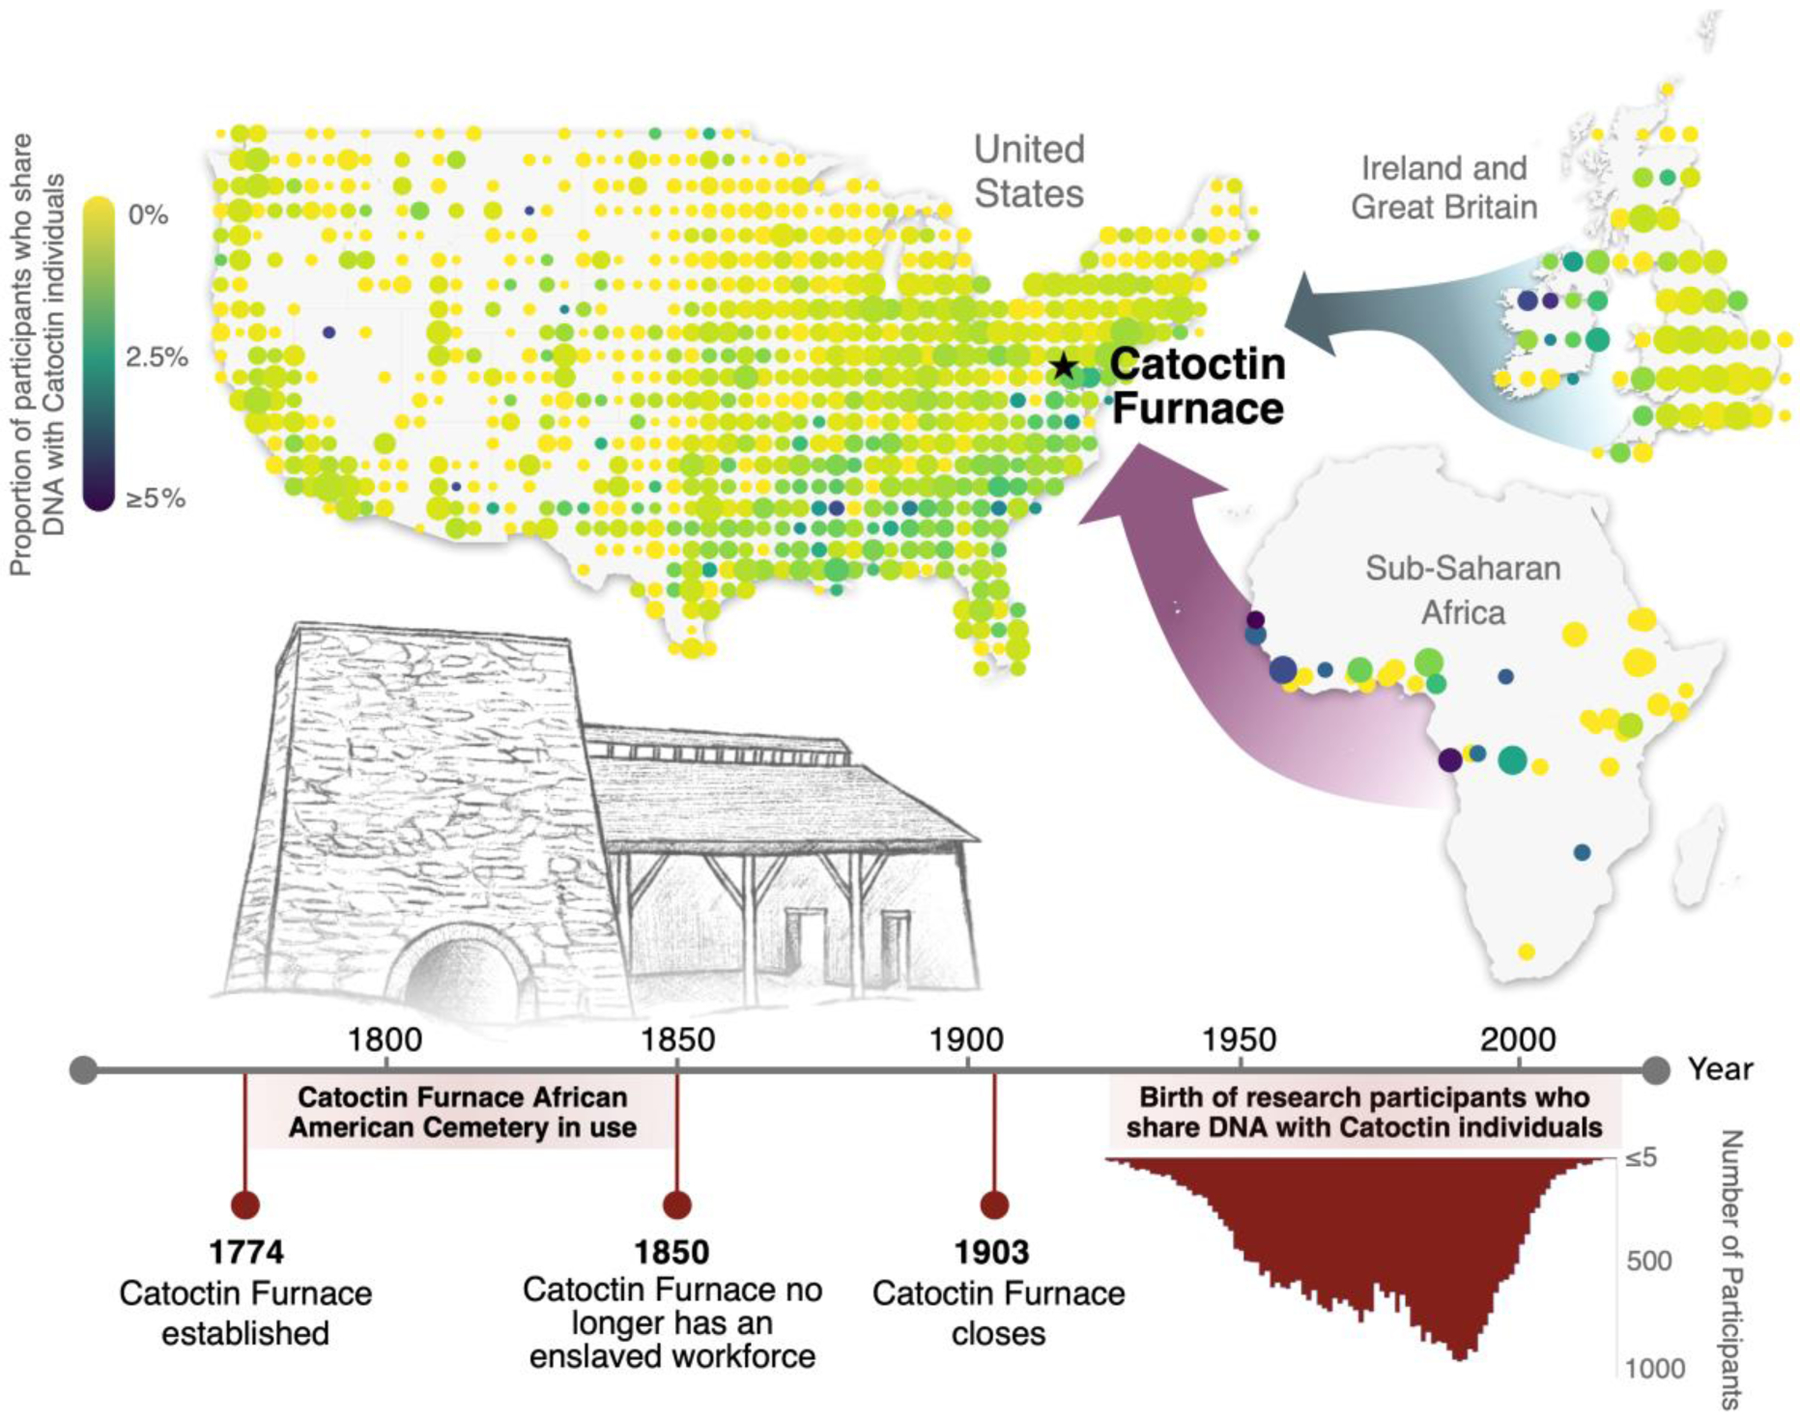
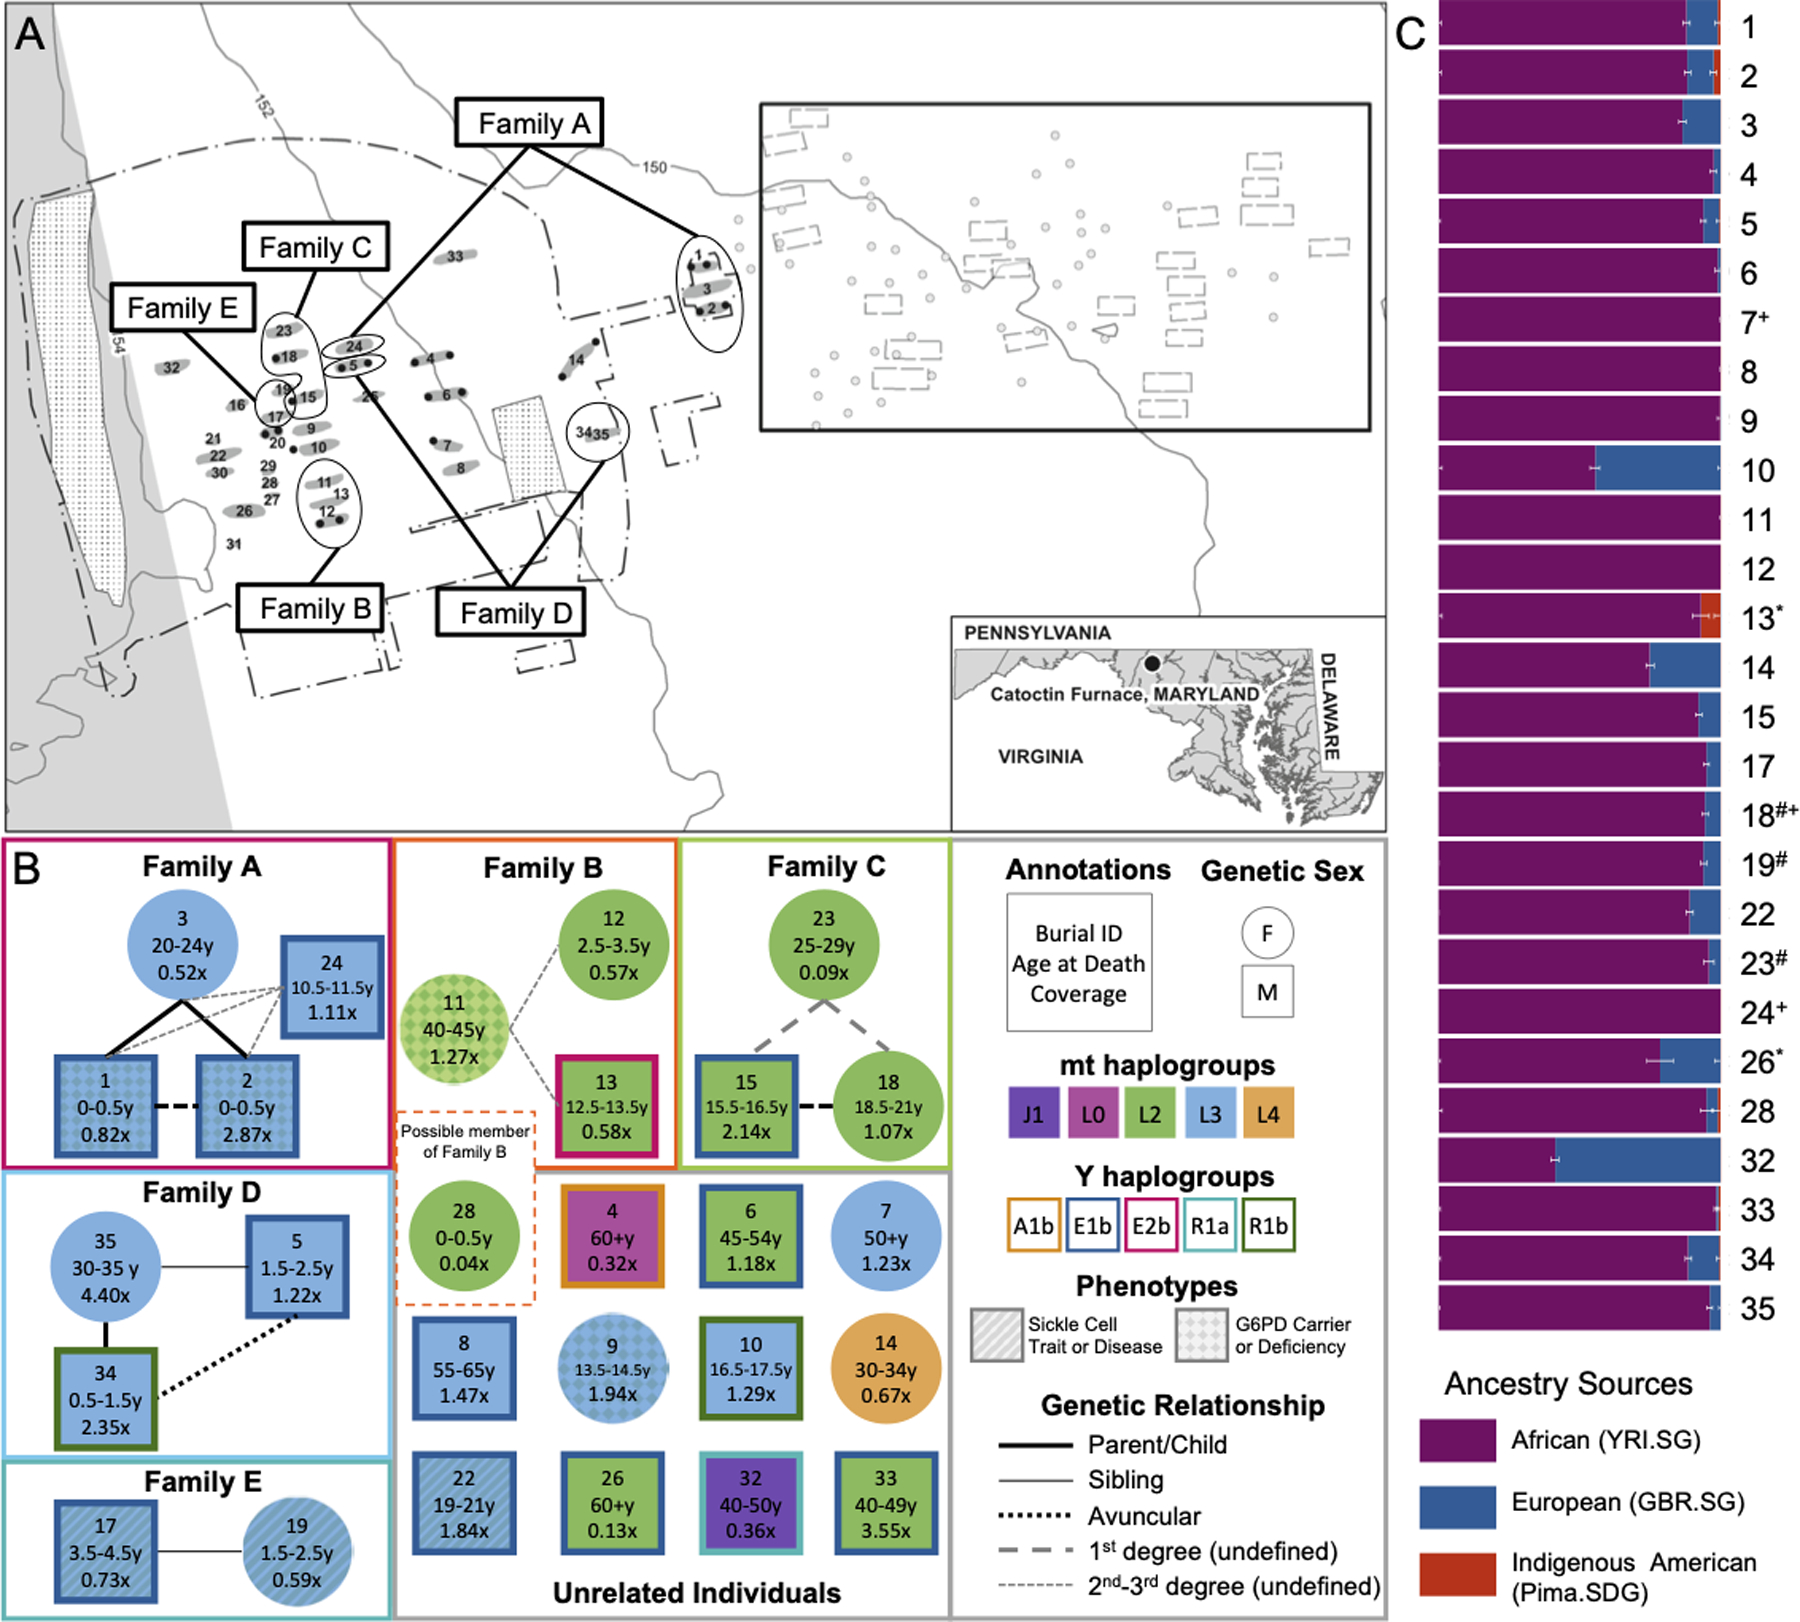
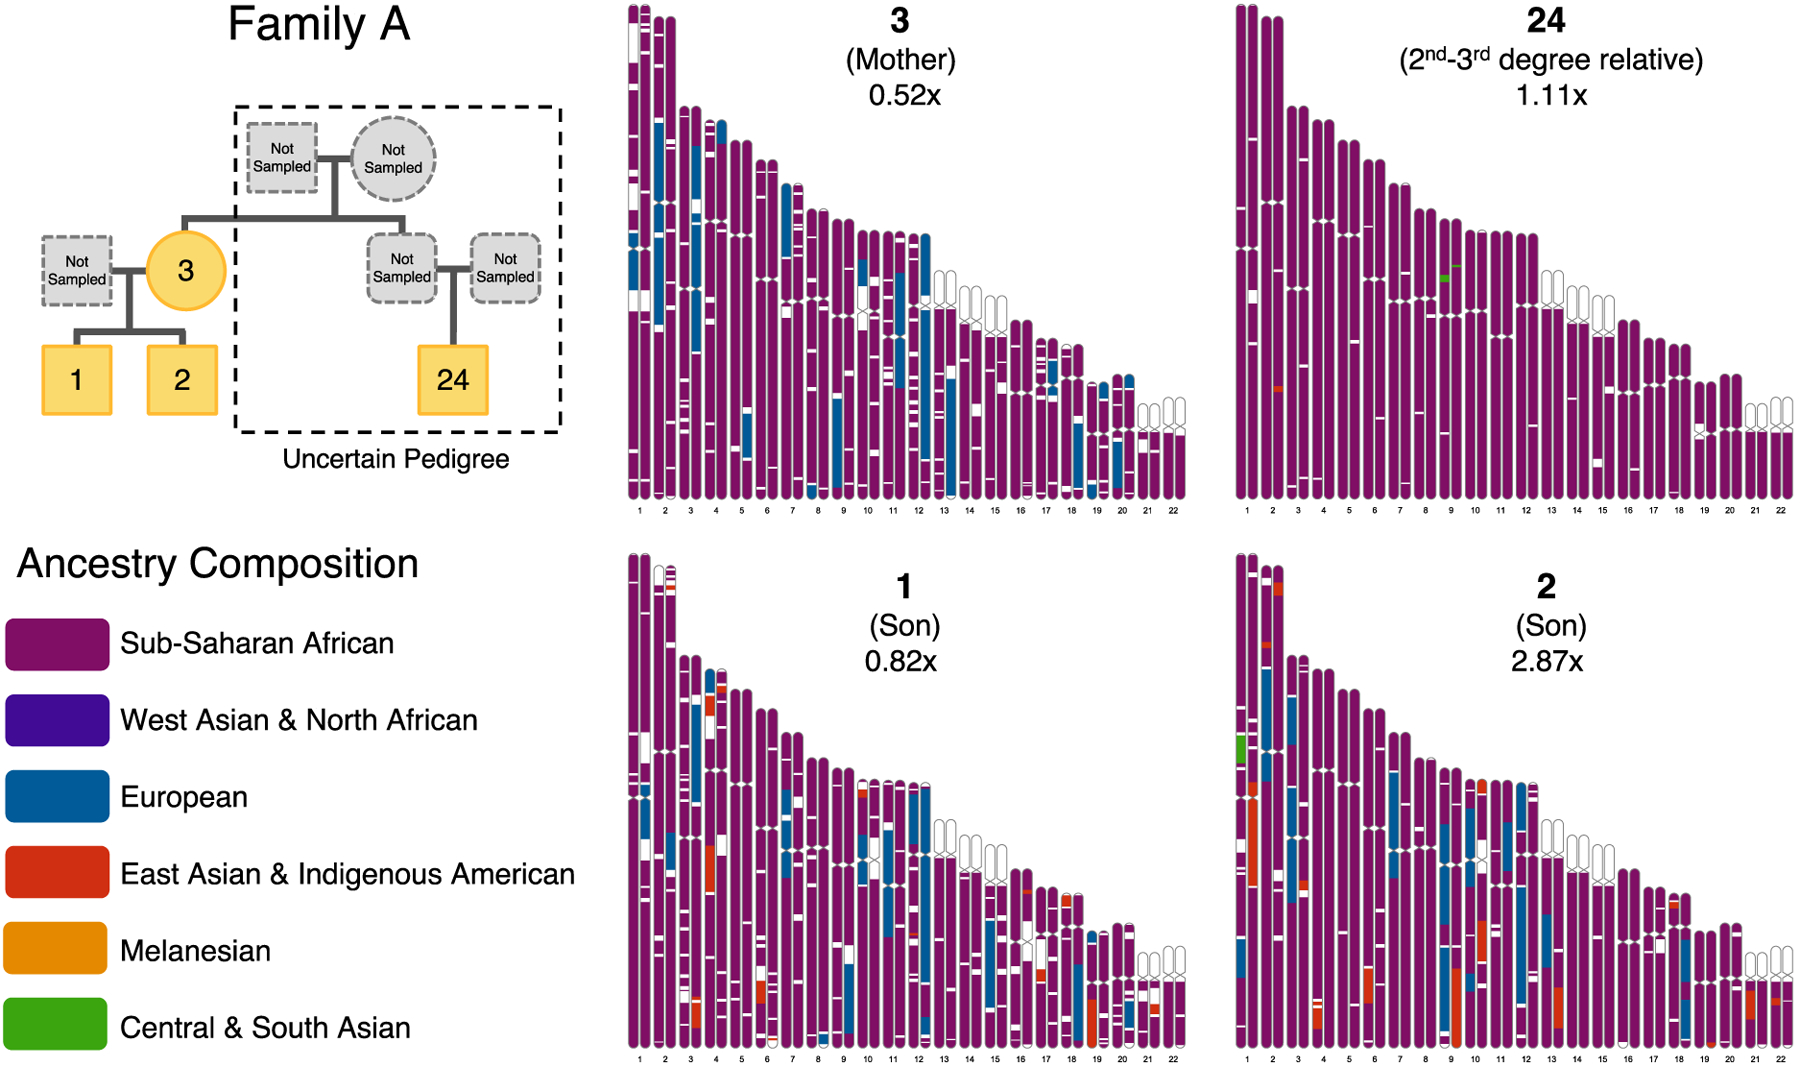
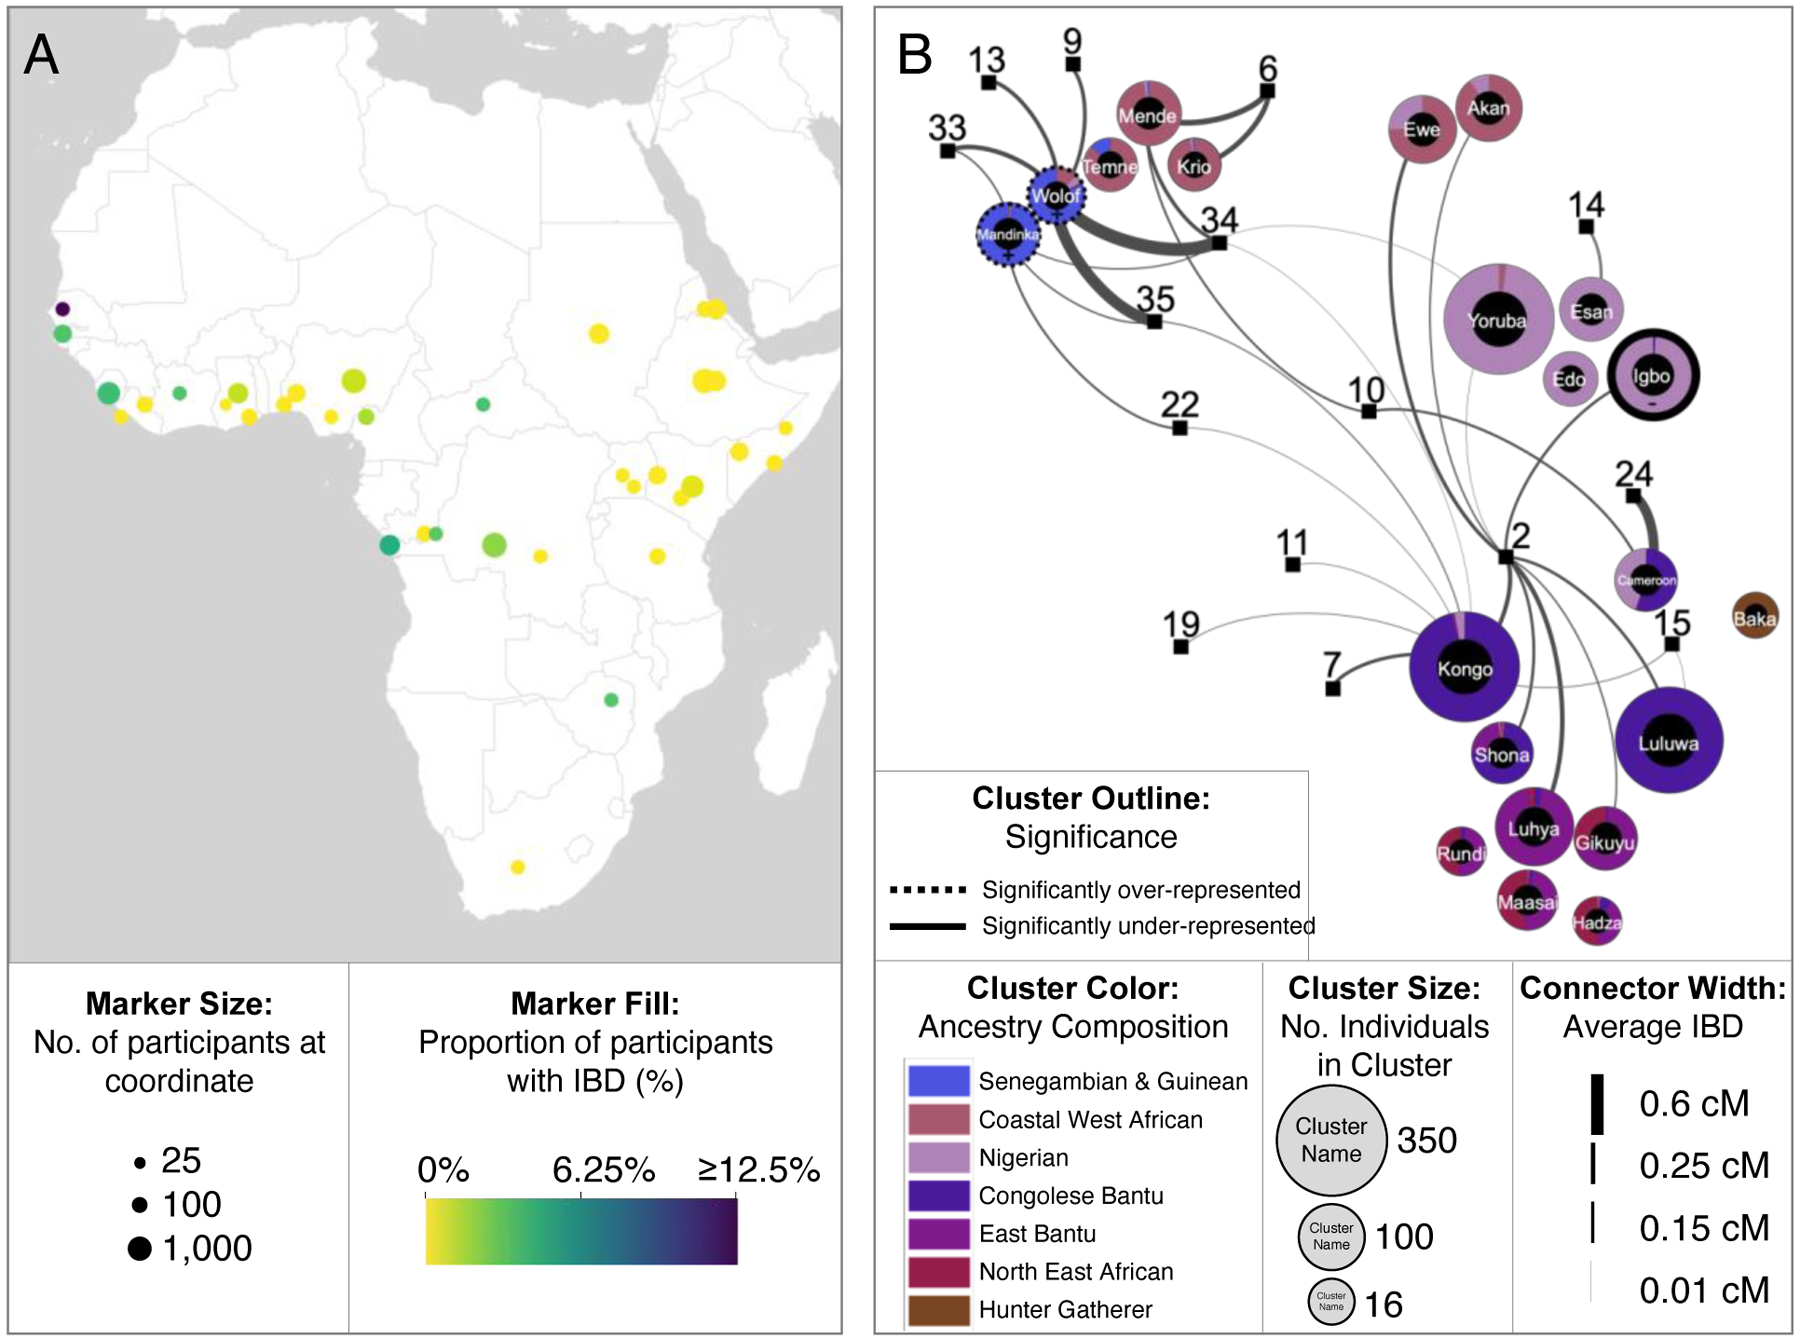
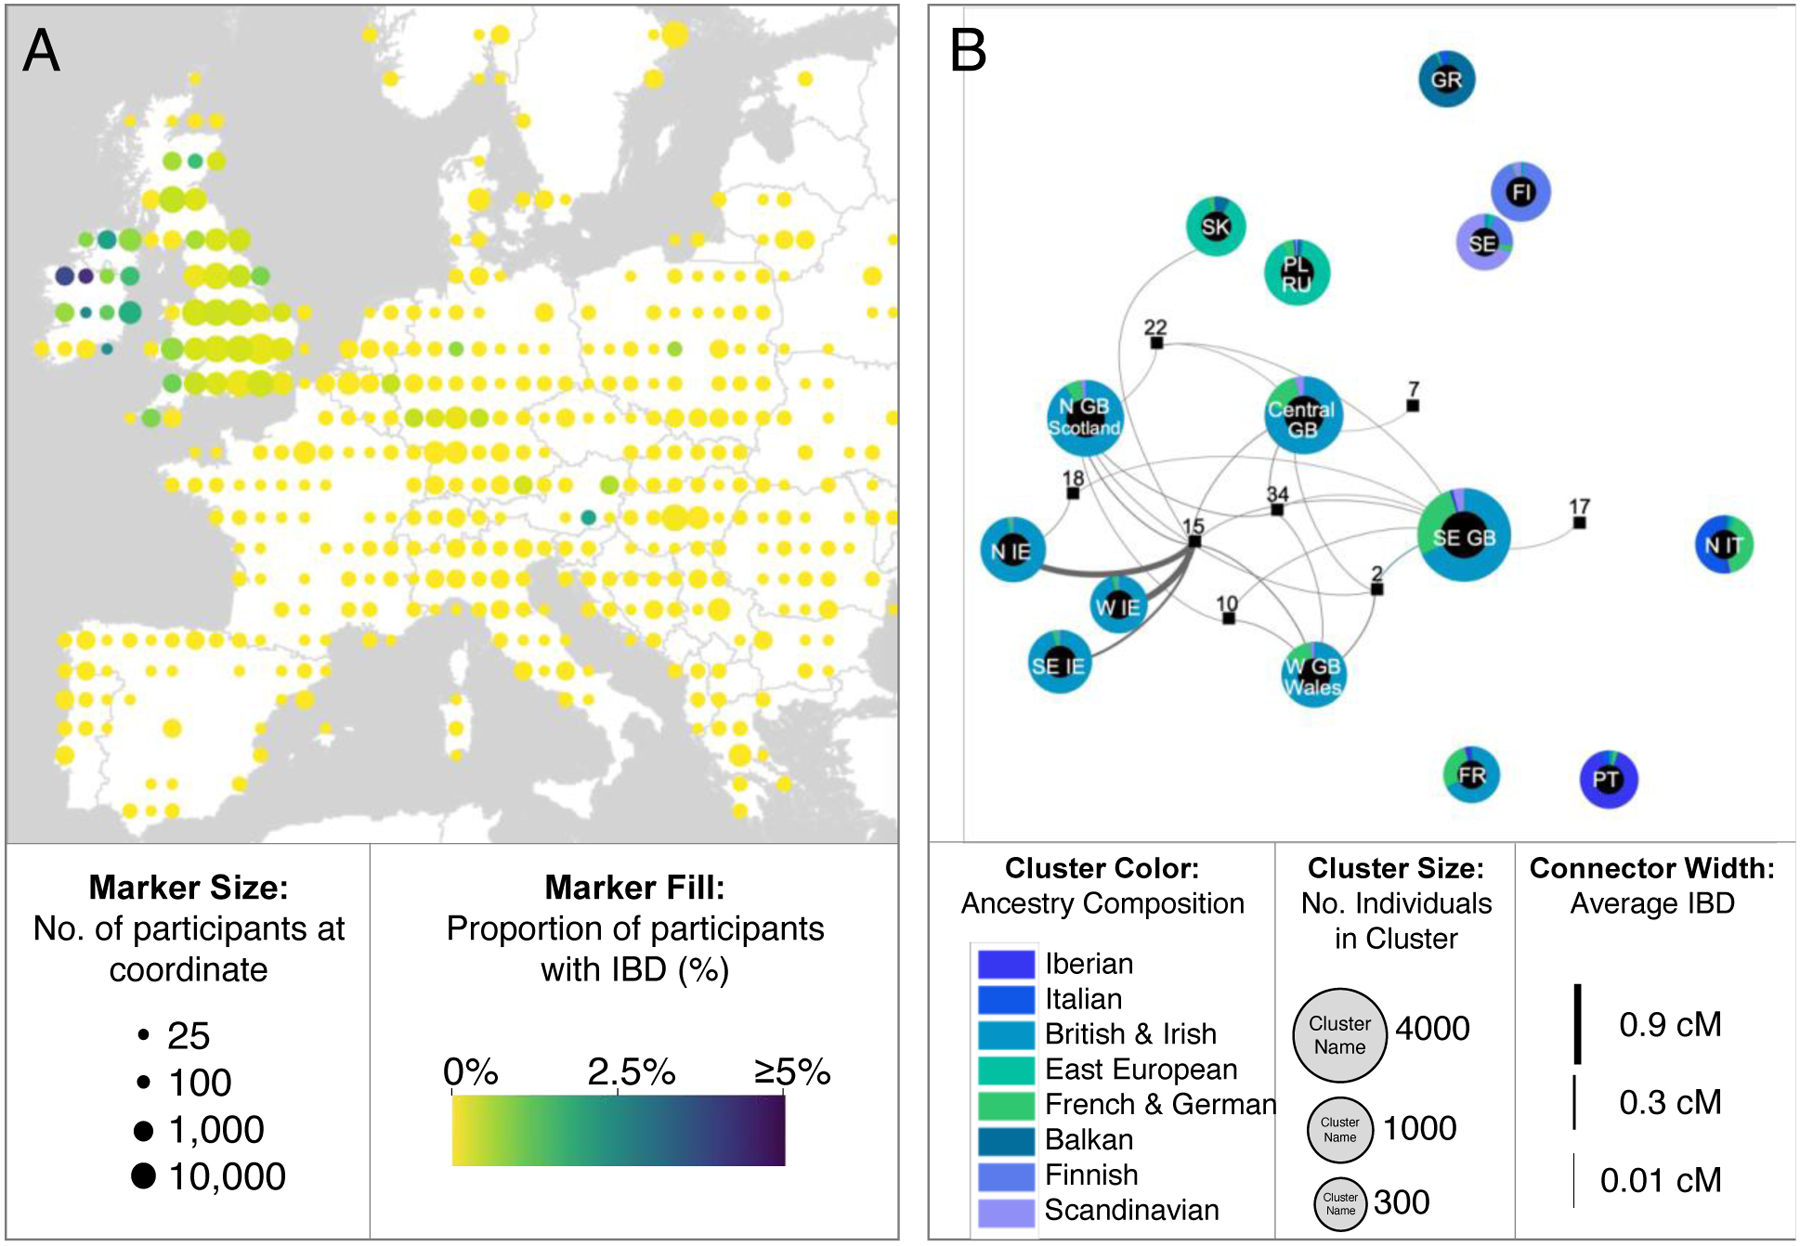
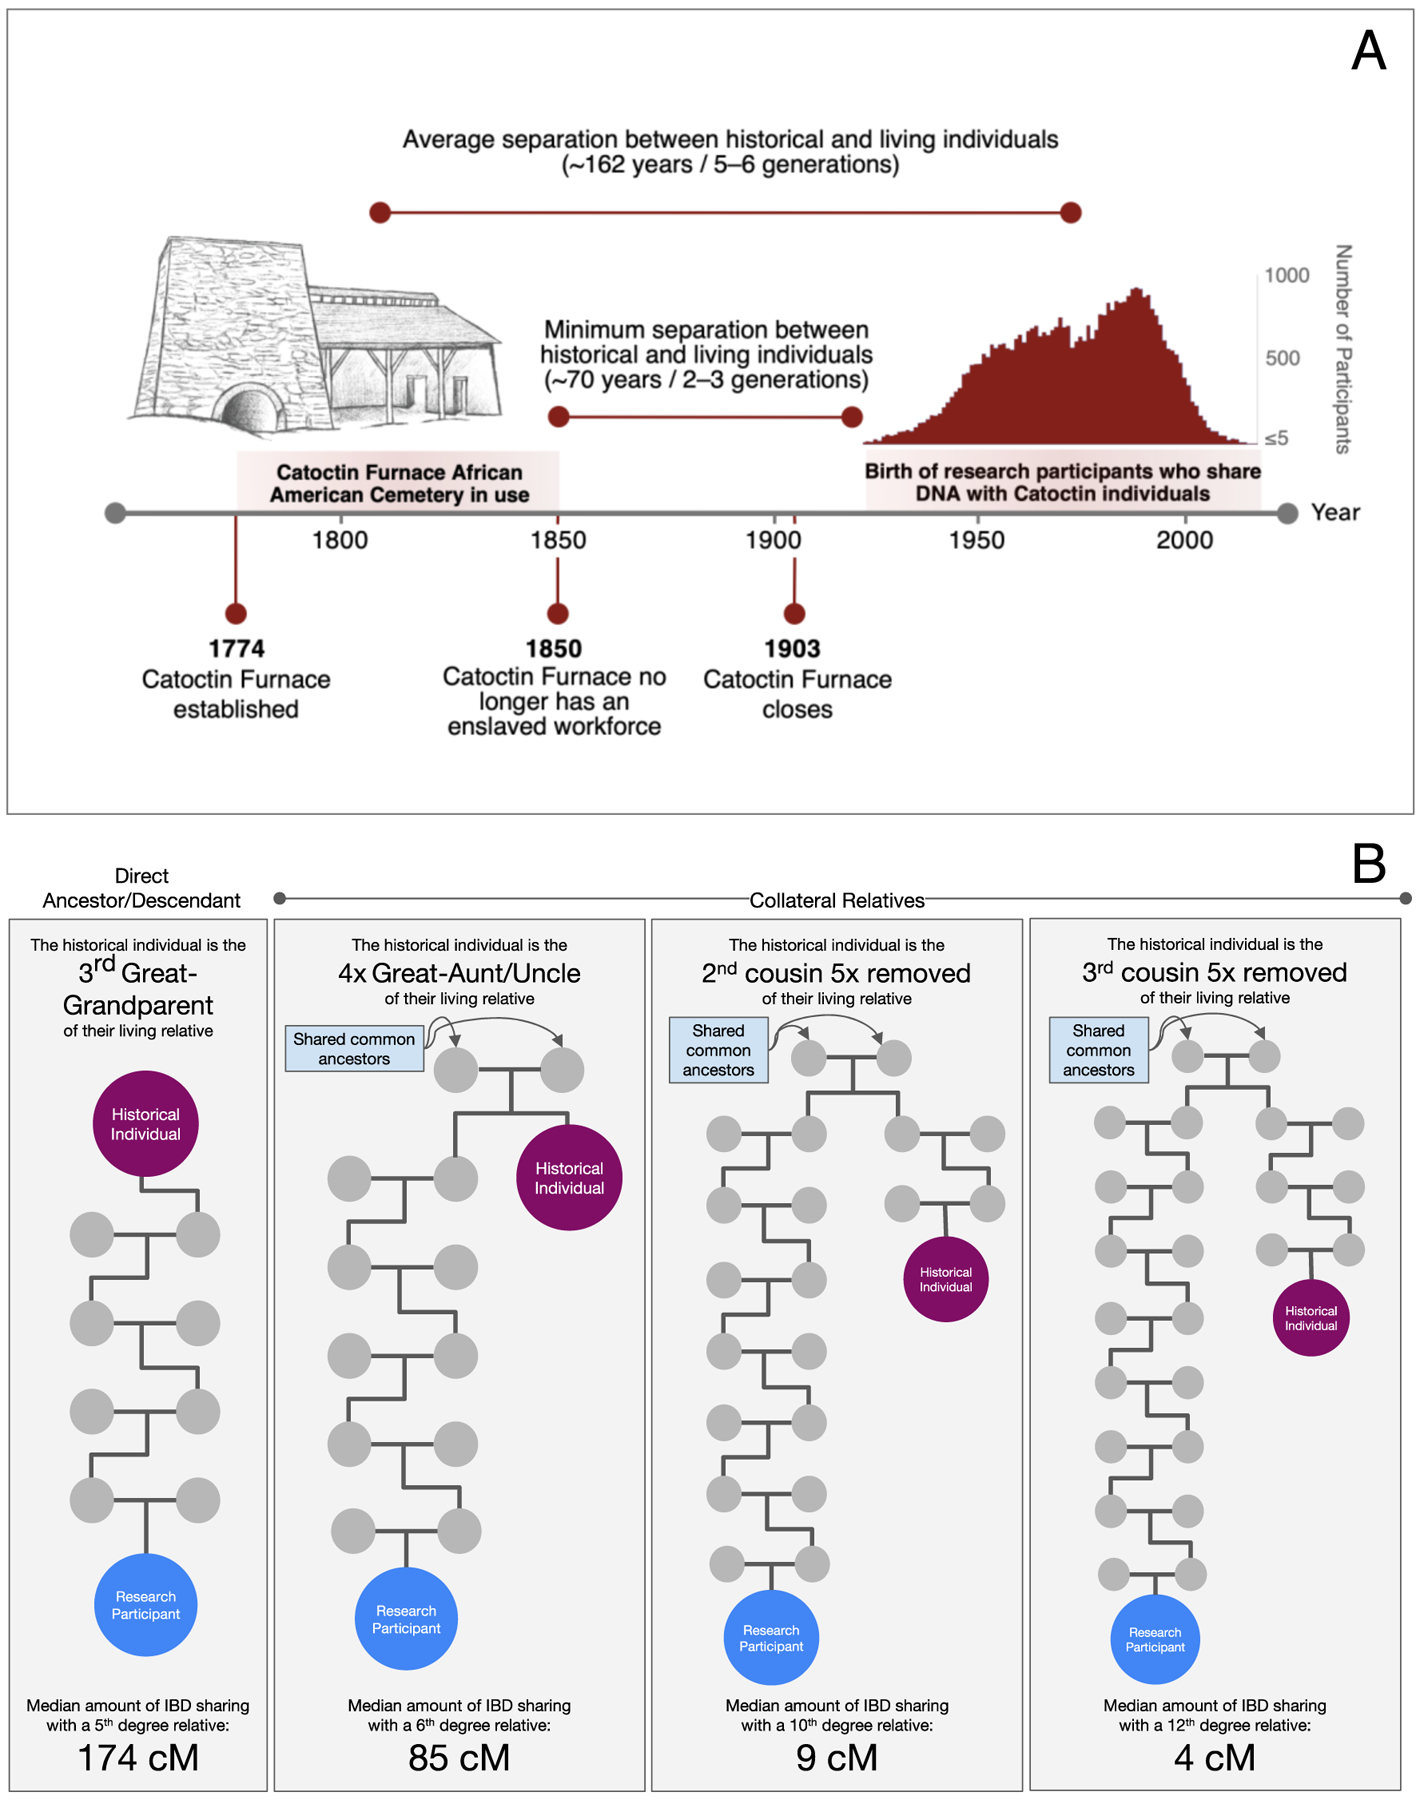
Few African Americans have been able to trace family lineages back to ancestors who died before the 1870 United States Census, the first in which all Black people were listed by name. We analyzed 27 individuals from Maryland's Catoctin Furnace African American Cemetery (1774-1850), identifying 41,799 genetic relatives among consenting research participants in 23andMe, Inc.'s genetic database. One of the highest concentrations of close relatives is in Maryland, suggesting that descendants of the Catoctin individuals remain in the area. We find that many of the Catoctin individuals derived African ancestry from the Wolof or Kongo groups and European ancestry from Great Britain and Ireland. This study demonstrates the power of joint analysis of historical DNA and large datasets generated through direct-to-consumer ancestry testing.


Conflict of interest statement

Competing Interests:

É.H., S.Mi., W.F., K.B., E.J., H.L.G., S.A.E, J.M. and members of the 23andMe Research Team are employees of and have stock, stock options, or both, in 23andMe. The remaining authors declare no competing interests.

Figures

Fig. 0.
Fig. 0.. Genetic connections to individuals from Catoctin Furnace African American Cemetery in Maryland.
A timeline highlighting major events in the history of Catoctin Furnace and the birth years of research participants in the 23andMe cohort, presented alongside maps showing the proportion of 23andMe research participants associated with geographic coordinates in the United States, Sub-Saharan Africa, and Europe who share genetic connections to the Catoctin individuals.
Fig. 1.
Fig. 1.. Burial context, genetic kinship, and ancestry of Catoctin individuals.
(A) Map showing the location of Catoctin Furnace and burials within the cemetery. Burial locations of the five genetic families are circled. The rectangle in the upper right shows a portion of the cemetery with unexcavated burials identified through ground penetrating radar (map adapted from (12), prepared by Robert Wanner). (B) Individuals, labeled according to burial ID, are grouped into families based on genetic relationships. Genetic sex, mt and Y haplogroups are indicated by marker shape, fill, and outline color, respectively. The type of genetic relationship is indicated by connector linestyle. Marker fill pattern indicates individuals with one or more copies of an allele associated with sickle cell anemia or glucose-6-phosphate-dehydrogenase (G6PD) deficiency. (C) Ancestry proportions assigned to each individual from representative African (YRI), European (GBR) and Indigenous American (Pima) populations drawn from the public dataset according to the qpAdm software. Error bars indicate one standard error. Asterisks (*) indicate cases where damage restricted data were analyzed. Hash symbols (#) and plus signs (+) indicate models with p-values <0.01 or ancestry proportion estimates that fall more than three standard errors outside the range of 0–1, respectively.
Fig. 2.
Fig. 2.. Ancestry composition chromosome paintings for members of Family
A. Chromosome paintings demonstrating the biogeographic ancestry assigned to portions of the autosomal chromosomes for four related Catoctin individuals assigned to Family A—a mother, two sons, and their 2nd–3rd-degree relative. A likely pedigree for Family A (top left) describes their relationship to one another, although we note that the true relationship of the individuals from Burials 1, 2, and 3 to the individual from Burial 24 is uncertain. Across the genome, ancestry is assigned to one of six ancestry components defined using 23andMe reference populations: Sub-Saharan African (purple), West Asian & North African (dark blue), European (dark teal), East Asian & Indigenous American (orange), Melanesian (yellow), and Central & South Asian (green). Unassigned regions are shown in white.
Fig. 3.
Fig. 3.. Genetic connections to the Catoctin individuals among members of the African cohort.
(A) The proportion of 23andMe participants in the African cohort who share IBD with Catoctin. Geographic coordinates are rounded to the nearest integer, and only coordinates that have at least 25 associated participants after 80% downsampling are shown. Marker size indicates the number of participants associated with each coordinate and color indicates the proportion of participants who share IBD with the Catoctin individuals. (B) IBD network demonstrating Catoctin individuals’ connections to members of the African cohort who share less than 700 cM of IBD with one another (N = 2,807). IBD clusters (represented by circles) are filled according to members’ average local African ancestry and arranged by average pairwise IBD sharing between clusters using a Force Atlas graph layout. Catoctin individuals, displayed as squares, are projected based on their average IBD shared with each cluster (shown as lines).
Fig. 4.
Fig. 4.. Genetic connections to the Catoctin individuals among members of the European cohort.
(A) Proportion of 23andMe participants in the European cohort who share IBD with Catoctin. Geographic coordinates are rounded to the nearest integer, and only coordinates that have at least 25 associated participants after 80% downsampling are shown. Marker size corresponds to the number of participants associated with each location, while the color indicates the proportion of participants who share IBD with the Catoctin individuals. (B) IBD network indicating Catoctin individuals’ connections to the 23andMe participants in the European cohort who share less than 700 cM with one another. Clusters are labeled by the geographic region with which the majority of cluster members are associated using ISO2 country abbreviations and when appropriate, prefixes to indicate the cardinal directions. Clusters are arranged by the average pairwise IBD sharing between clusters using a Force Atlas graph layout, with outlines that indicate participant’s average local European ancestry. Catoctin individuals, displayed as squares, are projected based on the average IBD shared with each European cluster (shown as lines).
Fig. 5.
Fig. 5.. Geographic distribution of distant and close relatives of the Catoctin individuals among members of the US cohort.
(A) Proportion of 23andMe research participants in the US cohort who share IBD with Catoctin. Only coordinates representing at least 25 participants after 80% downsampling are shown. Marker size corresponds to the number of participants associated with each coordinate, while color indicates the proportion of participants with shared IBD. Marker outlines indicate the number of participants at each coordinate who share ≥30 cM of IBD with one or more Catoctin individuals. The same information is shown for (B) participants with ≥5% Sub-Saharan African ancestry and (C) participants with ≥99% European ancestry. (D) IBD network of the closest present-day relatives of Catoctin individuals among 23andMe research participants. Circles represent modularity clusters consisting of close Catoctin relatives (sharing ≥30 cM of IBD) along with their relatives (sharing ≥100 cM with a close relative of a Catoctin individual). Clusters are outlined according to their average ancestry and arranged by the average pairwise IBD sharing between clusters using a Force Atlas layout. Catoctin individuals, displayed as squares, are projected based on the average IBD shared with each familial group (shown as lines).
Fig. 6.
Fig. 6.. Connections between Catoctin Family A and modern pedigrees.
The pedigree for Catoctin Family A is shown with blue-shaded individuals connected by gray lines. Open gray diamonds indicate un-genotyped individuals, some of whom must have existed (i.e., b, c, f, i, and j), whereas others (i.e., a, d, e, g, h, k) are inferred to have existed. The large purple triangle represents all present-day pedigrees composed of 23andMe research participants, and the probability distribution of how these pedigrees connect to the historical pedigree is inferred. Orange dots indicate all possible points of connection of present-day pedigrees to the historical pedigree. Numbers in ovals give the percentage of present-day pedigrees whose most likely connection was to a given point on the historical pedigree. Numbers in orange diamonds indicate the average degree of a lineage connecting to a particular point. Pie charts show the average European (blue), Sub-Saharan African (purple), and Indigenous American (yellow) ancestry (normalized to sum to one) of individuals in pedigrees whose most likely point of connection was through the respective lineage leading to the present day.
Fig. B1.
Fig. B1.
(A) A timeline showing the years in which the African American Cemetery at Catoctin Furnace was active and a histogram of birth years of research participants who share IBD with Catoctin (Table S23). (B) Examples of relationships that could be shared between individuals that were born five generations apart, with varying degrees of genetic separation. Median amount of IBD is reported for pairs of present-day and historical individuals (with 2x coverage) (Table S7).

Comment in

  • The chloramine dilemma.
    McCurry DL. McCurry DL. Science. 2024 Nov 22;386(6724):851-852. doi: 10.1126/science.adt8921. Epub 2024 Nov 21. Science. 2024. PMID: 39571038

References

    1. Eltis D, Richardson D, Atlas of the Transatlantic Slave Trade (Yale University Press, 2010).
    1. U.S. Census Bureau QuickFacts: United States, (available at https://www.census.gov/quickfacts/fact/table/US/RHI225219#RHI225219).
    1. Williams HA, Help me to find my people: The African American search for family lost in slavery (Univ of North Carolina Press, 2012).
    1. Anderson EY, Catoctin Furnace: Portrait of an Iron Making Village (Arcadia Publishing, 2013).
    1. Catoctin Furnace Historical Society, Compiled by donated labor for the Catoctin Furnace Historical Society. Primary manager, Elizabeth Anderson Comer., Access database of confirmed and potential members of the Catoctin Furnace community. (2015).