Review
. 2023 Aug 4;381(6657):eabq4964.
doi: 10.1126/science.abq4964. Epub 2023 Aug 4.

The dawn of spatial omics

Affiliations
Review

The dawn of spatial omics

Dario Bressan et al. Science. .

Abstract

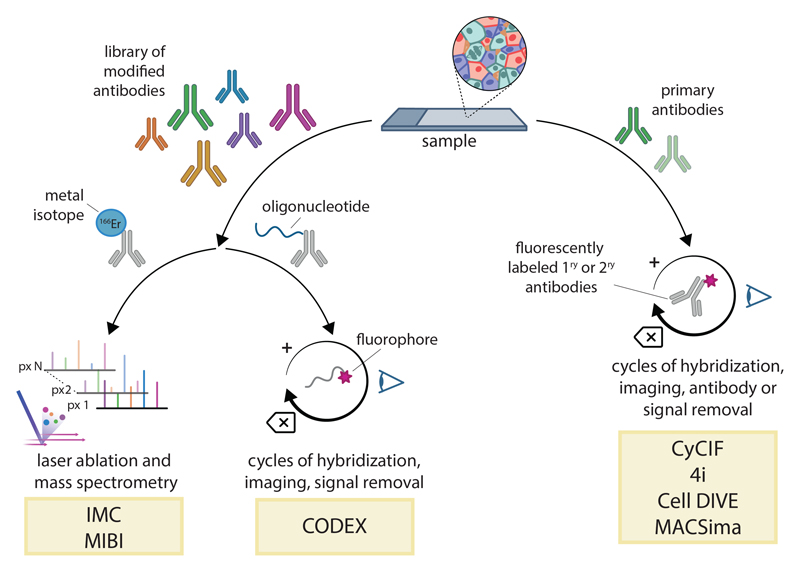
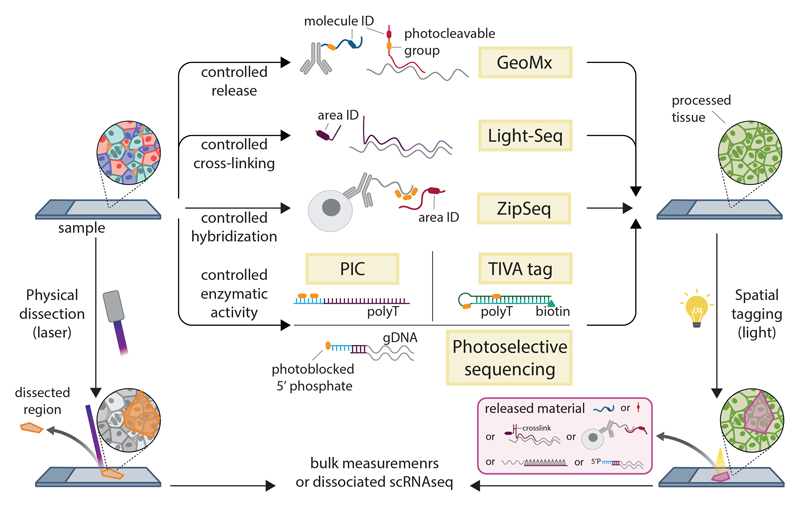
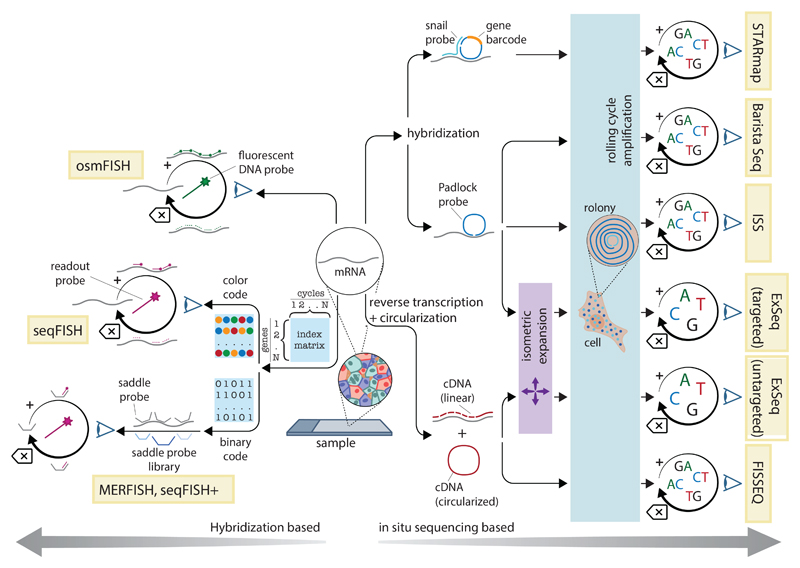
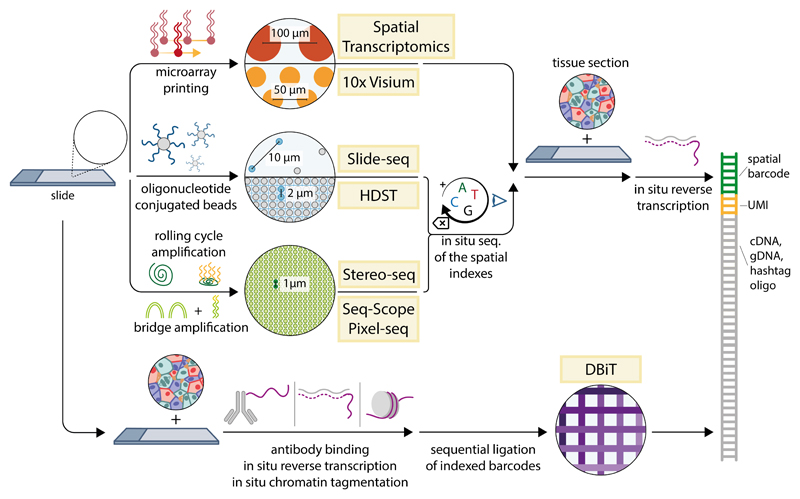
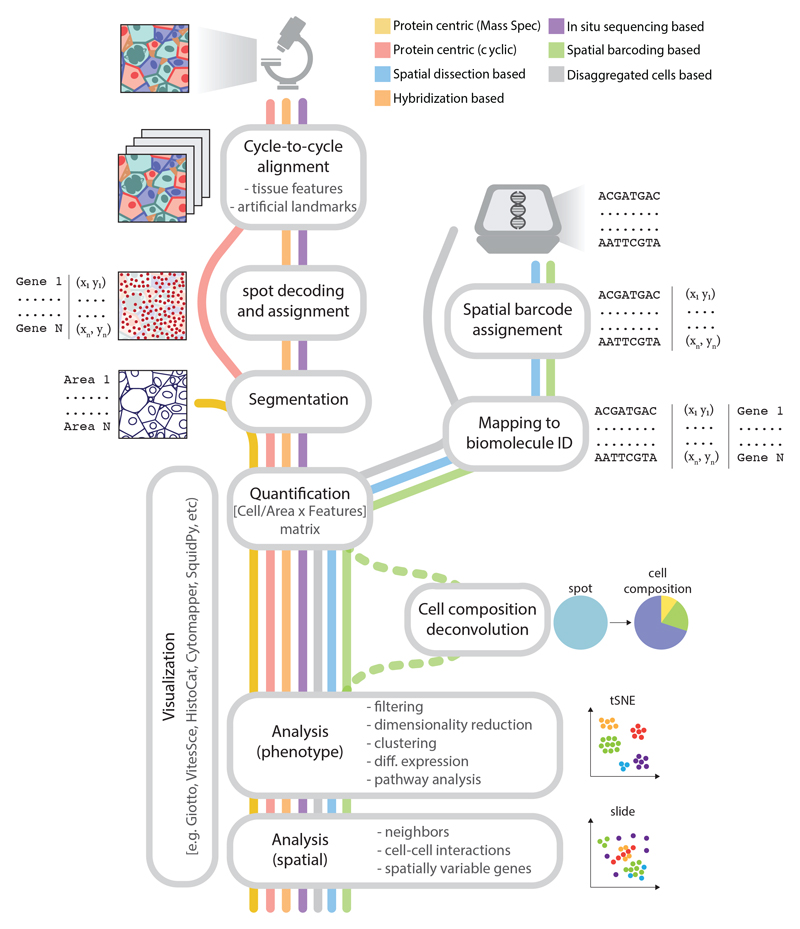
Spatial omics has been widely heralded as the new frontier in life sciences. This term encompasses a wide range of techniques that promise to transform many areas of biology and eventually revolutionize pathology by measuring physical tissue structure and molecular characteristics at the same time. Although the field came of age in the past 5 years, it still suffers from some growing pains: barriers to entry, robustness, unclear best practices for experimental design and analysis, and lack of standardization. In this Review, we present a systematic catalog of the different families of spatial omics technologies; highlight their principles, power, and limitations; and give some perspective and suggestions on the biggest challenges that lay ahead in this incredibly powerful-but still hard to navigate-landscape.


Conflict of interest statement

Competing interests

D.B. and G.J.H. are cofounders of Suil Interactive, a company focused on the development of virtual reality tools for the visualization of spatial profiling data, and of Elyx, a company developing and commercializing spatial profiling technologies. G.B. is a shareholder of Elyx. D.B., G.J.H., and G.B. are listed as inventors on patent applications relating to the spatial profiling field, including WO2021105723A1 and WO2021116715A1

Figures

None
Summary figure
Spatial omics methods profile the molecular make-up of tissues, preserving their spatial organization through four main steps. (A) Detection. Oligonucleotide probes or modified antibodies bind to specific nucleic acids, proteins, or small molecules. Alternatively, enzymatic processes can detect RNA (reverse transcription) or DNA (tagmentation) in an untargeted fashion. Single or multiple types of biomolecules can be profiled simultaneously. (B) Identification. Biomolecules can be identified directly with next-generation sequencing or mass spectrometry, or indirectly by means of an individual tag on the detection probe that is either read at once or sequentially (combinatorial barcode). (C) Measurement. Imaging-based methods measure the signal intensity of fluorescent probes or count the number of spots per area (single-molecule localization methods). Sequencing-based methods quantify the abundance of biomolecules through normalized read count or using unique molecular identifiers (UMIs). (D) Localization. Biomolecules are assigned to their spatial locations either directly in imaging-based methods, or by means of a DNA barcode decoded through sequencing. Technologies differ widely in terms of spatial resolution, sensitivity, and number and size of areas that can be profiled.
Figure 1
Figure 1. Spatial proteomics methods based on multiplexed antibody detection
Proteomics methods can be broadly divided into two types of protocols. In one (left), antibodies are all bound together and detected either with MS imaging (IMC or MIBI) or cyclic fluorescence imaging (CODEX). In the other (right), primary antibodies are themselves bound and stripped in each cycle (4i, CyCIF, or Cell DIVE MACSima). In IMC and MIBI, each antibody is bound to a different metal by a chelating polymer. During imaging, a laser vaporizes the tissue pixel by pixel, and the metals released from each spot are quantified with a mass spectrometer. The distribution of metals can then be used to deduce the presence and spatial distribution of specific protein antigens in the tissue. The two methods differ in how mass measurements are performed and in their resolution: 1 µm for IMC and 300 nm for MIBI. In fluorescence-based methods, each cycle detects as many markers as there are florescence channels available, with complexity scaling linearly with the number of cycles. Binding all probes together (CODEX) results in faster imaging and shorter cycles but requires custom modification of each antibody and extensive optimization. On the other hand, binding antibodies in cycles (4i, CyCIF, MACSima, and Cell DIVE) enables the use of “native” antibodies that can be obtained commercially but results in slower cycles (up to 1 day per round). Owing to the repeated rounds of microscopy, all cyclic imaging methods are slower than IMC and MIBI on a per-sample basis and present more challenges for cycle-to-cycle alignment of images (registration). However, the data-generating capacity is actually higher because the slow element is the staining process, which can be performed in parallel on many samples, whereas the imaging itself is much faster than that with MS.
Figure 2
Figure 2. Spatial dissection and selective illumination methods.
Several different methods can be used to restrict profiling to a specific section of a sample. Laser capture microdissection (LCM) relies on the physical isolation of a tissue fragment, from either flash-frozen or FFPE-treated material (24), followed by bulk measurements. By contrast, photo-sensitive groups can be used to tag an area of interest using light. TIVA-tag and PIC use photo-sensitive groups to trigger RT either in vivo or in fixed samples. Nanostring GeoMx uses the same cleavable group as that of TIVA to release a fluorescent combinatorial tag bound to detection probes (antibodies or hybridization probes), which is then quantified by using Nanostring’s nCounter technology. Light-Seq and ZipSeq use light tagging to assign an area ID by means of crosslinking or hybridization, respectively.
Figure 3
Figure 3. Imaging-based methods
Molecules are detected through hybridization and identified according to patterns of fluorescence signal, either driven by cooperative hybridization or incorporation of fluorescent nucleotides. In osmFISH, transcripts are individually detected in separate cycles of hybridization and signal release. MERFISH, seqFISH, and seqFISH+ use combinatorial labeling schemes to assign each transcript to a barcode, consisting of a subset of hybridization probes that are detected in cycles of imaging and release. Each digit is read in a separate cycle, with different colors (seqFISH+) or presence and absence of fluorescence (MERFISH) corresponding to different values. This allows the detection of up to Xn genes (where X is the potential values of each digit and n is the number of cycles). Whereas seqFISH probes are directly conjugated to fluorophores, MERFISH and seqFISH+ use “saddle probles” with a region complementary to a set of fluorescently labeled “readout” probes, then are hybridized and read cyclically. Each spot corresponds to a RNA molecule, and the sequence of fluorescence signals identifies it. In “targeted” ISS methods, multiple transcripts of interest are bound by a library of detection probes that circularize through split ligation. ISS, BaristaSeq, and ExSeq use padlock probes to either form an exact junction or leave a gap that is filled by polymerase before ligation. In STARmap, a pair of oligonucleotides [snail (specific amplification of nucleic acids via intramolecular ligation element) probes] need to bind in close proximity to enable circularization. In “untargeted” methods, RNA is retrotranscribed from a poly(T) oligonucleotide, and the cDNA is then circularized through intramolecular single-strand ligation. The circularized molecules are amplified by means of RCA, producing rolonies. In all cases, sequencing is performed on the rolonies by using either sequencing-by-ligation or sequencing-by-synthesis technologies. Targeted methods read a barcode within the probe itsef or in the gap-filled region (allowing detection of mutations). Untargeted methods sequence the cDNA itself, which can be purified and sequenced again in bulk (ExSeq)
Figure 4
Figure 4. Spatial barcoding methods
All methods are based on the production of a solid surface with a regular array of capture probes (DNA oligonucleotides), terminating with a poly(T) sequence that matches cellular mRNAs. In ST and 10X Visium, the capture probes are built directly by means of microarray printing, resulting in a resolution of 50 to 100 µm. In Slide-seq and HDST, the probes are synthesized on gel beads, which are then randomly attached to a slide or deposited on a microwell chip. The position of each bead is then detected by short rounds of ISS. In Seq-Scope and PIXEL-seq, the capture probes are produced by modifying sequencing clusters produced by bridge amplification on an Illumina flow cell or on a polyacrylamide-based hydrogel, whereas in Stereo-seq, they are produced by means of RCA on a silicon wafer. Spatial location is provided by ISS of the capture probes. In all cases, a tissue section is then placed on top of the arrayed capture probes and digested, letting the mRNAs in the tissue reach the poly(T) region, and cDNA is synthesized in situ. In DBiT-seq, barcodes are created directly on top of biomolecules (DNA fragments, cDNA, or oligo-conjugated antibodies) by placing a microfluidic chip with parallel thin channels on the section and performing ligation with a different oligonucleotide in each channel. The chip is then rotated by 90°, and ligation is repeated, producing an xy grid with resolution ranging from 10 to 50 µm. In all cases, the indexed biomolecules are then profiled in bulk by means of sequencing.
Figure 5
Figure 5. Analysis workflows for spatial profiling datasets
Analysis workflows vary depending on the core acquisition modality (imaging or next-generation sequencing). Imaging methods require preprocessing of the images taken at different cycles and across multiple fields of view through stitching, background correction, and realignment with high accuracy (image registration). Image registration relies on easily identifiable “fiducial marks” that can be either point signals produced by the protocol itself (ExSeq and STARmap), embedded fluorescent microbeads (MERFISH and seqFISH), or the pattern of cell nuclei after intercalator staining (multiplexed IHC). For single-molecule imaging methods, the signal spots need to be identified and their patterns decoded to assign them to a biomolecule identification (ID) (usually a transcript). Images are then segmented to define areas corresponding to each cell (masks) by either identifying the cell membranes or performing a geometric expansion around the nucleus as a proxy for the cytoplasm. The number of spots or signal intensity are then integrated over the cellmasks, generating an area-by-features matrix. By contrast, spatial barcoding methods produce datasets in the form of sequencing output, which are preprocessed and parsed to assign each read to (i) a coordinate in space, through the location barcodes, and (ii) a biomolecule’s ID by mapping to a reference (such as a transcriptome). This is comparable with the preprocessing pipelines for disaggregated single-cell sequencing, with the space barcodes effectively replacing the cell barcodes, and representing areas that range from tissue regions to subcellular compartments, depending on the profiling method. Thereafter, common analysis steps include filtering, normalization, identification of highly variable features, dimensional reduction, clustering, and identification of differentially expressed markers. The results can be visualized either directly or in a dimensionality-reduced space on the basis of the omics profile and are finally integrated with the spatial information to reveal spatial features.

References

    1. Macosko EZ, et al. Highly Parallel Genome-wide Expression Profiling of Individual Cells Using Nanoliter Droplets. Cell. 2015;161:1202. doi: 10.1016/j.cell.2015.05.002. - DOI - PMC - PubMed
    1. Pijuan-Sala B, et al. A single-cell molecular map of mouse gastrulation and early organogenesis. Nature. 2019;566:490. doi: 10.1038/s41586-019-0933-9. - DOI - PMC - PubMed
    1. Regev A, et al. The Human Cell Atlas. eLife. 6:e27041. doi: 10.7554/elife.27041. - DOI - PMC - PubMed
    1. Lohoff T, et al. Integration of spatial and single-cell transcriptomic data elucidates mouse organogenesis. Nature Biotechnology. 2022;40:74. doi: 10.1038/s41587-021-01006-2. - DOI - PMC - PubMed
    1. Moffitt JR, et al. Molecular, spatial, and functional single-cell profiling of the hypothalamic preoptic region. Science. 2018;362 doi: 10.1126/science.aau5324. - DOI - PMC - PubMed