. 2023 Aug 22;17(16):16174-16191.
doi: 10.1021/acsnano.3c05309. Epub 2023 Aug 3.

Observing Extracellular Vesicles Originating from Endothelial Cells in Vivo Demonstrates Improved Astrocyte Function Following Ischemic Stroke via Aggregation-Induced Emission Luminogens

Affiliations

Observing Extracellular Vesicles Originating from Endothelial Cells in Vivo Demonstrates Improved Astrocyte Function Following Ischemic Stroke via Aggregation-Induced Emission Luminogens

Xiangyu Gao et al. ACS Nano. .

Abstract

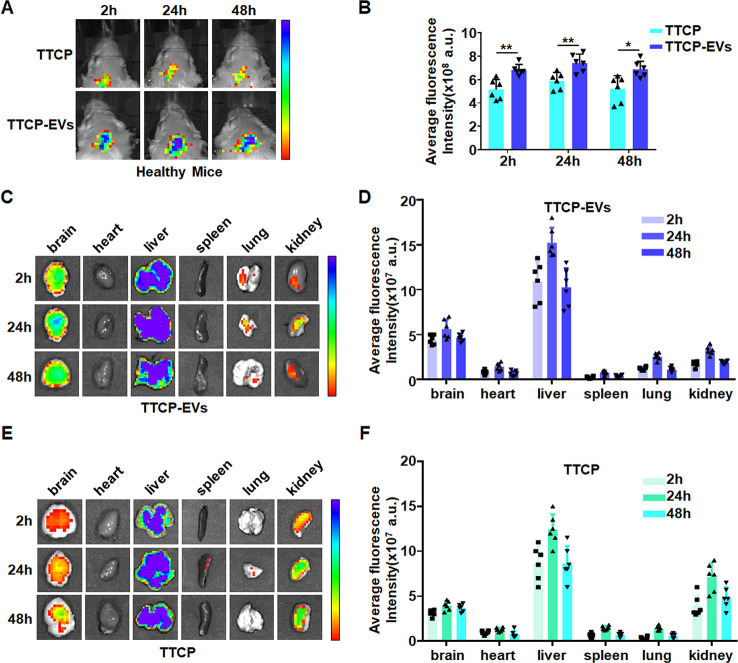
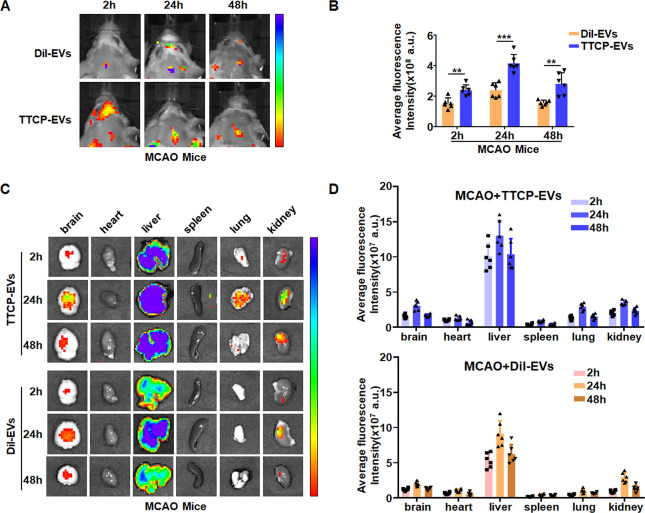
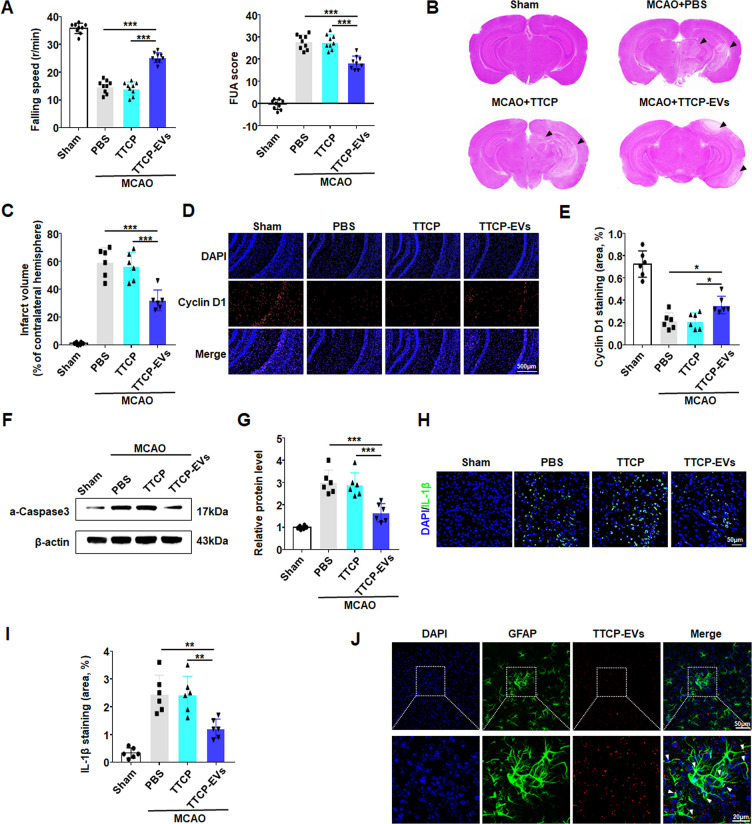
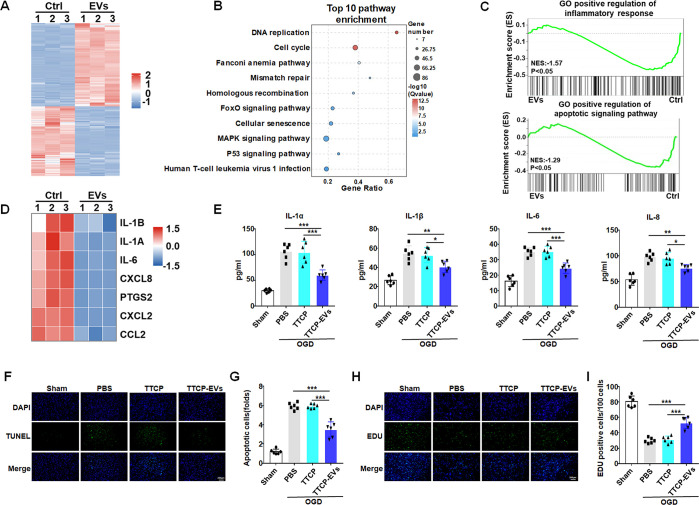
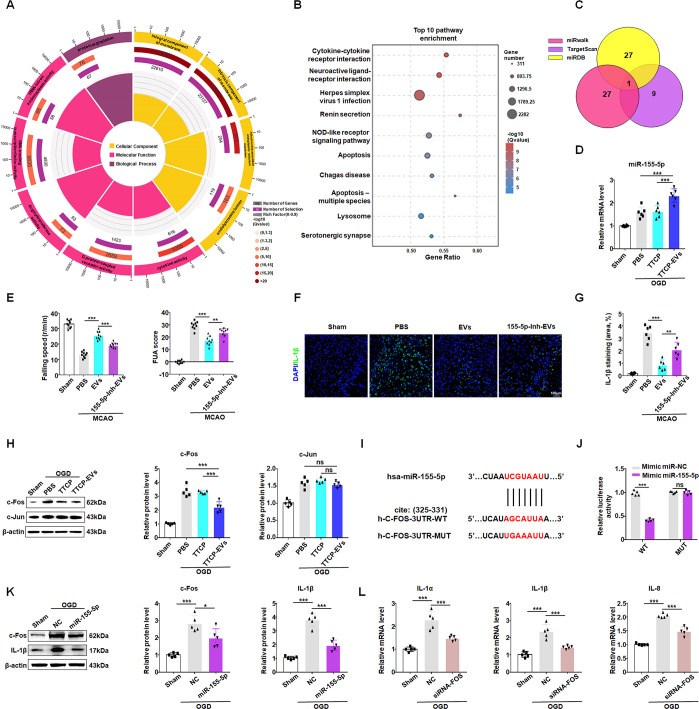
Extracellular vesicles (EVs) obtained from endothelial cells (ECs) have significant therapeutic potential in the clinical management of individuals with ischemic stroke (IS) because they effectively treat ischemic stroke in animal models. However, because molecular probes with both high labeling efficiency and tracer stability are lacking, monitoring the actions of EC-EVs in the brain remains difficult. The specific intracellular targets in the brain that EC-EVs act on to produce their protective effects are still unknown, greatly impeding their use in clinical settings. For this research, we created a probe that possessed aggregation-induced emission (AIE) traits (namely, TTCP), enabling the effective labeling of EC-EVs while preserving their physiological properties. In vitro, TTCP simultaneously had a higher EC-EV labeling efficiency and better tracer stability than the commercial EV tags PKH-67 and DiI. In vivo, TTCP precisely tracked the actions of EC-EVs in a mouse IS model without influencing their protective effects. Furthermore, through the utilization of TTCP, it was determined that astrocytes were the specific cells affected by EC-EVs and that EC-EVs exhibited a safeguarding impact on astrocytes following cerebral ischemia-reperfusion (I/R) injury. These protective effects encompassed the reduction of the inflammatory reaction and apoptosis as well as the enhancement of cell proliferation. Further analysis showed that miRNA-155-5p carried by EC-EVs is responsible for these protective effects via regulation of the c-Fos/AP-1 pathway; this information provided a strategy for IS therapy. In conclusion, TTCP has a high EC-EV labeling efficiency and favorable in vivo tracer stability during IS therapy. Moreover, EC-EVs are absorbed by astrocytes during cerebral I/R injury and promote the restoration of neurological function through the regulation of the c-Fos/AP-1 signaling pathway.

Keywords: aggregation-induced emission; astrocytes; extracellular vesicles; fluorescence imaging; human umbilical vein endothelial cells; ischemic stroke.


Conflict of interest statement

The authors declare no competing financial interest.

Figures

Figure 1
Figure 1
Synthesis, photophysical properties, and theoretical calculation of TTCP. a Compilation of TTCP. b Normalized ultraviolet–visible absorption of TTCP in THF. c Photoluminescent spectra of TTCP in THF/water blends with varying proportions of water. d The AIE curves of TTCP in mixtures of THF and water (where I0 represents the photoluminescence intensity in pure THF) were examined. e Optimized geometry and HOMO and LUMO distributions of TTCP.
Figure 2
Figure 2
In vitro labeling of EVs. a TEM was utilized to record the images of EVs and TTCP-EVs. Arrow: TTCP. Scale bar: 100 nm. b The size distribution of EVs and TTCP-EVs was assessed by NTA after 1 h of TTCP labeling. c Comparison of the amount of EVs and TTCP-EVs recorded from NTA analysis (n = 6). d Evaluation of the fluidity of the membrane (1/P values) in EVs and TTCP-EVs at ambient temperature (n = 6). e Western blotting was used to analyze the levels of calreticulin, VDAC1, CD9, ALIX, and CD63 in HUVEC lysates, EVs, and TTCP-EVs after preparing their total proteins. f According to the NTA findings, the zeta potentials of EVs and TTCP-EVs were recorded as −24.7 and −18.4 mV, respectively (n = 6). g The UV–vis absorption spectra of TTCP and TTCP-EVs were observed in a PBS solution. h The photoluminescent spectra of TTCP and TTCP-EVs were observed in PBS solution. The data are presented as the mean ± SEM.
Figure 3
Figure 3
Biosafety of TTCP. a Pictures of EVs labeled with TTCP were captured at various concentrations by CLSM. Blue: DAPI. Green: GFAP. Red: TTCP-EVs. Scale bar, 50 μm. b Quantitative analysis was performed on the integrated fluorescence intensity in CLSM images (n = 6). c The cytotoxicity of TTCP (4 μM) and EVs labeled with TTCP (4 μM) was assessed using a CCK8 assay (n = 6). d Hemolysis analysis of TTCP (4 μM) and EVs labeled with TTCP (4 μM) (n = 6). e The mice that received various treatments experienced alterations in their body weight (n = 6). f At 14 days post-treatment, representative pictures of brain, lung, heart, spleen, liver, and kidney sections stained with H&E were captured for the PBS group, TTCP group, and TTCP-EV group. Scale bar, 200 μm. The data are presented as the mean ± SEM *, P < 0.05; **, P < 0.01; ns, not significant.
Figure 4
Figure 4
In vitro labeling efficiency and photostability of TTCP. a The flow cytometry was used to assess the efficiency of TTCP labeling for EVs at various time intervals. b Flow cytometry was employed to assess the efficiency of PKH-67 labeling for EVs at various time points. c The labeling efficiency of TTCP and PKH-67 at different time intervals was quantified (n = 3). d CLSM images of EVs labeled with TTCP for 1 and 3 days. Scale bar, 50 μm. e CLSM pictures of EVs labeled with DiI for 1 and 3 days. Scale bar, 50 μm. f The integrated fluorescence intensity of CLSM images was quantified (n = 6). The data are presented as the mean ± SEM *, P < 0.05; **, P < 0.01; ***, P < 0.001; ns, not significant.
Figure 5
Figure 5
In vivo distribution of TTCP-EVs. aIn vivo fluorescence images of TTCP and TTCP-EV in healthy mice’s brains. b An analysis of in vivo fluorescence images of the brain’s time-dependent average fluorescence intensity (n = 6). c After TTCP-EVs were administered, brain, liver, heart, lung, spleen, and kidney samples were dissected at the designated time and imaged ex vivo. d Quantitative evaluation was conducted on the time-dependent average fluorescence intensity of major organs from mice that were administered with TTCP-EVs (n = 6). e After TTCP was administered, brain, liver, heart, lung, spleen, and kidney samples were dissected at the designated time and imaged ex vivo. f Quantitative examination of the time-based average fluorescence intensity of major organs from mice that were administered with TTCP (n = 6). The data are presented as the mean ± SEM *, P < 0.05; **, P < 0.01; ***, P < 0.001; ns, not significant.
Figure 6
Figure 6
In vivo tracking of TTCP-EVs in MCAO mice. aIn vivo fluorescence images of DiI-EVs and TTCP-EVs in MCAO mice’s brains. b An analysis of in vivo fluorescence images of the brain’s time-dependent average fluorescence intensity (n = 6). c After TTCP-EVs and DiI-EVs were administered into MCAO mice, brain, liver, heart, lung, spleen, and kidney samples were dissected at the designated time and imaged ex vivo. d Quantitative assessment was conducted on the time-dependent average fluorescence intensity of primary organs in MCAO mice that received TTCP-EVs and DiI-EVs (n = 6). The data are presented as the mean ± SEM *, P < 0.05; **, P < 0.01; ***, P < 0.001; ns, not significant.
Figure 7
Figure 7
HUVEC-derived EVs protect brain function in MCAO mice. a Mice were tested 7 days after MCAO and TTCP-EV treatment for the speed at which they fell off the rotarod (n = 9); Mice were also tested 7 days after MCAO and TTCP-EV treatment by FUA test (n = 9). b Brain tissue was H&E-stained 7 days after MCAO and TTCP-EV treatment. c The brain’s infarct size was calculated (n = 6). d Brain tissue was stained with Cyclin D1 after 7 days of MCAO and TTCP-EV treatment. Scale bar: 500 μm. e A calculation was made to determine the percentage of Cyclin D1-positive cells (n = 6). f Western blotting was used to determine the levels of active Caspase3 (a-Caspase3). g The quantity of a-Caspase3 protein levels was measured (n = 6). h Brain tissue was stained with IL-1β after 7 days of MCAO and TTCP-EV treatment. Scale bar, 50 μm. i A calculation was made to determine the proportion of cells positive for IL-1β (n = 6). j CLSM images of internalized TTCP-EVs in astrocytes. Blue: DAPI; Green: GFAP; Red: TTCP- EVs; Scale bar, 50 and 20 μm. The data are presented as the mean ± SEM, *, P < 0.05; **, P < 0.01; ***, P < 0.001; ns, not significant.
Figure 8
Figure 8
HUVEC-EVs preserve the function of astrocytes. a Heatmap of mRNA-seq analysis of SVGp12 cells treated with OGD and 20 μg/mL HUVEC-EVs (n = 3) and SVGp12 cells treated with OGD and PBS as a control (n = 3). A total of 2,184 genes were discovered, meeting the criteria of gene expression change greater than 2-fold and a significance level of p < 0.05. b Pathway enrichment was determined through KEGG analysis. c GSEA spectra of RNA-seq data. d A heatmap displayed the expression of genes associated with inflammation. e ELISA-based analysis of the IL-1α, IL-1β, IL-6 and IL-8 concentrations in the culture supernatants of SVGp12 cells. These cells were treated with OGD and then incubated with PBS, TTCP, or TTCP-EVs (n = 6). f SVGp12 cells were treated by OGD and incubated with PBS, TTCP, or TTCP-EVs. The TUNEL assay was used to assess the apoptosis of the SVGp12 cells. Scale bar, 200 μm. g Quantitative analysis of the TUNEL assay images (n = 6). h SVGp12 cells were treated by OGD and incubated with PBS, TTCP or TTCP-EVs. The proliferation of SVGp12 cells was observed by using EdU staining. Scale bar, 200 μm. i Quantitative evaluation of the images from the EdU incorporation assay (n = 6). The data are presented as the mean ± SEM *, P < 0.05; **, P < 0.01; ***, P < 0.001; ns, not significant.
Figure 9
Figure 9
MiRNA-155-5p carried by EVs Protected Astrocytes via the c-Fos/AP-1 Signaling Pathway. a Target GO enrichment analysis of miRNAs enriched in HUVEC-EVs. b To identify pathway enrichment, a KEGG analysis was conducted on miRNAs enriched in HUVEC-EVs. c A Venn diagram was used to screen and depict miRNAs derived from HUVEC-EVs and those associated with inflammation mentioned in the literature. d The qRT-PCR was used to determine the miR-155-5p levels in SVGp12 cells (n = 6). e Mice were tested 7 days after MCAO and EV/155-5p-Inh-EV treatment for the speed at which they fell off the rotarod (n = 9); Mice were also tested 7 days after MCAO and EV/155-5p-Inh-EV treatment by the FUA test (n = 9). f Brain tissue was stained with IL-1β after 7 days of MCAO and treatment with EV/155-5p-Inh-EV. Scale bar: 100 μm. g A calculation was performed to ascertain the proportion of cells positive for IL-1β (n = 6). h Western blotting was used to determine the levels of c-Fos and c-Jun in SVG12p cells, and the protein levels of c-Fos and c-Jun were quantified (n = 5). i Wild-type and mutated binding sites between hsa-miR-155-5p and C-FOS (human). j The activities of luciferase generated by respective plasmids containing 3′UTR were detected using a dual luciferase reporter assay after overexpressing hsa-miR-155-5p in 293T cells (n = 5). k Western blotting was used to determine the levels of c-Fos and IL-1β in SVG12p cells (n = 5). l The mRNA levels of IL-1α, IL-1β and IL-8 in SVG12p cells were determined using qRT–PCR (n = 5). The data are presented as the mean ± SEM *, P < 0.05; **, P < 0.01; ***, P < 0.001; ns, not significant.

Similar articles

Cited by

References

    1. Global, Regional, and National Incidence, Prevalence, and Years Lived with Disability for 301 Acute and Chronic Diseases and Injuries in 188 Countries, 1990–2013: A Systematic Analysis for the Global Burden of Disease Study 2013. Lancet (London, England) 2015, 386 (9995), 743–800. 10.1016/S0140-6736(15)60692-4. - DOI - PMC - PubMed
    1. Campbell B. C. V.; Khatri P. Stroke. Lancet (London, England) 2020, 396 (10244), 129–142. 10.1016/S0140-6736(20)31179-X. - DOI - PubMed
    1. D'Souza A.; Dave K. M.; Stetler R. A.; Manickam D. S. Targeting the Blood-Brain Barrier for the Delivery of Stroke Therapies. Advanced drug delivery reviews 2021, 171, 332–351. 10.1016/j.addr.2021.01.015. - DOI - PubMed
    1. Hill A. F. Extracellular Vesicles and Neurodegenerative Diseases. Journal of neuroscience: the official journal of the Society for Neuroscience 2019, 39 (47), 9269–9273. 10.1523/JNEUROSCI.0147-18.2019. - DOI - PMC - PubMed
    1. Ruan J.; Miao X.; Schlüter D.; Lin L.; Wang X. Extracellular Vesicles in Neuroinflammation: Pathogenesis, Diagnosis, and Therapy. Molecular therapy: the journal of the American Society of Gene Therapy 2021, 29 (6), 1946–1957. 10.1016/j.ymthe.2021.04.020. - DOI - PMC - PubMed

Publication types