. 2023 Dec 1;146(12):5209-5223.
doi: 10.1093/brain/awad262.

Cell-type specific and multiscale dynamics of human focal seizures in limbic structures

Affiliations

Cell-type specific and multiscale dynamics of human focal seizures in limbic structures

Alexander H Agopyan-Miu et al. Brain. .

Abstract

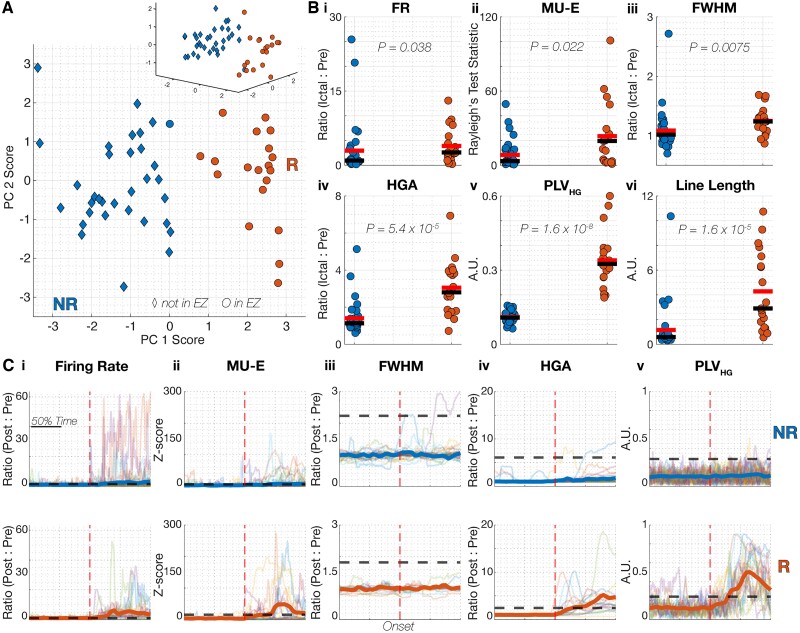
The relationship between clinically accessible epileptic biomarkers and neuronal activity underlying the transition to seizure is complex, potentially leading to imprecise delineation of epileptogenic brain areas. In particular, the pattern of interneuronal firing at seizure onset remains under debate, with some studies demonstrating increased firing and others suggesting reductions. Previous study of neocortical sites suggests that seizure recruitment occurs upon failure of inhibition, with intact feedforward inhibition in non-recruited territories. We investigated whether the same principle applies in limbic structures. We analysed simultaneous electrocorticography (ECoG) and neuronal recordings of 34 seizures in a cohort of 19 patients (10 male, 9 female) undergoing surgical evaluation for pharmacoresistant focal epilepsy. A clustering approach with five quantitative metrics computed from ECoG and multiunit data was used to distinguish three types of site-specific activity patterns during seizures, which at times co-existed within seizures. Overall, 156 single units were isolated, subclassified by cell-type and tracked through the seizure using our previously published methods to account for impacts of increased noise and single-unit waveshape changes caused by seizures. One cluster was closely associated with clinically defined seizure onset or spread. Entrainment of high-gamma activity to low-frequency ictal rhythms was the only metric that reliably identified this cluster at the level of individual seizures (P < 0.001). A second cluster demonstrated multi-unit characteristics resembling those in the first cluster, without concomitant high-gamma entrainment, suggesting feedforward effects from the seizure. The last cluster captured regions apparently unaffected by the ongoing seizure. Across all territories, the majority of both excitatory and inhibitory neurons reduced (69.2%) or ceased firing (21.8%). Transient increases in interneuronal firing rates were rare (13.5%) but showed evidence of intact feedforward inhibition, with maximal firing rate increases and waveshape deformations in territories not fully recruited but showing feedforward activity from the seizure, and a shift to burst-firing in seizure-recruited territories (P = 0.014). This study provides evidence for entrained high-gamma activity as an accurate biomarker of ictal recruitment in limbic structures. However, reduced neuronal firing suggested preserved inhibition in mesial temporal structures despite simultaneous indicators of seizure recruitment, in contrast to the inhibitory collapse scenario documented in neocortex. Further study is needed to determine if this activity is ubiquitous to hippocampal seizures or indicates a 'seizure-responsive' state in which the hippocampus is not the primary driver. If the latter, distinguishing such cases may help to refine the surgical treatment of mesial temporal lobe epilepsy.

Keywords: ictal recruitment; ictal territories; inhibition; interneurons; single unit.


Conflict of interest statement

G.M.M. is an investigator and on the publication committee for the ‘Stereotactic Laser Ablation in Temporal Epilepsy’ (SLATE) trial funded by Medtronic, plc. None of the patients in this study were enrolled in the SLATE trial. The other authors report no competing interests.

Figures

Figure 1
Figure 1
Illustration of neural activity metrics. The raw signal obtained from the nearest macroelectrode is filtered into two bands: the 2–20 Hz low frequency rhythm (A) and the 80–150 Hz high-gamma band (B). (C) The coupling between the high-gamma amplitude and the low frequency phase (phase locking value, PLVHG) can then be calculated across these signals obtained from the nearest macroelectrode. (D) Detected multi-unit spikes (red dots) from the microelectrodes provide firing rate and multi-unit entrainment (MU-E) to the phase of the low-frequency rhythm (blue line). (E) Polar histograms for the phases of all multi-unit spikes from the regions marked in D, comprising the same number of spikes in each of the pre-ictal epoch (i, green, starting prior to region plotted) and the ictal epoch (ii, purple), with corresponding Rayleigh z-statistic values of 2.90 and 107.3, respectively. (F) Expanded section from AD as marked by the grey bar. (G) Schematic of ‘Behnke–Fried’ style electrode design and sources of data used in the above metrics. These are derived from recordings from microelectrodes, positioned at the distal end of the electrode shaft, and the distal macroelectrode on the same shaft. FR = multi-unit firing rate; FWHM = full-width at half-maximum; MUA = multi-unit activities; SUA = single-unit activities.
Figure 2
Figure 2
Distinct neural activity patterns identified with clustering techniques. (A) Each macro-micro pair’s metrics plotted in feature space after dimensionality reduction (t-distributed stochastic neighbour embedding, t-SNE), revealing two to three visually distinguishable clusters across multiple runs and different ‘perplexity’ values, where perplexity is a tunable parameter that, roughly, sets a target number of neighbours for each cluster centre. For ease of interpretation, each data-point is colour-coded based on the results of an average run (run 6; perplexity = 15). (B) To derive null distributions for Calinski–Harabasz (CH) indices that would arise by chance, principal component scores between data points were randomly shuffled and the CH index recalculated 1000 times (faded multi-coloured lines in background). The CH index is then calculated on the original data 100 independent times (blue lines), and the final CH index is calculated as the mean of those runs (thick black line). (C) Gaussian curves (orange) are fitted to the null distributions found in B (blue), from which the probability of finding a value as extreme as the observed CH index (black line) can be calculated. While k = 7 was unlikely to arise by chance, the solution was unstable (see ‘Materials and methods’ section). Individual clustering solutions can be seen in Supplementary Fig. 1.
Figure 3
Figure 3
Ictal activity patterns revealed by the two-cluster solution. (A) Principal component analysis (PCA) results colour coded by group (blue = non-recruited; orange = recruited); all but one clinically determined epileptogenic zone (EZ) site corresponded to the recruited group. (B) Box plots comparing each metric by group (red and black bars: mean and median, respectively). Line-length is shown as a quantitative proxy for the clinically determined EZ and was not included in the dataset used for PCA. Note that while all metrics showed significant differences between groups, complete separation was apparent only for the phase locking value (PLVHG; Bv). (C) The trajectory for each macro-micro recording in a given seizure (faded lines) with group means overlaid (thick lines) for each metric, aligned to seizure onset (red dashed line). Data are plotted against ‘normalized time’ to facilitate comparison (time for each data-point was divided by that seizure’s duration). Black-dotted lines represent 2.5 SD above the pre-ictal mean for each metric. Note how consistently PLVHG changes across the ictal transition for each member in their respective groups (Cv): by about halfway through the ictal period (‘50% time’) the average PLVHG across members in the recruited group was more than 2.5 SD above the pre-ictal average, whereas ictal PLVHG is unchanged from pre-ictal baseline for each member in the non-recruited group. FR = multi-unit firing rate; FWHM = full-width at half-maximum; HGA = high-gamma amplitude; ME-U = multi-unit entrainment.
Figure 4
Figure 4
Recruitment follows a trajectory starting in the non-recruited feature space. (A) Fitting a Gaussian mixture model to the Box–Cox transformed macro-electrode metrics can provide probabilities of belonging to the recruited versus non-recruited groups for any given value. (B) The instantaneous probability of being in recruited tissue for each electrode, throughout the pre-ictal and ictal epoch (normalized time), based on the continuous phase locking value (PLVHG) and high-gamma amplitude (HGA) values for each seizure. Traces are colour-coded by original clustering group [recruited (R) in orange; non-recruited (NR1) in blue and NR2 in yellow], showing the rise in probability that the tissue recorded in the ‘R’ group has transitioned to recruited as the seizure progresses, arising from a non-recruited state. Note that while a subset of ‘NR’ recordings show late increases in recruitment probability, the majority remain below 50%, i.e. are still deemed more likely to be unrecruited than recruited. Only two transiently surpass 50% probability, while all in the ‘R’ group reach 100%. (CF) Example trajectories of a single electrode and seizure in the feature space from A, colour-coded by normalized ictal time, with seizure onset and pre-termination marked with circles. Heat map below shows the probability density function, revealing the dense regions for ‘NR’ and ‘R’ values. (C) Recruited electrode site with trajectory starting in the non-recruited region and progressing to the ‘recruitment’ feature space. (D) A single electrode site that remained unrecruited in seizure 1 (i, focal unaware seizure) and then became recruited in seizure 2 [ii, focal to bilateral tonic-clonic (FTBTC) seizure]. Note the similar trajectory in seizure 2 prior to transitioning to recruitment. (E and F) Three paired electrodes from two seizures in the same patient, showing stereotypy of trajectory across seizures for each electrode, but dissimilar trajectories between different electrode sites: (i) mid-cingulate electrode that remained in NR1 throughout both seizures; (ii) an anterior cingulate electrode that remained NR2 in both; and (iii) a simultaneously recorded hippocampal electrode that transitioned from not-recruited to recruited during the seizure while the others remained unrecruited.
Figure 5
Figure 5
The three-cluster solution reveals a subgroup of electrodes within the non-recruited group. (A) Data plotted as in Fig. 3, but colour-coded to demonstrate the three-cluster solution. The third cluster represents a subgroup of macro-micro pairs within the non-recruited group termed NR1 (blue) and NR2 (yellow). The recruited group (R) is the same in both the two- and three-cluster solution. (B) Data plotted as per Fig. 3B but with subgroups NR1 and NR2 isolated. Only comparisons between the subgroups are made to compare ictal activity pattern. Compared to NR2, subgroup NR1 displayed significantly greater values in all metrics except for the phase locking value (PLVHG) and line-length. FR = multi-unit firing rate; FWHM = full-width at half-maximum; HGA = high-gamma amplitude; MU-E = multi-unit entrainment.
Figure 6
Figure 6
Single-unit ictal firing pattern analyses by putative cell-type. (A) Pre-ictal versus ictal normalized firing rates (FR) for pyramidal cells (blue), and interneurons [red: fast-spiking (FS); orange: regular spiking (RS); same colour-coding throughout figure] in non-recruited (i) and recruited (ii) groups. Firing rates were normalized to the ictal epoch duration to facilitate visual comparison across seizures; equivalent raw firing rates are shown in Supplementary Fig. 4. Dashed line: equal firing rates across epochs; dotted lines: ± 3 SD changes in a Poisson distribution for that firing rate. Data on axes lines represent zero firing. (B)Violin plots of the ictal firing rates as calculated in A, z-scored by the Poisson-estimated SD by cell-type/group. Each dot is a single unit during one seizure. Shaded region: ± 3 SD change from pre-ictal rates. (C) Calculation of single-unit amplitude trajectories through time, showing an example of firing cessation (blue line and marker) with increased chance of undetected firing (i) and another with stable action potentials (ii). Orange line and heat map: fitted spline and instantaneous probabilistic amplitude distribution (see ‘Materials and methods’ section). Red barrier: threshold for spike detection. Black line: instantaneous probability of spikes from that neuron being undetected. Dots: spike time and voltage at trough (diameter: single-unit assignment confidence). Inset: All spike waveforms [scale bars = 0.2 ms, 50 µV (i) and 20 µV (ii); colour: spike time]. (D) Trajectories from fitted splines in 10 s prior to cessation, normalized to detection threshold. (E) Probability of that voltage or smaller for the mean of the fitted spline based on the pre-ictal distribution of voltages for each single unit. (F) Waveform metrics for each single unit, showing a population increase in spike duration (i) and decrease in amplitude (ii) in R, normalized to pre-ictal values for each unit. Note the inverse relationship in the FS interneuron population (red).
Figure 7
Figure 7
Example fast-spiking interneuron ictal firing patterns. (A) A transient increase followed by cessation in the recruited group. (B) A reduction of firing with no prior increase also in the recruited group. (C) A cessation with no prior increase in non-recruited group NR1. (i) Local field potential from the labelled macroelectrode; (ii) paired raster plot of all units from each microwire bundle, showing putative pyramidal cells (black), regular spiking (RS) interneurons (orange) and fast-spiking (FS) interneurons (red). FS interneuron of interest is marked with an asterisk. Line height for each spike in the raster shows confidence each action potential arose from its assigned unit; (iii) probabilistic firing rates for the marked FS interneuron along with the mean rates from other cells on the same microwire bundle [cell-type colours maintained from (ii)]; (iv) voltage at detection for each spike from the marked FS interneuron (red dots, size shows confidence of match to that neuron), with fitted spline (black line), instantaneous probabilistic distribution through time (heat map; see Fig. 6C), and threshold for detection (red dotted line). Note the stability and distance from threshold prior to each reduction or cessation of firing. (DF) For the example FS interneurons in AC, respectively: (i) Waveforms showing stability of waveshape and clearance from detection threshold (red dotted line); and (ii) autocorrelations over ±100 ms.
Figure 8
Figure 8
Alterations to cell-intrinsic firing properties in recruited tissue. (A and B) Example autocorrelograms from the pre-ictal (grey) and ictal (purple) epochs for two putative fast-spiking (FS) interneurons, with one showing stability in firing pattern [A(i)] and the other transitioning to tonic firing during the seizure [B(i)]. [A(ii) and B(ii)] Cumulative probability plots and calculated ACdist values. Stability of spike shapes are shown by the superimposed plots of all waveforms (inset, grey) with preictal and ictal means overlaid in black and purple, respectively. Scale bars = 0.2 ms, 20 µV (A) and 10 µV (B). (C) Population ACdist values by group and cell-type. In order to derive meaningful autocorrelation patterns over the 100 ms window, this was limited to units with firing rates ≥0.2 spikes s−1 (i.e. at least 20 spikes contributing to the autocorrelation) (D) Average autocorrelograms for each epoch and group, for putative (i) excitatory and (ii) inhibitory cells, showing the distinctive increase in burst firing (within 10 ms) for excitatory cells and shift from quintessential inhibitory interneuron firing pattern to a bursting pattern specific to the recruited group. Colours as per key: blue and yellow for the pre-ictal epoch in groups NR and R, respectively; orange and red for NR and R in the ictal epoch.

References

    1. Schevon CA, Weiss SA, McKhann G, et al. Evidence of an inhibitory restraint of seizure activity in humans. Nat Commun. 2012;3:1060–1011. - PMC - PubMed
    1. Eissa TL, Dijkstra K, Brune C, et al. Cross-scale effects of neural interactions during human neocortical seizure activity. PNAS. 2017;114:10761–10766. - PMC - PubMed
    1. Merricks EM, Smith EH, Emerson RG, et al. Neuronal firing and waveform alterations through ictal recruitment in humans. J Neurosci. 2021;41:766–779. - PMC - PubMed
    1. Tryba AK, Merricks EM, Lee S, et al. Role of paroxysmal depolarization in focal seizure activity. J Neurophysiol. 2019;122:1861–1873. - PMC - PubMed
    1. Merricks EM, Smith EH, McKhann GM, et al. Single unit action potentials in humans and the effect of seizure activity. Brain. 2015;138(10):2891–2906. - PMC - PubMed

Publication types