. 2023 Sep:185:106248.
doi: 10.1016/j.nbd.2023.106248. Epub 2023 Aug 1.

Inhibitory and excitatory synaptic neuroadaptations in the diazepam tolerant brain

Affiliations

Inhibitory and excitatory synaptic neuroadaptations in the diazepam tolerant brain

Joshua M Lorenz-Guertin et al. Neurobiol Dis. 2023 Sep.

Abstract

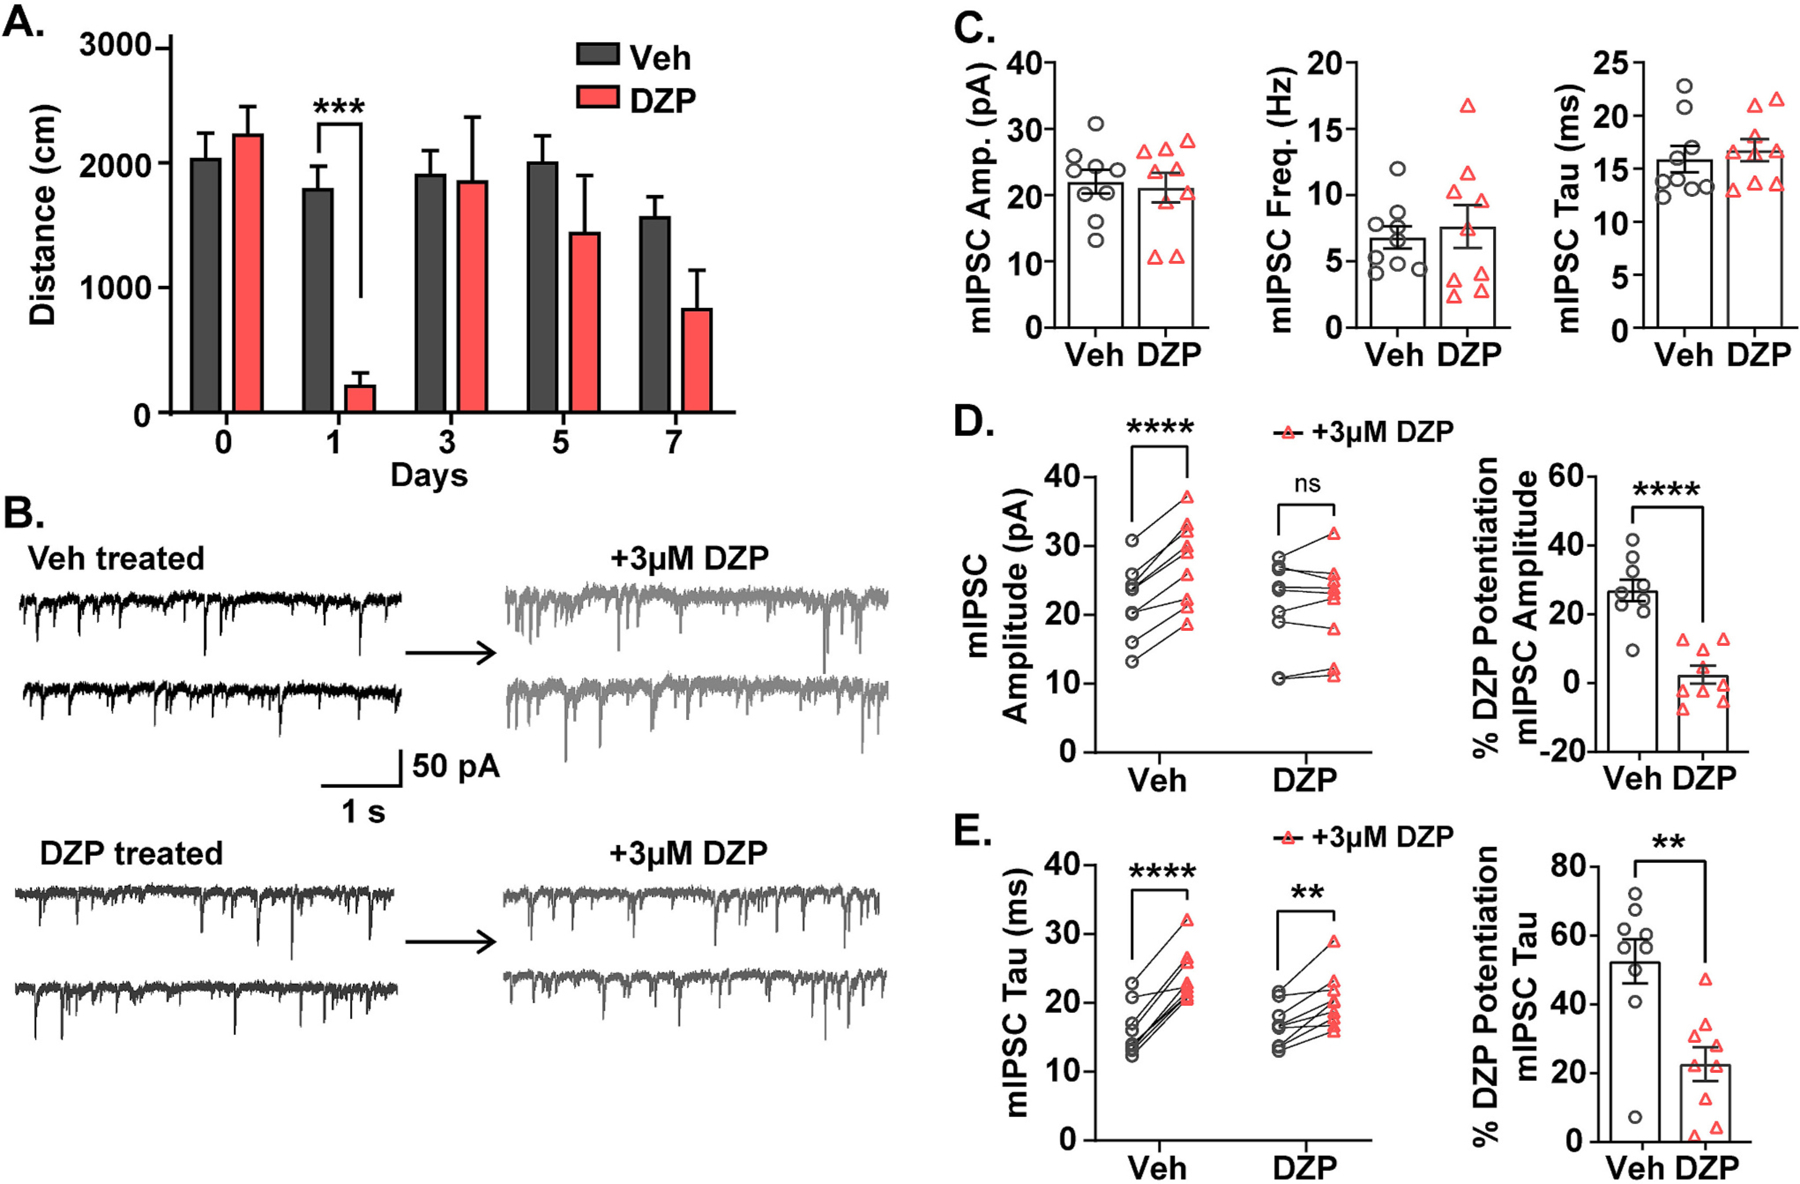
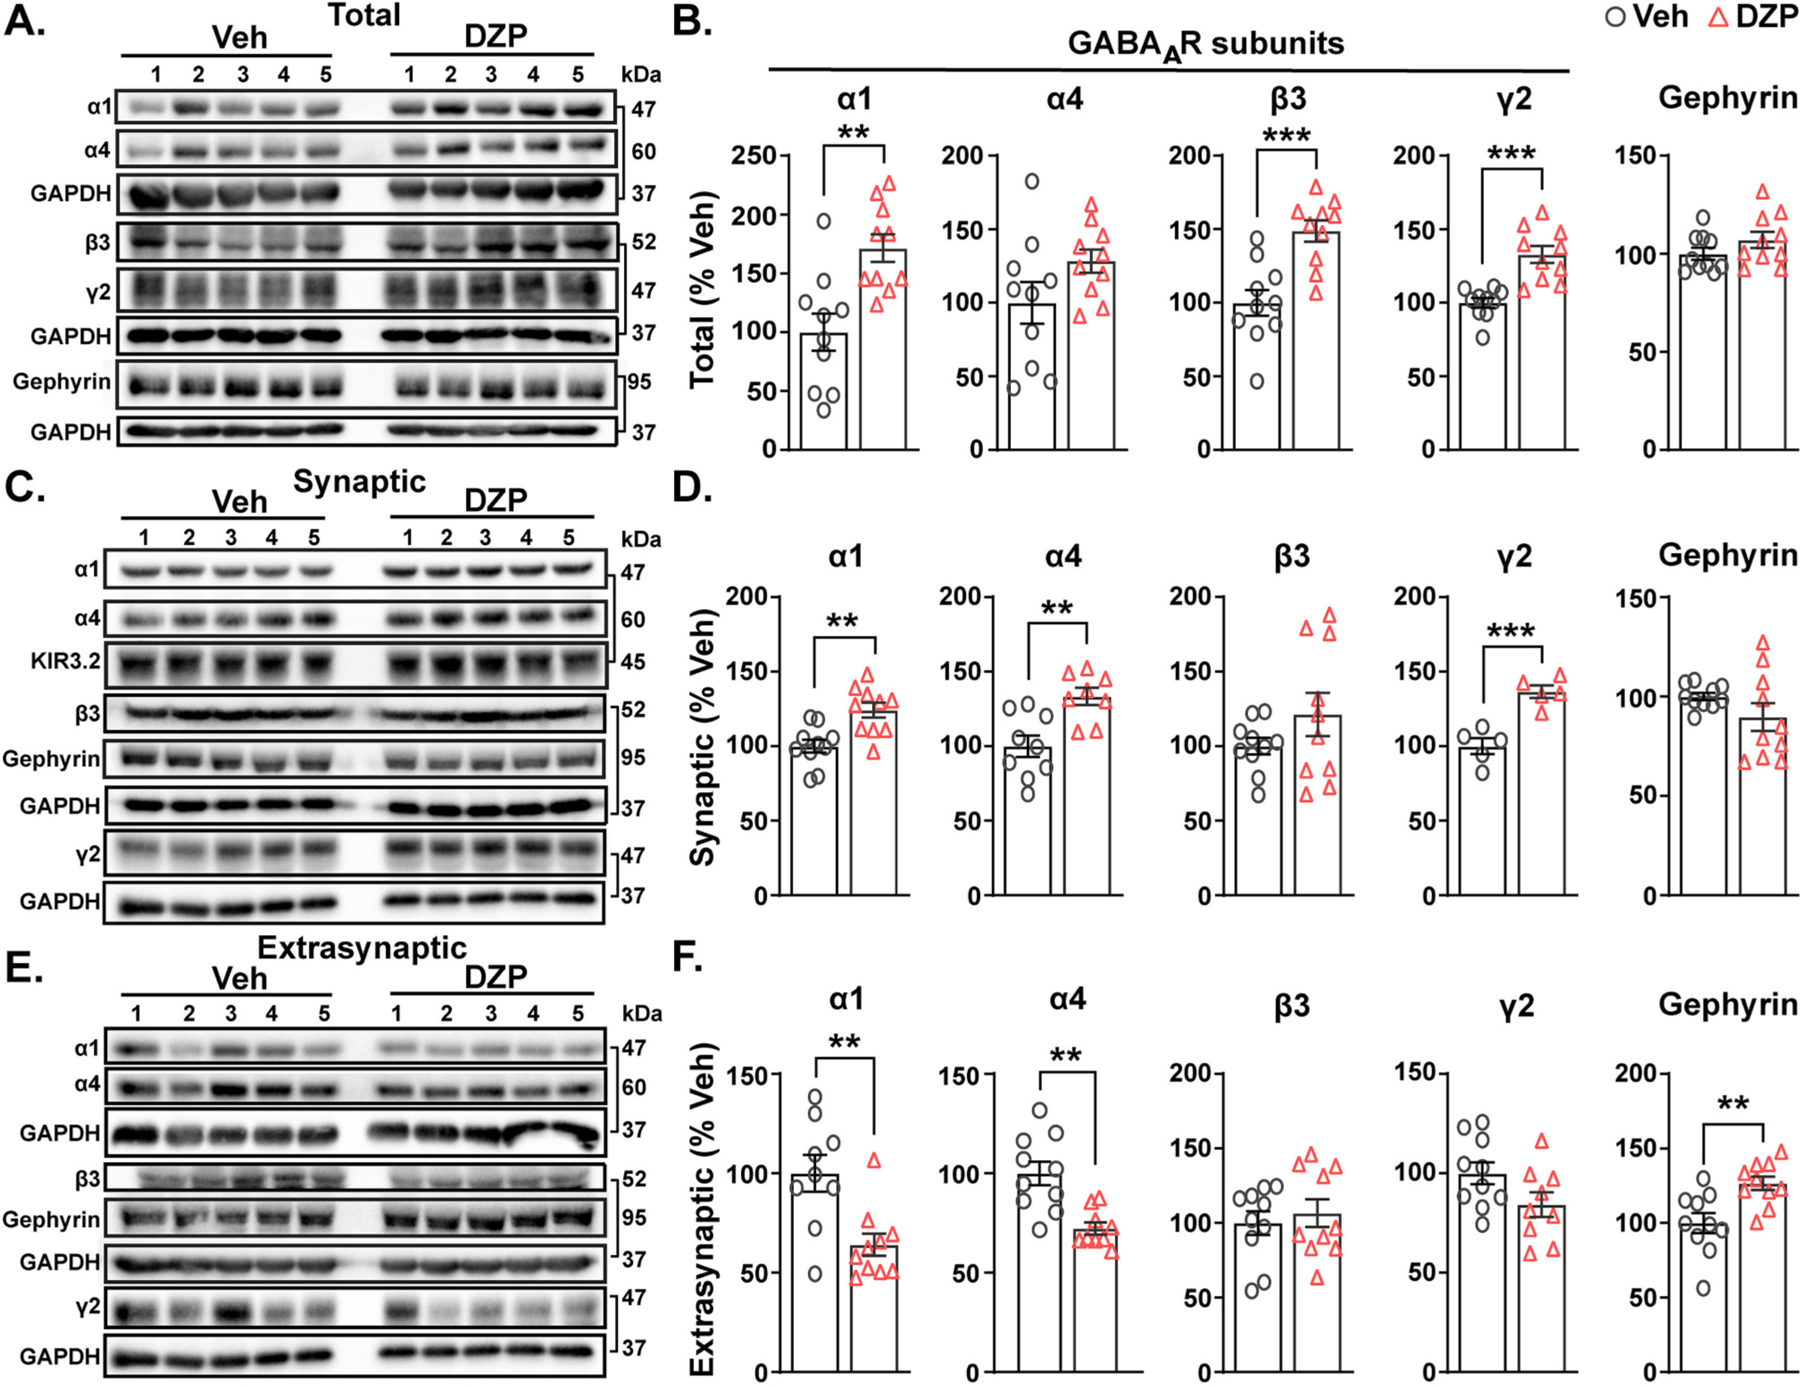
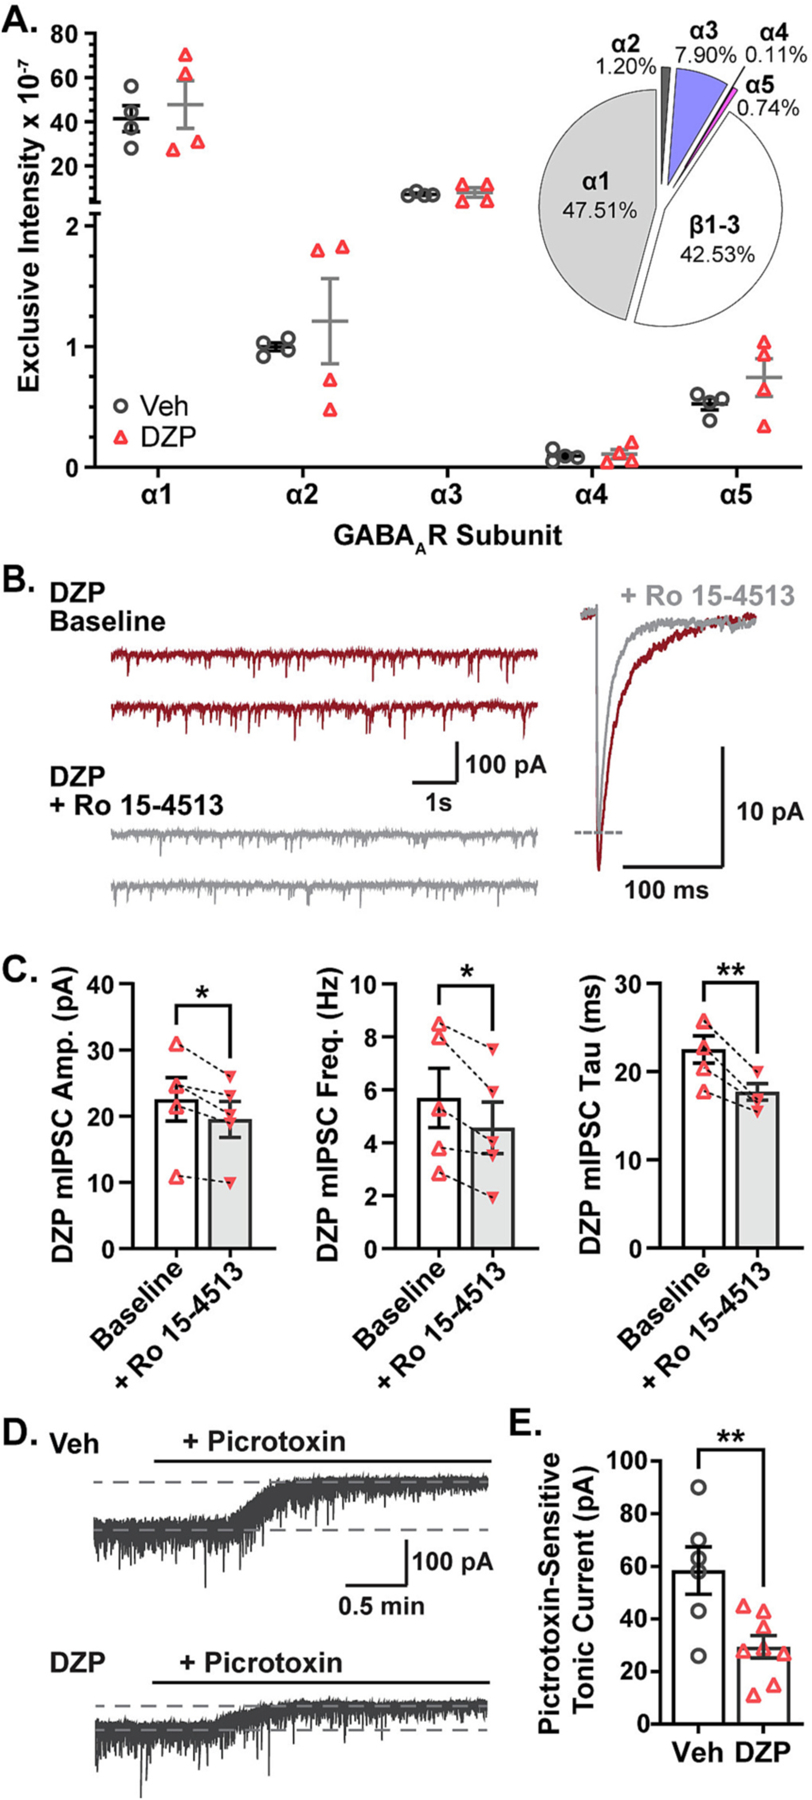
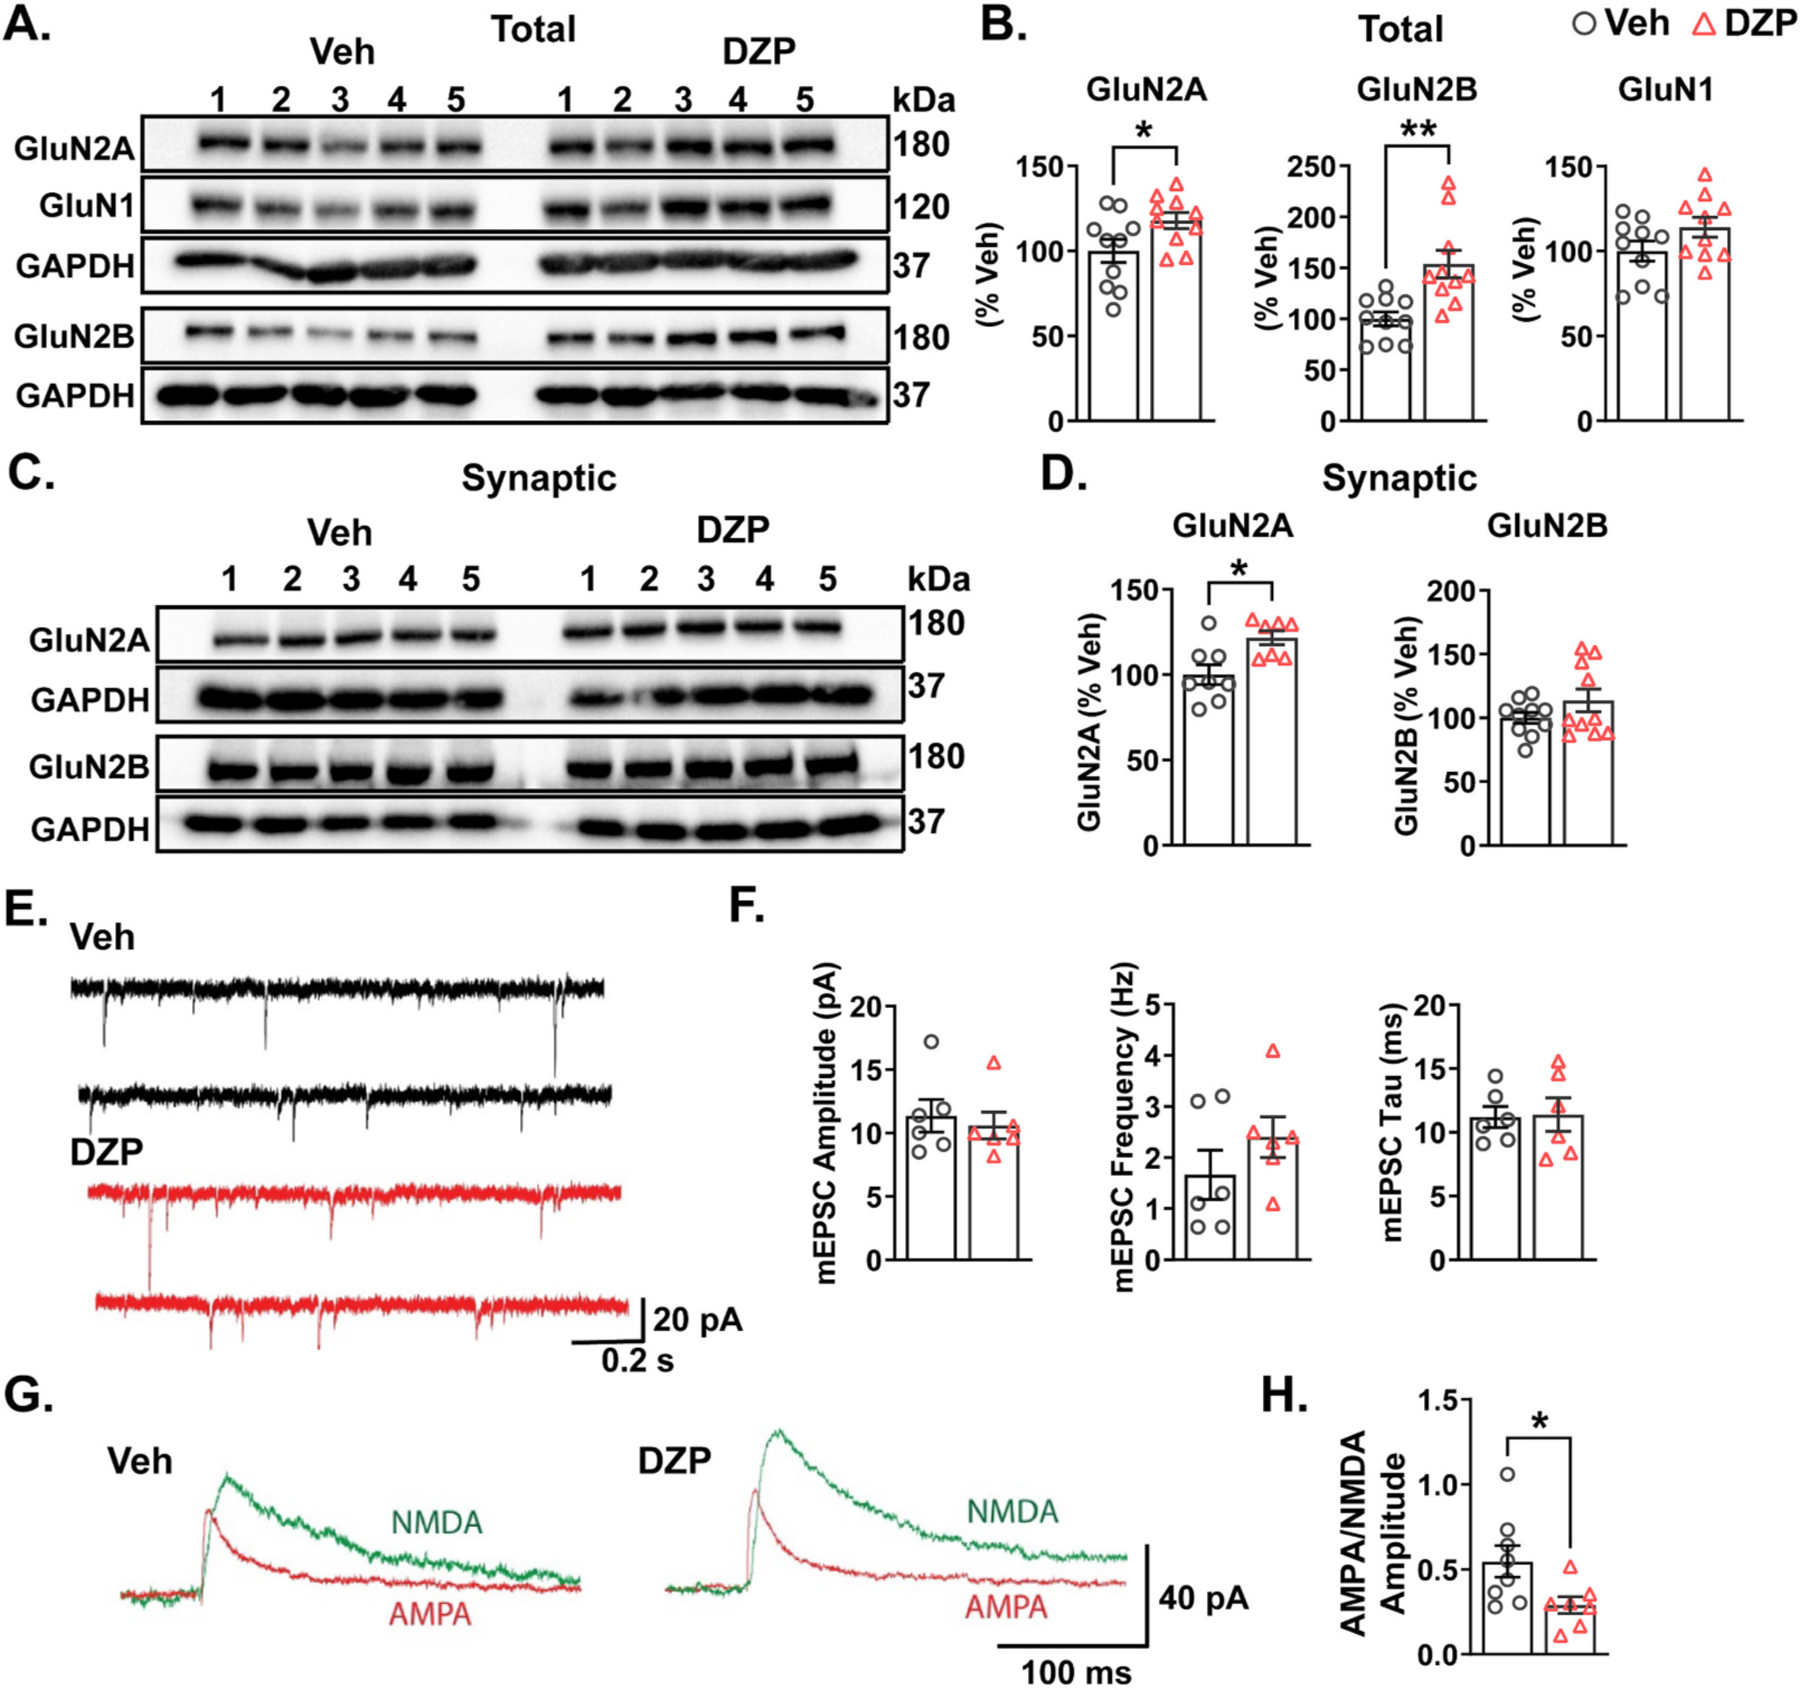
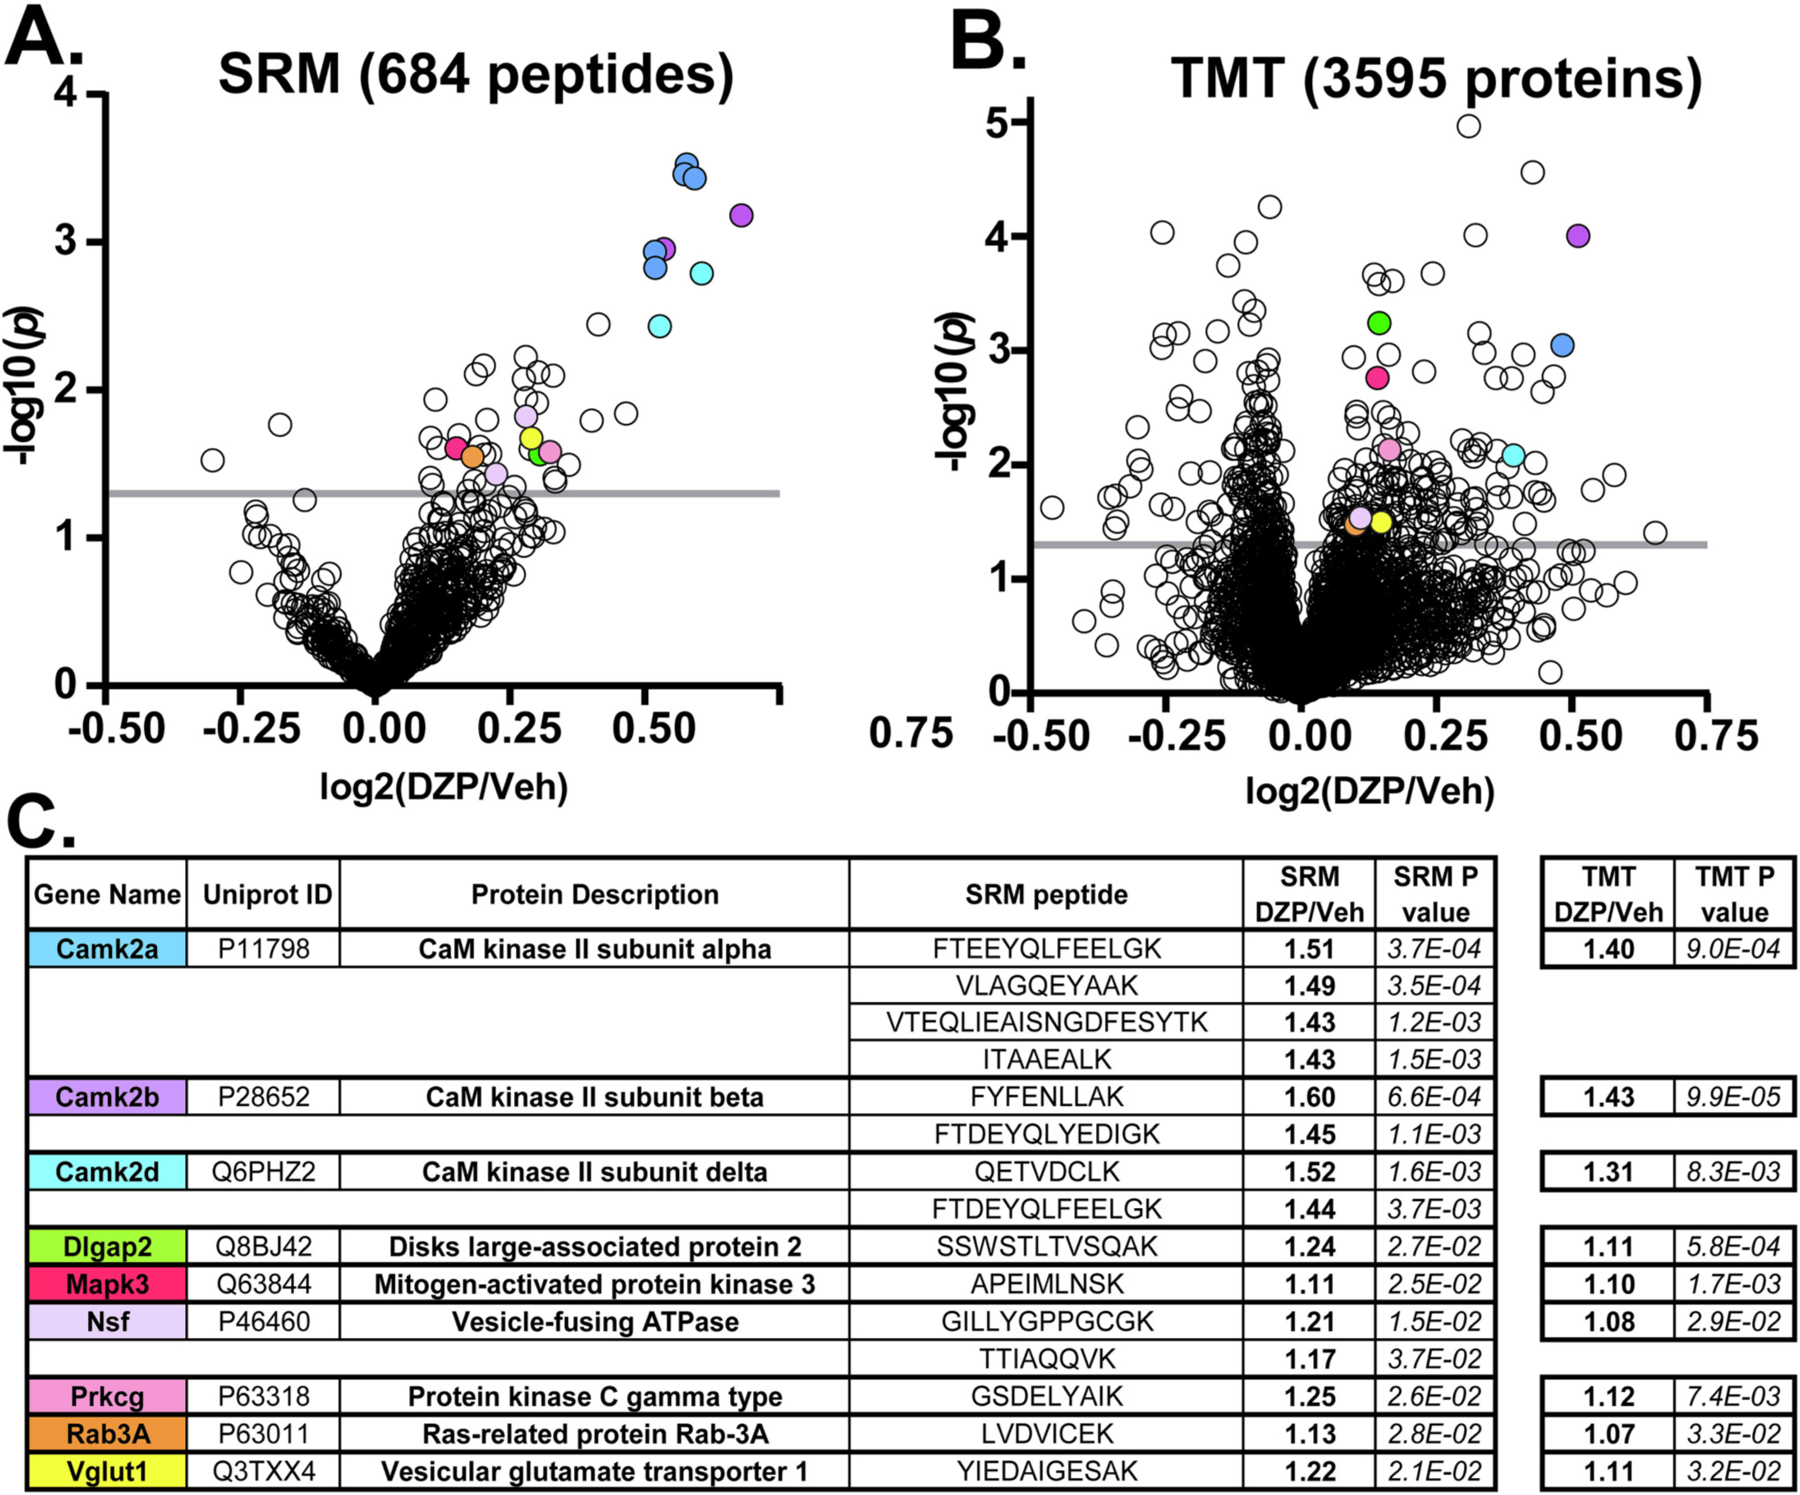
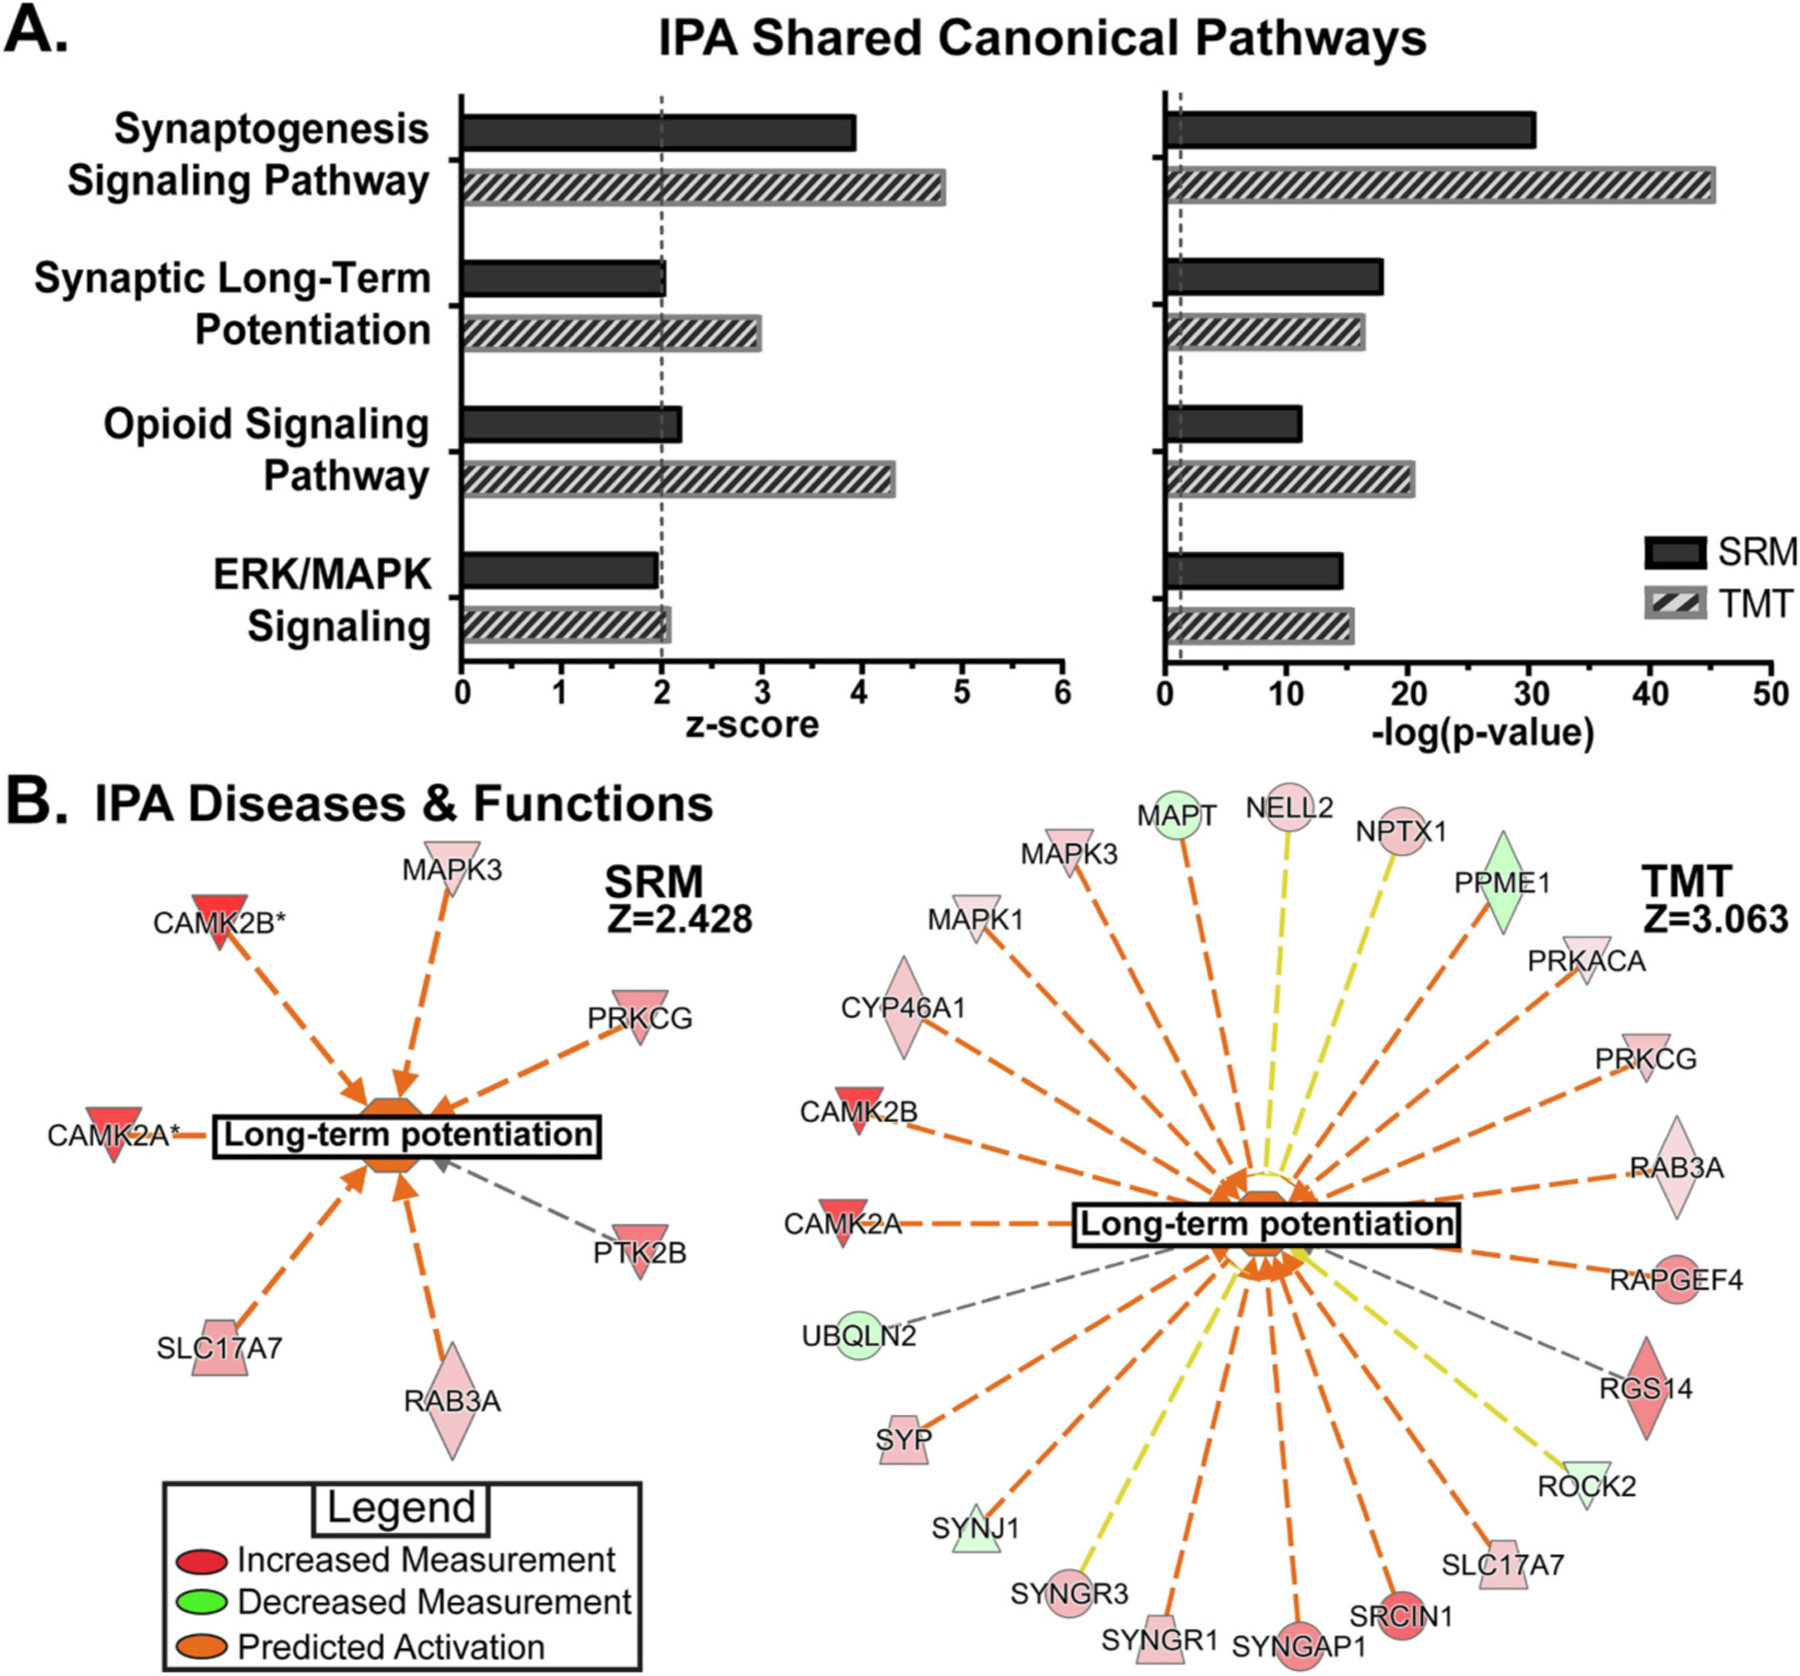
Benzodiazepine (BZ) drugs treat seizures, anxiety, insomnia, and alcohol withdrawal by potentiating γ2 subunit containing GABA type A receptors (GABAARs). BZ clinical use is hampered by tolerance and withdrawal symptoms including heightened seizure susceptibility, panic, and sleep disturbances. Here, we investigated inhibitory GABAergic and excitatory glutamatergic plasticity in mice tolerant to benzodiazepine sedation. Repeated diazepam (DZP) treatment diminished sedative effects and decreased DZP potentiation of GABAAR synaptic currents without impacting overall synaptic inhibition. While DZP did not alter γ2-GABAAR subunit composition, there was a redistribution of extrasynaptic GABAARs to synapses, resulting in higher levels of synaptic BZ-insensitive α4-containing GABAARs and a concomitant reduction in tonic inhibition. Conversely, excitatory glutamatergic synaptic transmission was increased, and NMDAR subunits were upregulated at synaptic and total protein levels. Quantitative proteomics further revealed cortex neuroadaptations of key pro-excitatory mediators and synaptic plasticity pathways highlighted by Ca2+/calmodulin-dependent protein kinase II (CAMKII), MAPK, and PKC signaling. Thus, reduced inhibitory GABAergic tone and elevated glutamatergic neurotransmission contribute to disrupted excitation/inhibition balance and reduced BZ therapeutic power with benzodiazepine tolerance.

Keywords: Benzodiazepine; GABA(A) receptor; NMDA receptor; Proteomics; Sedation; Tolerance.


Conflict of interest statement

Declaration of Competing Interest The authors have no disclosures and declare no conflict of interest.

Figures

Fig. 1.
Fig. 1.
Repeated DZP treatment rapidly leads to sedative tolerance in mice and reduced DZP sensitivity of synaptic inhibition. (A) Diazepam-induced hypolocomotion was assayed with the open field behavioral test on the days indicated. All animals received a Veh injection at day 0 to record basal locomotor activity. Mice received either a DZP (10 mg/kg) or Veh injection on days 1–7. DZP-treated mice demonstrated sedation and a significant decrease in distance traveled compared to Veh-treated animals on day 1. By day 3, the distance traveled was not significantly different between groups, indicating emergence of DZP sedative tolerance. Two-way ANOVA found a significant effect of time (p < 0.0001), treatment (p = 0.0261), and a significant interaction (p = 0.0020), with a post-hoc Sidak test indicating a significant difference between Veh- and DZP-treated animals at day 1 (p < 0.001); n = 16 Veh-treated mice, n = 14 DZP-treated mice. (B) Baseline mIPSCs were recorded (Vhold = −70 mV) in slices from mice treated for seven days with Veh or DZP and following bath application of DZP (3 μM). (C) Basal mIPSC amplitude, frequency and decay time constant (tau) were not different in DZP-treated mice compared to Veh-treated mice. (D-E) mIPSC amplitude (D) and tau (E) were enhanced by application of 3 μM DZP in Veh-treated animals (amplitude, p < 0.0001; tau, p < 0.0001; paired t-test), but this effect was largely diminished in DZP-treated animals (amplitude, p = 0.5396; tau, p = 0.0018; paired t-test), representing a significant overall loss of DZP potentiation (amplitude, p < 0.0001; tau, p = 0.0020). (**p ≤ 0.01, ***p ≤ 0.001, ****p ≤ 0.0001, Student’s t-test unless otherwise stated; n = 9 mice per treatment group; error bars ± S.E.M.).
Fig. 2.
Fig. 2.
Synaptic and extrasynaptic GABAA receptor and gephyrin redistribution with seven-day DZP treatment in vivo. (A-F) Mice were treated i.p. once daily for seven days with Veh or DZP. Western blot analysis of collected cortical tissue was performed to assess protein levels of GABAAR subunits and gephyrin from total (A, B), synaptic (C, D), and extrasynaptic (E, F) fractions. Representative blots show five mice from each treatment group. Proteins quantified by western blot were normalized to GAPDH or KIR3.2 loading control. (B) Measurements of total protein levels revealed a significant increase in α1 (p = 0.0018), β3 (p = 0.0005), and γ2 (p = 0.0002) subunits. The amount of synaptic α1 (p = 0.0019), α4 (p = 0.0028), and γ2 (p = 0.0007) subunits also increased (D), while extrasynaptic α1 (p = 0.0034) and α4 (p = 0.0010) subunits were decreased and gephyrin (p = 0.0040) was increased (F) (*p ≤ 0.05, **p < 0.01, ***p < 0.001, Student’s t-test; n = 5–10 mice per treatment; error bars ± S.E.M.).
Fig. 3.
Fig. 3.
γ2 containing GABAA receptor composition is unchanged and tonic inhibition is reduced in DZP mice. (A) Immunoprecipitation of γ2-GABAAR from seven-day Veh- or DZP-treated mouse cortex was analyzed by DIA mass spectrometry to assess changes in receptor subunit composition (n = 4 mice per treatment group). The intensity of α1–5 subunit-specific peptides are shown. Inset: Relative abundance (%) of α and β subunits associated with γ2 after seven-day DZP treatment. (B,C) (B) Left: representative traces with mIPSCs from seven-day DZP-treated animals before (dark red) and after (gray) 300 nM Ro 15–4513 application. Right: averaged mIPSCs before and after Ro 15–4513. (C) Quantification shows inverse agonist activity of Ro 15–4513, consistent with predominant receptors composed of γ2 with α1, α2, α3, α5-GABAAR subunits (n = 5 cells; amplitude, p = 0.0191; frequency, p = 0.0179; tau, p = 0.0026). (D) GABAAR-mediated tonic current was measured in acute cortical slices from mice treated i.p. once daily for seven days with Veh or DZP. Picrotoxin-sensitive changes in holding current (Vhold = −70 mV) were used to measure tonic inhibition in cortical slices from seven-day Veh- or DZP-treated mice. (E) Quantification revealed that GABAAR-mediated tonic current was significantly reduced (p = 0.0084) in DZP-treated mice (n = 8) relative to Veh-treated mice (n = 6). (E: **p ≤ 0.01, Student’s t-test; C: *p ≤ 0.05, **p ≤ 0.01, paired t-test; error bars ± S.E.M.).
Fig. 4.
Fig. 4.
Enhanced protein expression, synaptic levels and functional activity of excitatory NMDARs was observed following seven-day DZP treatment in vivo. Total (A,B) and synaptic (C,D) levels of cortical NMDAR subunit expression were assessed by western blot analysis in mice treated i.p. once daily for seven days with Veh or DZP. Representative blots show five mice from each treatment (A,C). Quantification revealed a significant increase in the overall levels of the GluN2A (p = 0.0489) and GluN2B subunits (p = 0.0033) (B). GluN2A synaptic levels were also found to be significantly enhanced (p = 0.0110) after DZP exposure (D) (n = 7–10 mice per treatment). (E) Representative mEPSC traces recorded from acute cortical slices of mice treated i.p. once daily for seven days with Veh (black) or DZP (red) (Vhold = −70 mV). (F) mEPSC amplitude, frequency and decay were unchanged after seven days of DZP treatment (n = 6). (G) Representative evoked EPSC traces (Vhold = +40 mV). (H) The AMPA/NMDA ratio was significantly lower (p = 0.0357) in DZP-treated (n = 7) compared to Veh-treated mice (n = 8) (*p ≤ 0.05, **p ≤ 0.01, Student’s t-test; error bars ± S. E.M.).
Fig. 5.
Fig. 5.
SRM and TMT quantitative proteomics reveals enhancement of key kinases involved in synaptic receptor signaling and long-term potentiation pathways following DZP treatment. (A, B) Volcano plot of DZP-Veh differences by quantitative mass spectrometry for brain cortical homogenate peptide levels with charts of the −log10(p-value) vs log2 fold change of DZP/Vehicle. (A) SRM proteomics and (B) TMT proteomics. (C) DZP/Veh ratio for shared key proteins identified by both methods as significantly changed included CaMKII subunits α/β/δ, PKCγ, Dlgap2, Rab3A, Mapk3, Nsf, and Vglut1. N = 10 mice per treatment group for both SRM and TMT proteomic analyses.
Fig. 6.
Fig. 6.
Bioinformatics analysis of DZP treatment-induced cortical changes. (A) Canonical pathway analysis using Ingenuity Pathway Analysis (IPA) identified predicted enriched activated pathways within SRM and TMT proteomic data from DZP vs Veh treated mice. Left chart shows pathway z-score status, while right chart shows −log10(p-values), of the most significantly enriched pathways shared between SRM (black bar) and TMT (hatched bar) analyses. A positive z-score predicts pathway upregulation, while a negative z-score predicts pathway inhibition. An absolute z-score ≥ 2 or a −log10(p-value) ≥ 1.3 as calculated by Fisher’s exact test is considered significantly activated or enriched (dashed lines in left and right charts, respectively). (B) IPA Diseases and Functions analysis using proteins which were found to be increased or decreased with a p < 0.05 predicted significant activation of long-term potentiation (LTP) (z-score = 2.428, SRM; 3.063, TMT). Red-hued icon = increased measurement; green-hued icon = decreased measurement; orange dashed line = activation of pathway; yellow dashed line = findings inconsistent with state of downstream molecule; gray dashed line = effect not predicted.

Similar articles

Cited by

References

    1. Abramian AM, et al., 2010. Protein kinase C phosphorylation regulates membrane insertion of GABAA receptor subtypes that mediate tonic inhibition. J. Biol. Chem 285, 41795–41805. 10.1074/jbc.M110.149229. - DOI - PMC - PubMed
    1. Abramian AM, et al., 2014. Neurosteroids promote phosphorylation and membrane insertion of extrasynaptic GABAA receptors. Proc. Natl. Acad. Sci. U. S. A 111, 7132–7137. 10.1073/pnas.1403285111. - DOI - PMC - PubMed
    1. Bachhuber MA, et al., 2016. Increasing benzodiazepine prescriptions and overdose mortality in the United States, 1996–2013. Am. J. Public Health 106, 686–688. 10.2105/AJPH.2016.303061. - DOI - PMC - PubMed
    1. Barrera NP, Robinson CV, 2011. Advances in the mass spectrometry of membrane proteins: from individual proteins to intact complexes. Annu. Rev. Biochem 80, 247–271. 10.1146/annurev-biochem-062309-093307. - DOI - PubMed
    1. Bateson AN, 2002. Basic pharmacologic mechanisms involved in benzodiazepine tolerance and withdrawal. Curr. Pharm. Des 8, 5–21. 10.2174/1381612023396681. - DOI - PubMed

Publication types