. 2023 Jul 1;37(13-14):605-620.
doi: 10.1101/gad.350418.123. Epub 2023 Aug 3.

RUNX1 is required in granulocyte-monocyte progenitors to attenuate inflammatory cytokine production by neutrophils

Affiliations

RUNX1 is required in granulocyte-monocyte progenitors to attenuate inflammatory cytokine production by neutrophils

Alexandra U Zezulin et al. Genes Dev. .

Abstract

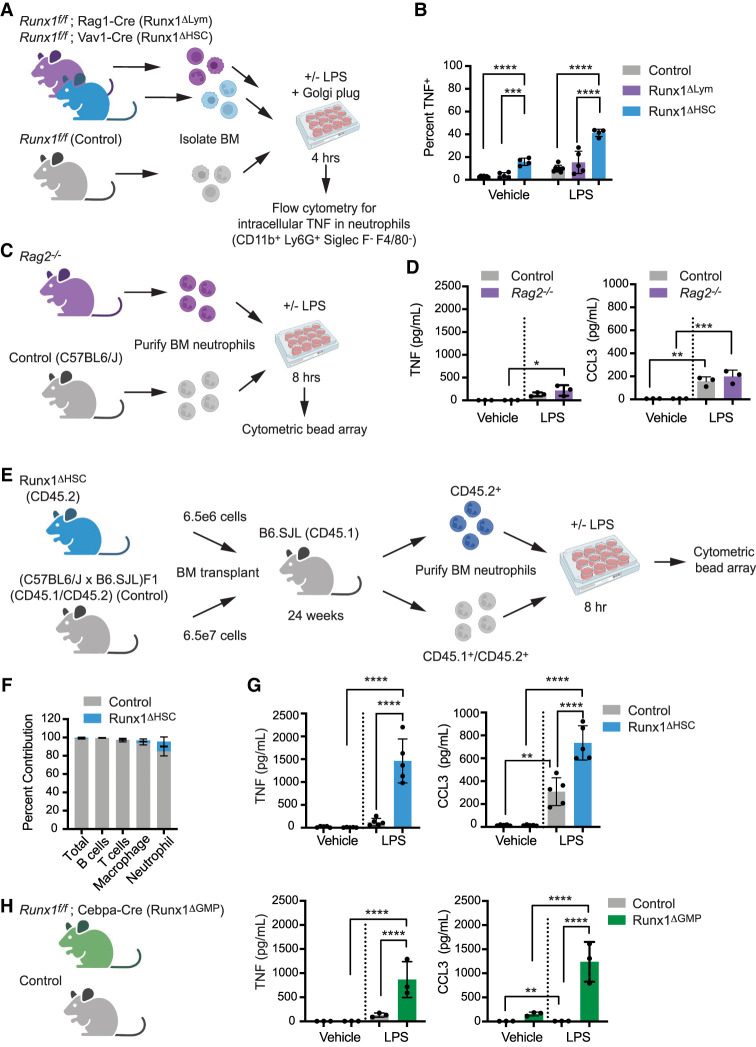
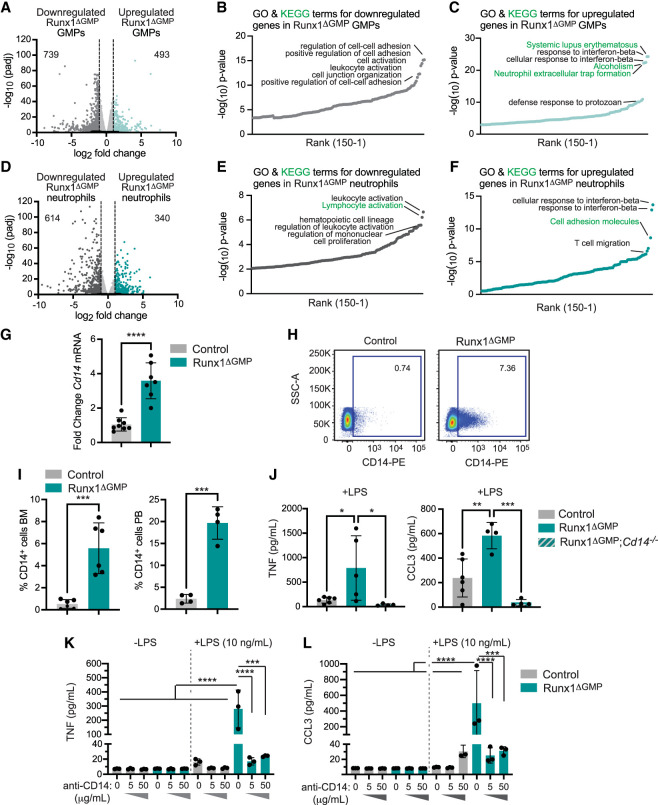
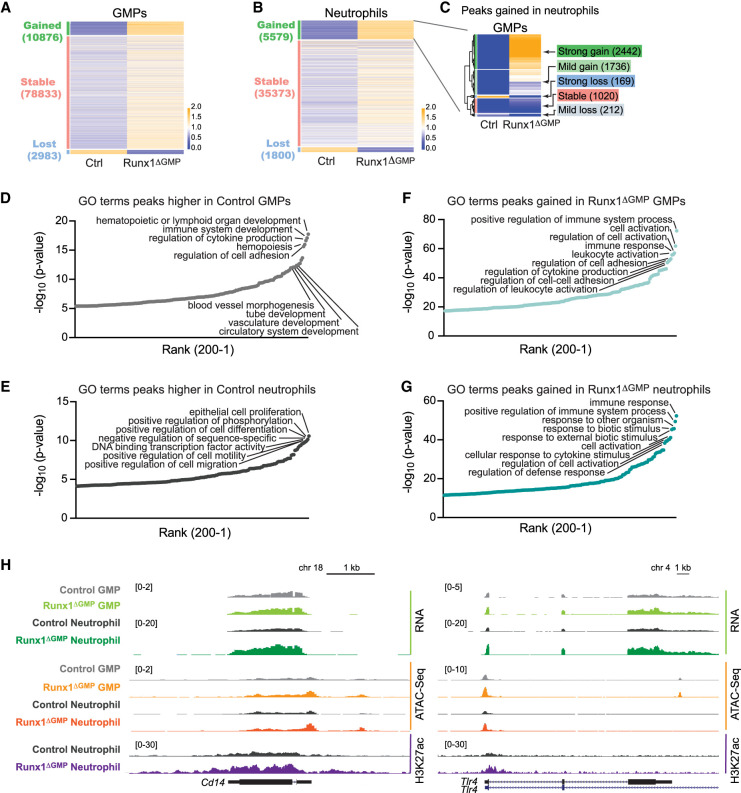
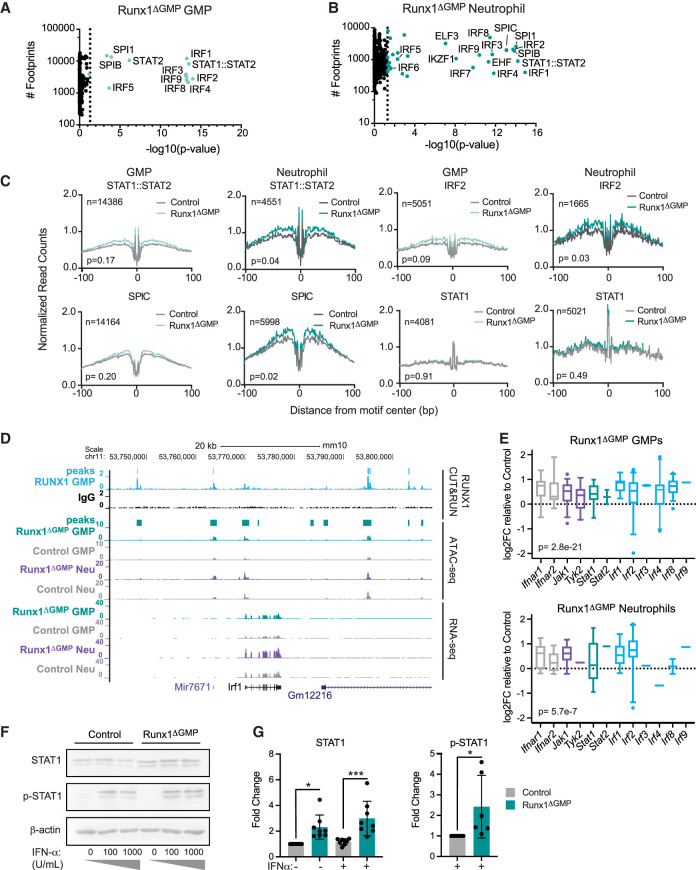
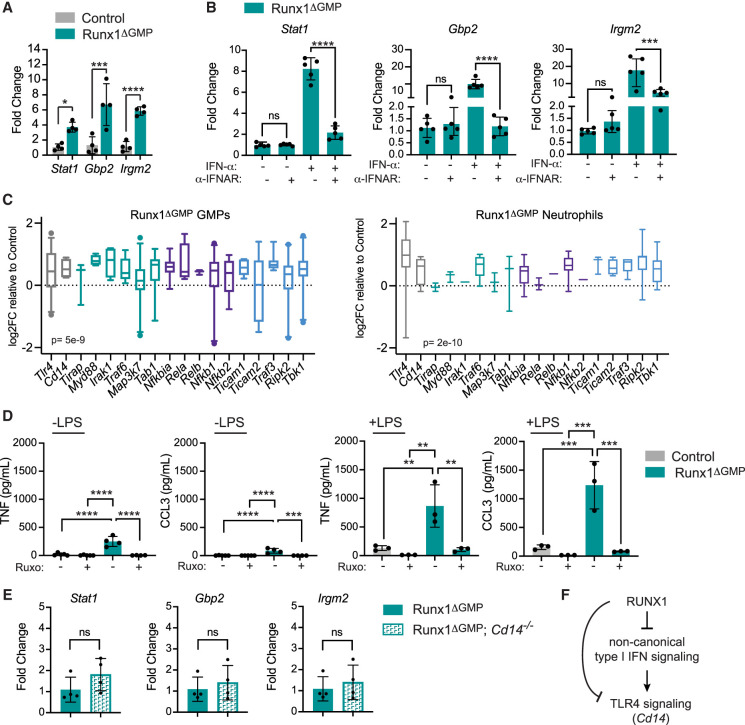
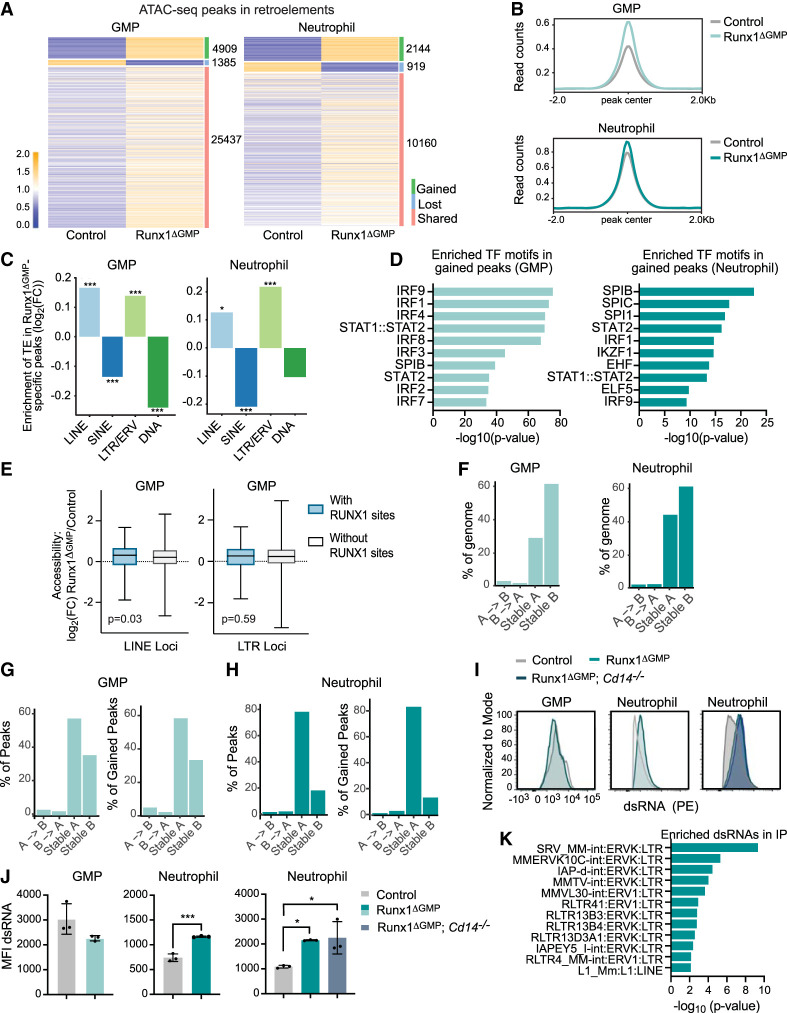
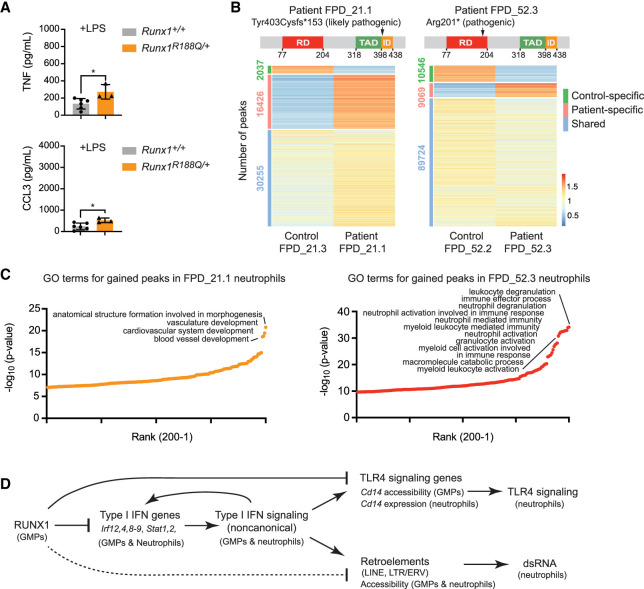
The transcription factor RUNX1 is mutated in familial platelet disorder with associated myeloid malignancy (FPDMM) and in sporadic myelodysplastic syndrome and leukemia. RUNX1 was shown to regulate inflammation in multiple cell types. Here we show that RUNX1 is required in granulocyte-monocyte progenitors (GMPs) to epigenetically repress two inflammatory signaling pathways in neutrophils: Toll-like receptor 4 (TLR4) and type I interferon (IFN) signaling. RUNX1 loss in GMPs augments neutrophils' inflammatory response to the TLR4 ligand lipopolysaccharide through increased expression of the TLR4 coreceptor CD14. RUNX1 binds Cd14 and other genes encoding proteins in the TLR4 and type I IFN signaling pathways whose chromatin accessibility increases when RUNX1 is deleted. Transcription factor footprints for the effectors of type I IFN signaling-the signal transducer and activator of transcription (STAT1::STAT2) and interferon regulatory factors (IRFs)-were enriched in chromatin that gained accessibility in both GMPs and neutrophils when RUNX1 was lost. STAT1::STAT2 and IRF motifs were also enriched in the chromatin of retrotransposons that were derepressed in RUNX1-deficient GMPs and neutrophils. We conclude that a major direct effect of RUNX1 loss in GMPs is the derepression of type I IFN and TLR4 signaling, resulting in a state of fixed maladaptive innate immunity.

Keywords: RUNX1; hematopoiesis; inflammation; retroelements; transposable elements.


Figures

Figure 1.
Figure 1.
RUNX1 function in GMPs is necessary to restrict inflammatory cytokine production by neutrophils. (A) Schematic depicting an experiment to compare the effect of panhematopoietic (Runx1ΔHSC) versus lymphocyte-specific (Runx1ΔLym) RUNX1 loss on inflammatory cytokine production by neutrophils. BM cells were stimulated for 4 h ex vivo with vehicle or 100 ng/mL LPS. The percentage of neutrophils that were TNF+ was determined by flow cytometry. (B) Percentage of Runx1ΔHSC, Runx1ΔLym, and control BM neutrophils that were TNF+. Mean ± SD, one-way ANOVA, Tukey's multiple comparison test. Representative of three experiments. (C) Schematic depicting an experiment to examine the inflammatory phenotype of neutrophils from Rag2/ mice. (D) Absolute quantification by CBA of inflammatory factors in the supernatant of neutrophils from control and Rag2/ mice stimulated for 8 h with vehicle or 100 ng/mL LPS. Mean ± SD, one-way ANOVA plus Tukey's multiple comparison test. Representative of two experiments. (E) Schematic representation of the experimental design for generating BM chimeras by transplanting Runx1ΔHSC BM cells and a 10-fold excess of control BM cells into irradiated B6.SJL mice. Neutrophils derived from transplanted Runx1ΔHSC and control BM were purified by FACS 24 wk posttransplant and analyzed as in C and D. (F) Percentage of total BM cells, B cells (CD19+), T cells (CD3+), granulocytes (Gr1+CD11b+), and macrophages (CD11b+Gr1) derived from Runx1ΔHSC versus control BM in transplant recipient mice. (G) Representative experiment of absolute quantification by CBA of inflammatory factors in the supernatant of control and Runx1ΔHSC neutrophils purified from transplant recipients and stimulated for 8 h with vehicle or 100 ng/mL LPS. Mean ± SD, one-way ANOVA plus Tukey's multiple comparison test. Representative of two experiments. (H) Absolute quantification by CBA of inflammatory factors in the supernatant of BM neutrophils from control or Runx1ΔGMP mice, analyzed as described in C. Mean ± SD, one-way ANOVA plus Tukey's multiple comparison test. Representative of nine experiments. For all experiments, (*) P ≤ 0.05, (**) P ≤ 0.01, (***) P ≤ 0.001, (****) P ≤ 0.0001.
Figure 2.
Figure 2.
RUNX1 loss results in elevated levels of key TLR4 signaling molecules. (A) Volcano plot depicting global transcriptional changes between control and Runx1ΔGMP GMPs. Up-regulated genes with an adjusted P-value of <0.05 and a log2 fold change >1 are indicated by teal dots, and down-regulated genes with a log2 fold change less than −1 are indicated by dark-gray dots. The numbers of significantly up-regulated or down-regulated genes are indicated. (B) Top 150 enriched gene ontology (GO) (black text) and Kyoto Encyclopedia of Genes and Genomes (KEGG) pathway (green text) terms for genes down-regulated in Runx1ΔGMP GMPs. Enrichment of GO and KEGG terms was tested using Fisher's exact test (GeneSCF v1.1-p2). (C) Top 150 enriched GO and KEGG pathway terms for genes up-regulated in Runx1ΔGMP GMPs. (D) Volcano plot depicting global transcriptional changes between control and Runx1ΔGMP neutrophils. (E) Top 150 enriched GO and KEGG terms for genes down-regulated in Runx1ΔGMP neutrophils. (F) GO and KEGG terms for genes up-regulated in Runx1ΔGMP neutrophils. (G) RT-qPCR for Cd14 in Runx1ΔGMP neutrophils. Mean ± SD, unpaired, two-tailed Student's t-test. (H) Representative scatter plots of CD14 expression on BM neutrophils from control and Runx1ΔGMP mice. (I) Quantification of the percentage of CD14+ neutrophils in the BM (left) and PB (right) of control and Runx1ΔGMP mice. Mean ± SD, unpaired, two-tailed Student's t-test. Representative of 11 experiments, and a total of 32 mice were analyzed. (J) Absolute quantification by CBA demonstrating that deletion of Cd14 reduces TNF and CCL3 production by control and Runx1ΔGMP neutrophils in response to 10 ng/mL LPS. Mean ± SD, one-way ANOVA plus Tukey's multiple comparison test. Representative of two experiments, and a total of 24 mice were analyzed. (K) Absolute quantification by CBA demonstrating the effect of CD14-blocking antibody on TNF production by purified BM-derived neutrophils stimulated for 8 h with vehicle or a low dose of LPS (10 ng/mL). Mean ± SD, one-way ANOVA plus Tukey's multiple comparison test. Representative of two experiments and a total of eight mice were analyzed. (L) Effect of CD14-blocking antibody on CCL3 production by purified neutrophils stimulated for 8 h with vehicle or a low dose of LPS, as in K. For all panels, (*) P ≤ 0.05, (**) P ≤ 0.01, (***) P ≤ 0.001, (****) P ≤ 0.0001.
Figure 3.
Figure 3.
Loss of RUNX1 increases the chromatin accessibility of genes involved in innate immune responses in GMPs and neutrophils. (A) Heat map of ATAC-seq signals for control (Ctrl) and Runx1ΔGMP GMPs. Peaks are categorized as gained, lost (in Runx1ΔGMP GMPs), or stable (RPKM fold change <2). The color represents the relative RPKM and the mean RPKM of control and Runx1ΔGMP cells. (B) Heat map of ATAC-seq signals in control and Runx1ΔGMP neutrophils. (C) Heat map of ATAC-seq signal in control and Runx1ΔGMP GMPs for peaks gained in Runx1ΔGMP neutrophils. The peaks were clustered hierarchically and then segregated into five groups using the cutree function in R. (D) Enriched GO biological terms for peaks higher in control GMPs (i.e., peaks lost in Runx1ΔGMP GMPs). The top 200 GO biological terms are plotted. (E) Enriched GO biological terms for peaks higher in control neutrophils (i.e., peaks lost in Runx1ΔGMP neutrophils). (F) Enriched GO biological terms for peaks gained in Runx1ΔGMP GMPs. (G) Enriched GO biological terms for peaks gained in Runx1ΔGMP neutrophils. (H) Genome browser view showing normalized RNA-seq, ATAC-seq, and H3K27ac signals for the Tlr4 and Cd14 genes in control and Runx1ΔGMP GMPs and neutrophils.
Figure 4.
Figure 4.
Chromatin opened following RUNX1 loss is enriched for footprints of TF effectors of type I IFN signaling. (A) Scatter plots showing enriched digital TF footprints at regions of chromatin with increased accessibility in Runx1ΔGMP GMPs relative to controls. The number of footprints for each TF at regions of chromatin with increased accessibility is displayed on the Y-axis for the Runx1ΔGMPcells. Colored circles indicate P < 0.05; P-value was calculated using biFET. (B) Scatter plots showing enriched digital TF footprints at regions of chromatin with increased accessibility in Runx1ΔGMP neutrophils relative to controls as in A. (C) Footprint profile plots for selected TFs showing average normalized read counts and P-values calculated by HINT-differential (Li et al. 2019) using all peaks in control and Runx1ΔGMP cells. (D) Genome browser view showing RUNX1 occupancy determined by CUT&RUN, normalized ATAC-seq, and RNA-seq for the Irf1 gene in control and Runx1ΔGMP GMPs and neutrophils. Merged peaks for RUNX1 and ATAC-seq are indicated above the tracks for GMPs. (E) Box and whisker plots of log2FC in ATAC-seq signal relative to control for type I IFN pathway genes in Runx1ΔGMP GMPs and neutrophils. Whiskers represent the fifth to 95th percentile. (F) Western blot for STAT1 and phosphorylated (p) STAT1 plus β-actin control in control and Runx1ΔGMP neutrophils in the presence or absence of IFN-α. (G) Summary of Western blots in F. Mean ± SD. Dots indicate lanes quantified using ImageJ. ANOVA plus Tukey's multiple comparison test for STAT1; two-tailed, unpaired t-test for p-STAT1. Representative of eight experiments, and a total of 16 mice were analyzed. (*) P ≤ 0.05, (***) P ≤ 0.001.
Figure 5.
Figure 5.
RUNX1 restrains tonic type I IFN signaling. (A) RT-qPCR demonstrating baseline expression of three IGSs in control and Runx1ΔGMP neutrophils. Mean ± SD, two-tailed, unpaired t-test. Representative of two experiments, and total of eight mice were analyzed. (B) A blocking antibody against the type I IFN receptor (α-IFNAR) reduces type I IFN signaling through the canonical pathway (+IFN-α) but not tonic signaling through a noncanonical pathway (−IFN-α), as measured by the expression of ISGs by RT-qPCR. All data are from Runx1ΔGMP neutrophils. Representative of two experiments, and total of 12 mice were analyzed. Mean ± SD, ANOVA plus Tukey's multiple comparison test. (C) Box and whisker plots of log2FC in ATAC-seq signal relative to control for TLR4 pathway genes in Runx1ΔGMP GMPs and neutrophils. Whiskers represent the fifth to 95th percentile. ATAC-seq peaks were assigned to genes by genomic region enrichment of annotations tool (GREAT) (McLean et al. 2010). (D) Ruxolitinib (20 μM) decreases the production of TNF and CCL3 by neutrophils in response to LPS. Representative of two experiments, and total of 15 mice were analyzed. Mean ± SD, ANOVA plus Tukey's multiple comparison test. For all figures, (*) P ≤ 0.05, (**) P ≤ 0.01, (***) P ≤ 0.001, (****) P ≤ 0.0001, (ns) not significant. (E) The type I IFN signature is not caused by elevated levels of the TLR4 coreceptor CD14. RT-qPCR demonstrating baseline expression of three IGSs in Runx1ΔGMP and Runx1ΔGMP;Cd14/ neutrophils. Representative of two experiments, and total of 14 mice were analyzed. Mean ± SD, two-tailed, unpaired t-test. (F) Schematic diagram to summarize the relationship between RUNX1, type I interferon, and TLR4 signaling.
Figure 6.
Figure 6.
Loss of RUNX1 in GMPs derepresses TEs. (A) Heat maps of ATAC-seq peaks in TEs in GMPs and neutrophils. The number of gained, lost, and shared peaks is listed at the right of each heat map. (B) Averaged ATAC-seq peak profile plots (normalized to bins per million mapped reads [BPM]) in TEs in control and Runx1ΔGMP neutrophils and GMPs. (C) Enrichment or depletion of the different classes of TEs (LINEs, SINEs, LTRs/ERVs, or DNA) in gained ATAC-seq peaks in Runx1ΔGMP neutrophils and GMPs. The Y-axis represents the log2 fold change of the number of Runx1ΔGMP-specific peaks overlapping with TEs over the median number of the randomly selected peaks overlapping with TEs. Positive log2 fold change = enrichment, and negative log2 fold change = depletion. (D) Top 10 TF binding motifs enriched in Runx1ΔGMP neutrophil-specific or Runx1ΔGMP GMP-specific ATAC–seq peaks that overlapped with TEs. (E) Box and whisker plots of log2FC in ATAC-seq signal relative to control for LINE or LTR loci with and without RUNX1 binding sites in control GMPs. (F) Genome-wide redistribution of chromatin compartments A and B in Runx1ΔGMP GMPs (left panel) and neutrophils (right panel) from control. (G) Percentage of all (left panel) and gained (right panel) ATAC-seq peaks in chromatin compartments A/B of GMPs. (H) Percentage of all (left panel) and gained (right panel) ATAC-seq peaks in chromatin compartments A/B of neutrophils. (I) Representative histograms for the mean fluorescence intensities (MFI) of dsRNA in the dsRNA+ neutrophils or GMPs. (J) Quantification of the relative MFI of dsRNA in the dsRNA+ neutrophils or GMPs. Statistics represent two-tailed unpaired Student's t-tests. Representative of two experiments, and total of 12 mice were analyzed. (*) P ≤ 0.05, (***) P ≤ 0.001. (K) IP of dsRNA with the 9D5 antibody followed by RNA-seq in Runx1ΔGMP and control neutrophils. Graph shows the dsRNA species detected and enriched in the IP from Runx1ΔGMP neutrophils over control neutrophils.
Figure 7.
Figure 7.
Haploinsufficiency of RUNX1 may alter the properties of mouse and human neutrophils. (A) Absolute quantification by CBA of TNF and CCL3 in the supernatant of FACS-purified BM neutrophils from wild-type or Runx1R188Q/+ mice stimulated with 10 ng/mL LPS. Mean ± SD, two-tailed, unpaired t-test. Representative of two experiments, and a total of nine mice were analyzed. (*) P ≤ 0.05. (B, top) Schematic diagram showing the location of mutations in the RUNX1 protein in patients FPD_21.1 and FPD_52.3. ClinGen classifications of the mutations are indicated. (RD) DNA-binding RUNT domain, (TAD) transactivation domain, (ID) inhibitory domain as defined in functional assays (Kagoshima et al. 1993; Kanno et al. 1998). (Bottom) Heat maps of ATAC-seq signals for the two FPDMM patients and nonaffected family members (control). (C) Enriched GO terms for patient-specific peaks. The top 200 GO terms are plotted. (D) Model of the inflammatory regulatory network in GMPs and neutrophils directly and indirectly regulated by RUNX1. The dotted line indicates that the regulation of retroelement chromatin accessibility by RUNX1 may be primarily indirect.

Update of

References

    1. Bekkering S, Domínguez-Andrés J, Joosten LAB, Riksen NP, Netea MG. 2021. Trained immunity: reprogramming innate immunity in health and disease. Annu Rev Immunol 39: 667–693. 10.1146/annurev-immunol-102119-073855 - DOI - PubMed
    1. Bellissimo DC, Speck NA. 2017. RUNX1 mutations in inherited and sporadic leukemia. Front Cell Dev Biol 5: 111. 10.3389/fcell.2017.00111 - DOI - PMC - PubMed
    1. Bellissimo DC, Chen CH, Zhu Q, Bagga S, Lee CT, He B, Wertheim GB, Jordan M, Tan K, Worthen GS, et al. 2020. Runx1 negatively regulates inflammatory cytokine production by neutrophils in response to Toll-like receptor signaling. Blood Adv 4: 1145–1158. 10.1182/bloodadvances.2019000785 - DOI - PMC - PubMed
    1. Brown AL, Arts P, Carmichael CL, Babic M, Dobbins J, Chong CE, Schreiber AW, Feng J, Phillips K, Wang PPS, et al. 2020. RUNX1-mutated families show phenotype heterogeneity and a somatic mutation profile unique to germline predisposed AML. Blood Adv 4: 1131–1144. 10.1182/bloodadvances.2019000901 - DOI - PMC - PubMed
    1. Chen YG, Hur S. 2022. Cellular origins of dsRNA, their recognition and consequences. Nat Rev Mol Cell Biol 23: 286–301. 10.1038/s41580-021-00430-1 - DOI - PMC - PubMed

Publication types

MeSH terms