. 2023 Aug 3;14(1):4417.
doi: 10.1038/s41467-023-40094-3.

Single-cell transcriptomics of human cholesteatoma identifies an activin A-producing osteoclastogenic fibroblast subset inducing bone destruction

Affiliations

Single-cell transcriptomics of human cholesteatoma identifies an activin A-producing osteoclastogenic fibroblast subset inducing bone destruction

Kotaro Shimizu et al. Nat Commun. .

Abstract

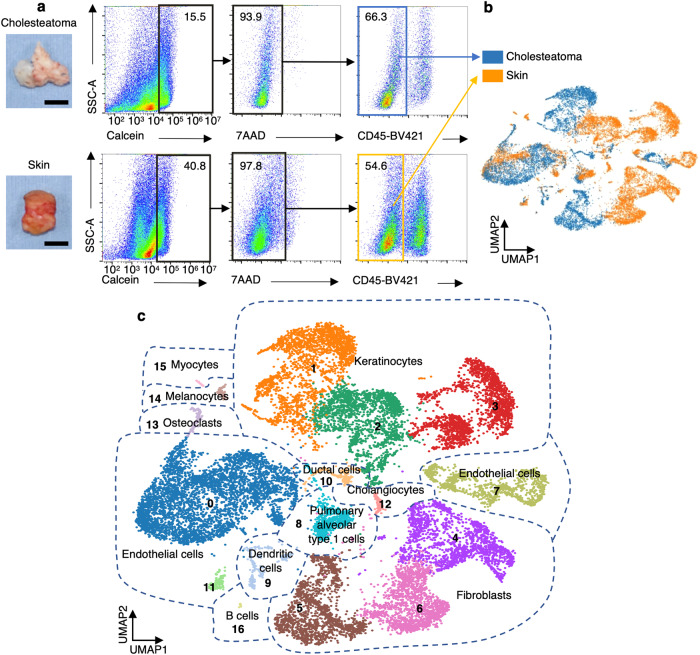
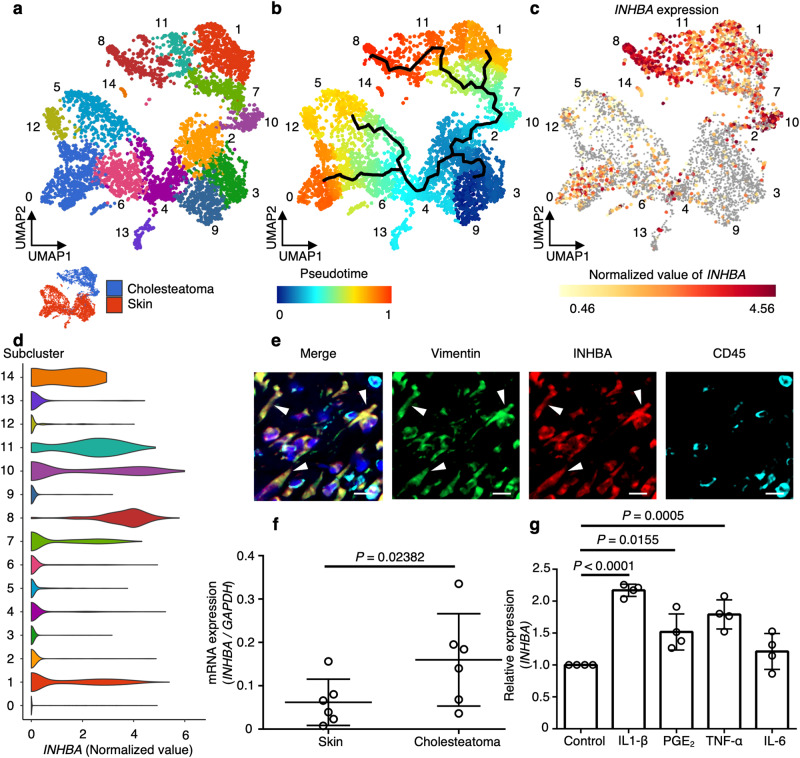
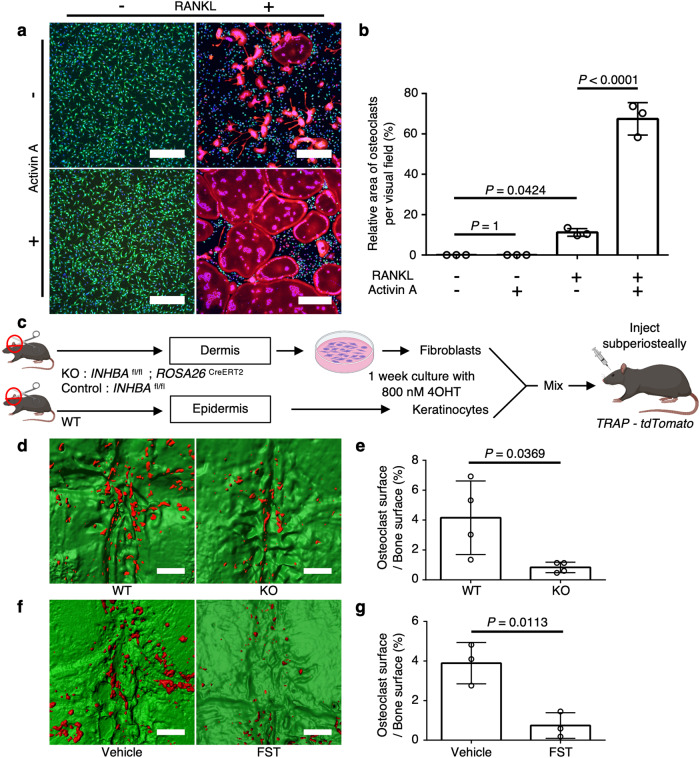
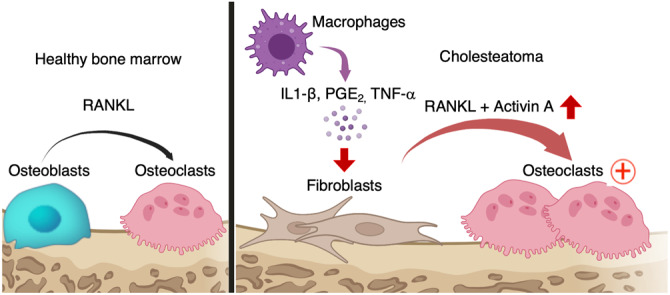
Cholesteatoma, which potentially results from tympanic membrane retraction, is characterized by intractable local bone erosion and subsequent hearing loss and brain abscess formation. However, the pathophysiological mechanisms underlying bone destruction remain elusive. Here, we performed a single-cell RNA sequencing analysis on human cholesteatoma samples and identify a pathogenic fibroblast subset characterized by abundant expression of inhibin βA. We demonstrate that activin A, a homodimer of inhibin βA, promotes osteoclast differentiation. Furthermore, the deletion of inhibin βA /activin A in these fibroblasts results in decreased osteoclast differentiation in a murine model of cholesteatoma. Moreover, follistatin, an antagonist of activin A, reduces osteoclastogenesis and resultant bone erosion in cholesteatoma. Collectively, these findings indicate that unique activin A-producing fibroblasts present in human cholesteatoma tissues are accountable for bone destruction via the induction of local osteoclastogenesis, suggesting a potential therapeutic target.


Conflict of interest statement

The authors declare no competing interests.

Figures

Fig. 1
Fig. 1. scRNA-seq analysis of human cholesteatoma and skin specimens.
a Representative gating strategies used in cholesteatoma and skin samples. Live (calcein+ AAD) CD45 cells. Scale bars: 5 mm. b UMAP plot of scRNA-seq data from 19,273 cells labeled by sample condition. Samples were obtained from three pairs of cholesteatoma and control skin samples labeled according to sample condition. c UMAP plot of scRNA-seq data labeled according to cell type identified in PanglaoDB. The main cell types were keratinocytes, fibroblasts, and endothelial cells.
Fig. 2
Fig. 2. Identification of cholesteatoma fibroblasts and INHBA upregulation in cholesteatoma fibroblasts.
a The proportions of sample conditions in each cluster identified by scRNA-seq. The proportion of cholesteatoma varied among clusters. Clusters consisting of cholesteatoma alone were considered cholesteatoma-specific clusters. b Proportion of patients in each cluster identified by scRNA-seq. The proportion of patients varied among clusters. Clusters consisting of one patient were considered clusters with large sample biases. c Genes upregulated in cholesteatoma fibroblasts compared to control fibroblasts. Genes with top 10 z-scores are shown in order of fold change. d INHBA upregulation in cholesteatoma fibroblast clusters.
Fig. 3
Fig. 3. Subclustering and pseudotime analysis of cholesteatoma fibroblasts and confirmation of INHBA expression in human cholesteatoma.
a Subclustering analysis of fibroblasts. Populations shown at the upper right are cholesteatoma fibroblasts. Populations shown at the lower left are skin fibroblasts. Cholesteatoma fibroblasts are labeled blue, and skin fibroblasts are labeled red at the lower left. Cholesteatoma fibroblasts were associated with five subclusters labeled 1, 7, 8, 10, and 11. b Trajectory mapping performed using Monocle 3. Undifferentiated and differentiated cells are labeled blue and red, respectively. The most differentiated cells were observed in cholesteatoma (labeled red). The differentiated cells were identical to cholesteatoma fibroblasts in subcluster 8. c INHBA expression in fibroblasts in UMAP. Cholesteatoma fibroblasts showed high levels of INHBA expression. The area of high INHBA expression was identical to the area in cholesteatoma fibroblasts in subcluster 8. d Violin plots of INHBA expression in each cluster. Subcluster 8 shows a high INHBA normalized value. e Immunofluorescence staining of cholesteatoma perimatrix. Colocalization of vimentin and INHBA immunofluorescence showed that fibroblasts in the perimatrix expressed INHBA. CD45 was not colocalized with activin A. Leukocytes exhibited no activin A expression. INHBA was labeled with Alexa Fluor 568, vimentin was labeled with Alexa Fluor 488, and CD45 was labeled with Alexa Fluor 647. Scale bars: 10 µm. f INHBA mRNA expression level, corrected for GAPDH mRNA expression, was significantly higher in cholesteatoma fibroblasts than in control skin fibroblasts (n = 6). Data represent means ± SDs. g IL-1β, PGE2, and TNF-α promoted INHBA expression in human primary skin fibroblasts. IL-6 did not promote INHBA expression in ear pinna-derived fibroblasts (n = 4). The exact p-value between the control and IL-1β is 0.0000003. Data represent means ± SDs. Statistical significance was determined using the ratio paired two-tailed t-test (f) and two-tailed unpaired t-test (g). Source data are provided as a Source Data file.
Fig. 4
Fig. 4. Functional analysis of activin A in vitro and in vivo.
a Representative images of osteoclast differentiation in vitro. Bone marrow macrophages derived from CX3CR1-EGFP/TRAP-tdTomato mice were cultured with 10 ng mL−1 M-CSF. RANKL (50 ng mL−1) and activin A (5 ng mL−1) were added either alone or in combination. Green: CX3CR1-EGFP+ cells; red: TRAP-tdTomato+ cells; blue: nuclei. Scale bars: 300 µm. b Quantification of TRAP-positive area within the visual field (n = 3 per group). Data represent means ± SDs. The exact p-value between RANKL (+) group and RANKL (+) activin A (+) group is 0.0000008. c Schematic representation of the method used to generate a mass lesion composed of ear pinna-derived keratinocytes and fibroblasts. d Representative surface images of TRAP-positive osteoclasts induced on the parietal bone surface. TRAP-positive cells were labeled with tdTomato, and parietal bones were labeled with Alexa Fluor 488. INHBA inhibition in fibroblasts reduced osteoclast formation on the parietal bone surface. Red, TRAP-tdTomato+ cells; green, parietal bone surface. Scale bars: 500 µm. e Quantification of TRAP-positive area on the parietal bone surface under the cholesteatoma mass. WT cholesteatoma model (n = 4), INHBA inhibition in fibroblasts (n = 4). f Representative surface images of TRAP-positive osteoclasts induced on the parietal bone surface. Follistatin (FST) treatment reduced osteoclast formation on the parietal bone surface. Scale bars: 500 µm. g Quantification of TRAP-positive area on the parietal bone surface under the cholesteatoma mass. Vehicle treatment (n = 3), FST treatment (n = 3). Statistical significance was determined by one-way ANOVA with Tukey’s post hoc multiple comparison test (b) and two-tailed unpaired t-test (e, g). Data represent the mean ± SD for each group. Symbols represent individual mice. Source data are provided as a Source Data file.
Fig. 5
Fig. 5. Schematic of osteoclastogenesis induced by cholesteatoma fibroblasts expressing activin A.
IL-1β, PGE2, and TNF-α secreted from infiltrating CD45+ cells, particularly macrophages, induced activin A-expressing pathogenic fibroblasts; the activin A acted in conjunction with RANKL to promote ectopic osteoclastogenesis.

References

    1. Olszewska E, et al. Etiopathogenesis of cholesteatoma. Eur. Arch. Otorhinolaryngol. 2004;261:6–24. doi: 10.1007/s00405-003-0623-x. - DOI - PubMed
    1. Kuo CL, et al. Updates and knowledge gaps in cholesteatoma research. Biomed. Res. Int. 2015;2015:854024. doi: 10.1155/2015/854024. - DOI - PMC - PubMed
    1. Abramson M, Moriyama H, Huang CC. Pathogenic factors in bone resorption in cholesteatoma. Acta Otolaryngol. 1984;97:437–442. doi: 10.3109/00016488409132918. - DOI - PubMed
    1. Imai R, et al. Osteoclasts modulate bone erosion in cholesteatoma via RANKL signaling. J. Assoc. Res. Otolaryngol. 2019;20:449–459. doi: 10.1007/s10162-019-00727-1. - DOI - PMC - PubMed
    1. Iino Y, et al. Organic acids and anaerobic microorganisms in the contents of the cholesteatoma sac. Ann. Otol. Rhinol. Laryngol. 1983;92:91–96. doi: 10.1177/000348948309200122. - DOI - PubMed

Publication types