. 2023 Aug 3;13(1):12584.
doi: 10.1038/s41598-023-38272-w.

Ramifications of POU4F3 variants associated with autosomal dominant hearing loss in various molecular aspects

Affiliations

Ramifications of POU4F3 variants associated with autosomal dominant hearing loss in various molecular aspects

Sang-Yeon Lee et al. Sci Rep. .

Abstract

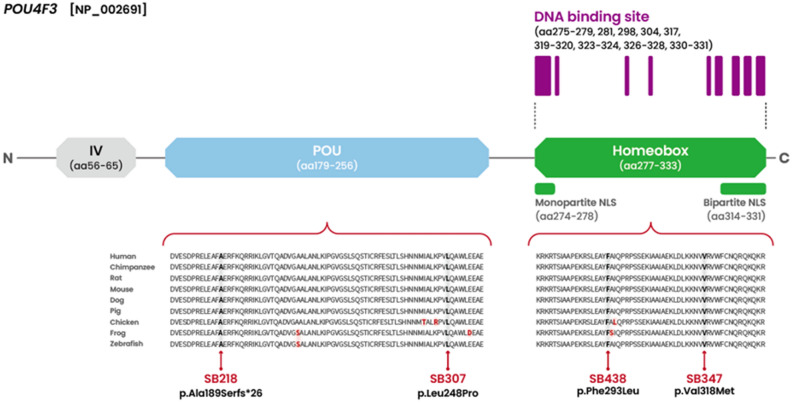
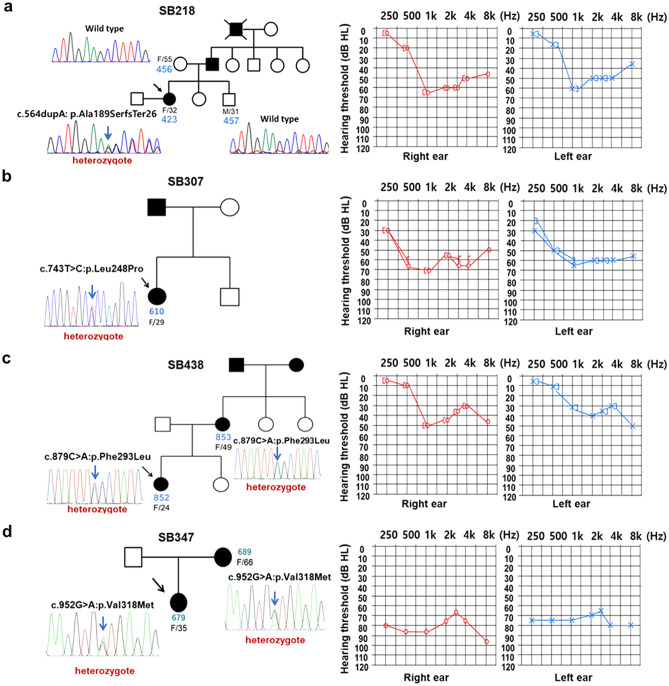
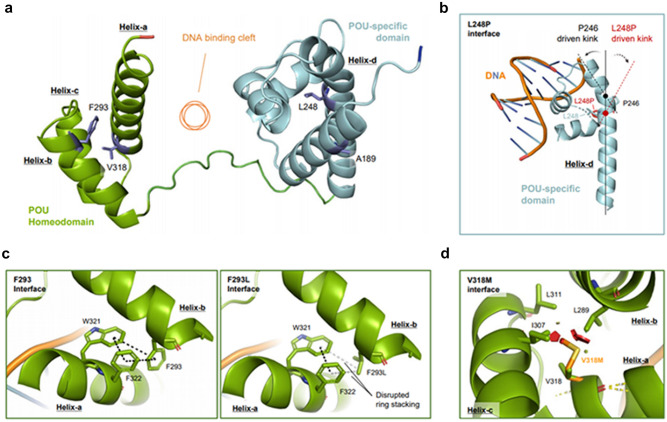
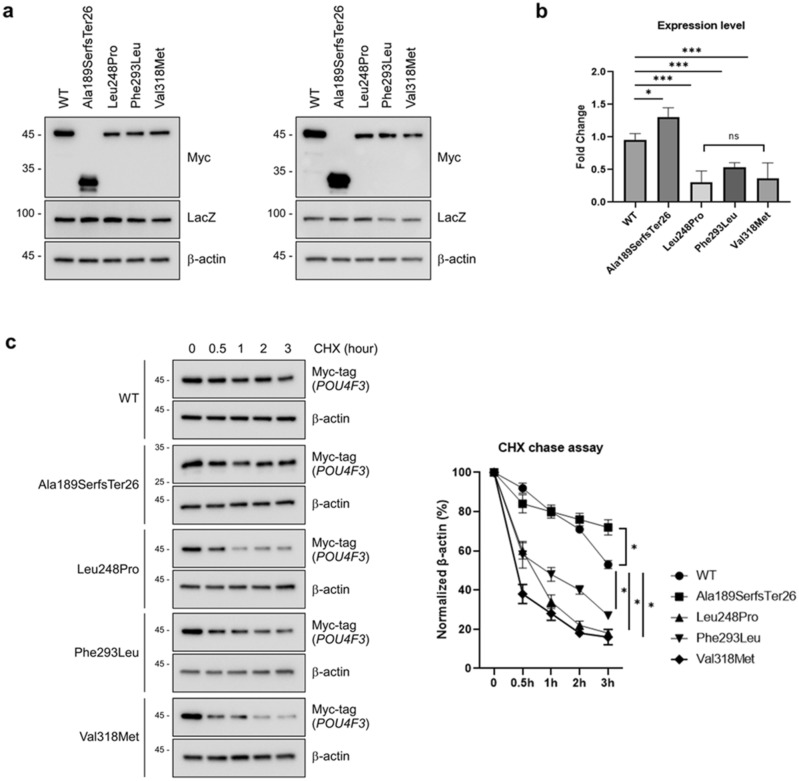
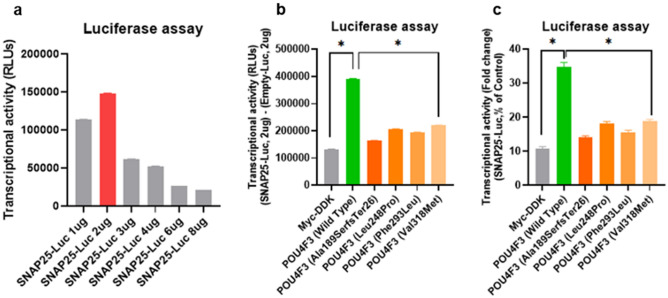
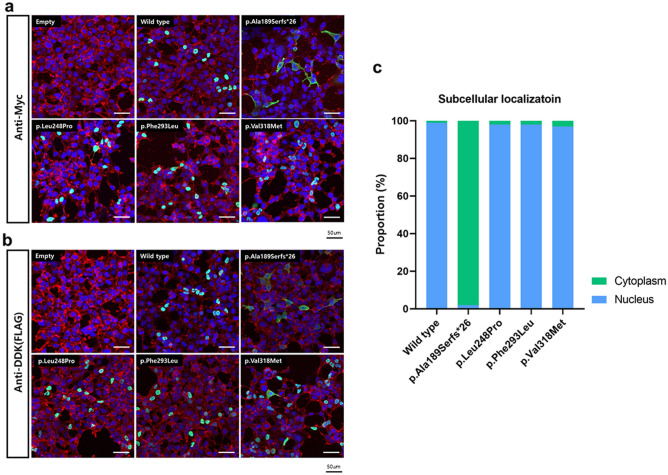
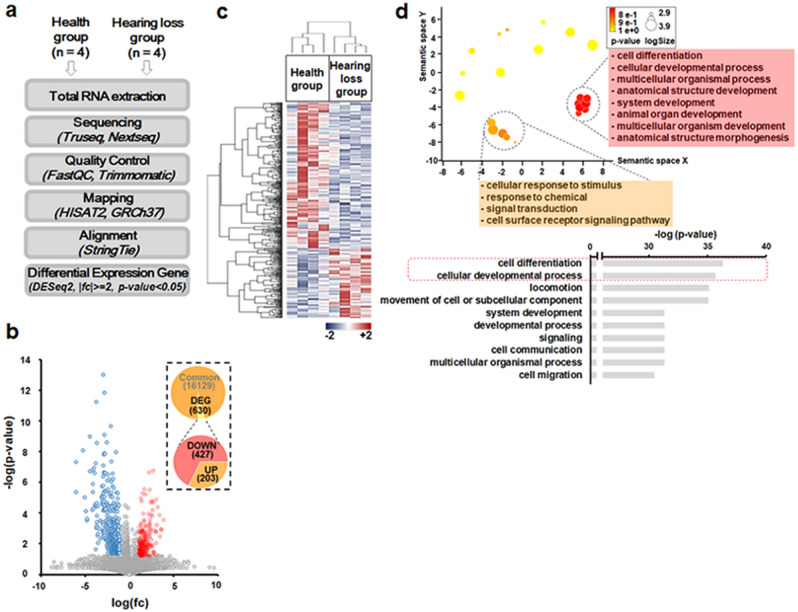
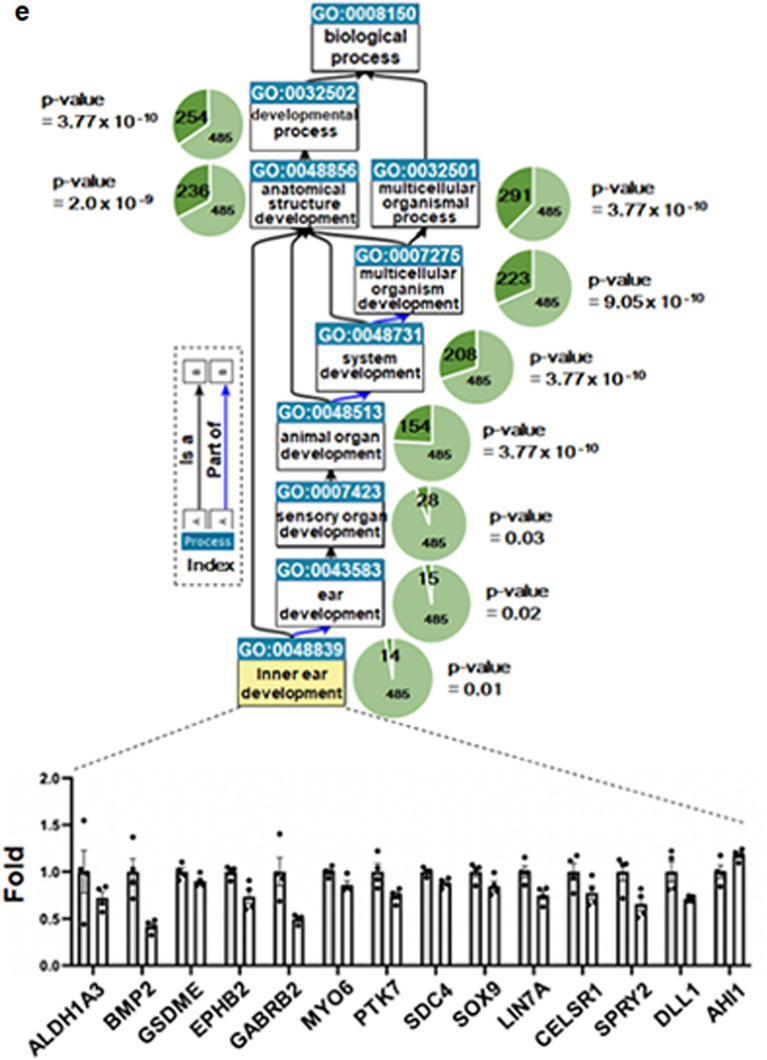
POU4F3, a member of the POU family of transcription factors, commonly causes autosomal dominant deafness. Exome sequencing was used to identify four novel variants in POU4F3 (NM_002700.2), including c.564dupA: p.Ala189SerfsTer26, c.743T > C:p.Leu248Pro, c.879C > A:p.Phe293Leu, and c.952G > A:p.Val318Met, and diverse aspects of the molecular consequences of their protein expression, stability, subcellular localization, and transcriptional activity were investigated. The expression of three mutant proteins, encoded by missense variants, was reduced compared to the wild-type protein, demonstrating that the mutants were unstable and vulnerable to degradation. Additionally, all the mutant proteins had distinct subcellular localization patterns. A mutant protein carrying p.Ala189SerfsTer26, in which both mono- and bi-partite nuclear localization signals were disrupted, showed abnormal subcellular localization. Resultantly, all the mutant proteins significantly reduced the transcriptional activity required to regulate the downstream target gene expression. Furthermore, we identified the altered expression of 14 downstream target genes associated with inner ear development using patient-derived lymphoblastoid cell lines. There was a significant correlation of the expression profile between patient-derived cells and the cochlear hair cells, which provided a breakthrough for cases where the collection of human cochlear samples for transcriptome studies was unfeasible. This study expanded the genotypic spectrum of POU4F3 in DFNA15, and further refined the molecular mechanisms underlying POU4F3-associated DFNA15.


Conflict of interest statement

The authors declare no competing interests.

Figures

Figure 1
Figure 1
Four novel POU4F3 variants within the functional DNA-binding domains. Two (p.Ala189SerfsTer26 in SB218 and p.Leu248Pro in SB307) were located in the POU-specific domain, while the remaining two (p.Phe293Leu in SB438 and p.Val318Met in SB347) were in the POU-homeodomain. Conservation of the affected residues among species was documented for all POU4F3 variants identified in the study.
Figure 2
Figure 2
Pedigrees of the four families, Sanger sequencing traces of the respective POU4F3 variants, and the audiological phenotypes of the affected individuals. The pedigrees of the Sanger sequence chromatograms of the four families, exhibiting segregation of p.Ala189SerfsTer26 in SB218 (a), p.Leu248Pro in SB307 (b), p.Phe293Leu in SB438 (c), and p.Val318Met in SB347 (d). The audiograms of SB218, SB307, and SB438 were associated with moderate NSHL with mid-specific hearing loss configuration, while that of SB347 indicated severe-to-profound NSHL with flat configuration.
Figure 3
Figure 3
Novel POU4F3 variants destabilize the inter-helical interactions, impairing the transcriptional activity of POU4F3. (a) Sideview of Alphafold generated model structure of POU4F3. (Jumper et al. Highly accurate protein structure prediction with AlphaFold., Nature). POU homeodomain (green) and POU-specific domain (cyan) assembled with DNA binding cleft (orange circle) in between. Val318 and Phe293 are present in the Helix-a and Helix-b of the homeodomain (green), respectively, while Leu248 is in the Helix-d of the POU-specific domain (cyan). All the mutant residues are facing intra-helical spaces, not directly interacting with DNA. (b) Intra-helical proline substitution at Leu248 causes helical kinks. A 27-amino acid long helix-d has a natural kink (black dotted line) driven by Pro246 in the middle. Additional proline substitution induces the formation of an additional kink (red dotted line) starting from p.Leu248Pro (red dot), causing dramatic conformational changes in the POU-specific domain. (c) Phe293 forms aromatic ring stacking (black dotted line) with Trp321 and Phe322 in helix-a (left), stabilizing the interhelical interface. The p.Phe293Leu variant largely disrupts biochemical interactions between helix-a and helix-b, destabilizing helical assembly of POU-homeodomain. (d) Key amino acid residues of intramolecular hydrophobic cavity of POU homeodomain. Val318 forms hydrophobic interactions with Ile307, Leu289, and Leu311. The Val318Met mutant with long side chain clashes (red polygons), with the adjacent Ile307 and Leu289, changing the distance between helices. L Leu, V Val, P Pro, F Phe, W Trp, I Ile, M Met.
Figure 4
Figure 4
Western blot analysis for POU4F3 wild-type, frameshift, missense variants by transient transfection at HEK293T cell. (a) Expressions of POU4F3 wild-type and mutants were detected by western blotting in HEK 293T cells. Molecular weight of wild-type and mutant proteins (p.Leu248Pro, p.Phe293Leu, and p.Val318Met) are 36 kDa, whereas molecular weight of truncated mutant protein (p.Ala189SerfsTer26) is 21 kDa. The immunoblots are representative of independent repetitive experiments. LacZ is used as a transfection control. (b) The bands intensity was quantified by Image J. The band intensity was normalized to β-actin. Intensity data was presented as means ± standard deviations from two independent plots in a triplicate manner. Consequently, the sample size for each experiment was six. (c) Comparison of the stability of wild-type and mutant POU4F3 using protein stability assays in the transient overexpression system. HEK293 cells, overexpressing POU4F3, were treated with cycloheximide (80 µg/ml) for up to 3 h to block the general translation. The CHX chase assay experiment was performed once, with three measurements taken during the process. As a result, the sample size for each experiment was three. WT, wild type; LacZ, transfection control; β-actin, loading control; ns, no statistical significance; *p < 0.05, ***p < 0.001, one-way ANOVA with Bonferroni comparisons. The original immunoblots (uncropped, full length membranes with membrane edges visible, and standard protein size markers and expected molecular weight labeled) matched to the cropped versions (this figure) were all provided in Fig. S3.
Figure 5
Figure 5
Transcriptional activity of novel POU4F3 variants. (a) Luciferase activities measured under specific conditions. To minimize the ceiling effect, the condition (i.e., empty‐Luc 2 µg and SNAP25‐Luc 2 µg) was determined as the luciferase vector system. (b,c) The transcriptional activities of the wild-type and mutant POU4F3 proteins in the SNAP25-Luc vector were normalized to that of the internal control (Myc-DDK). Using the luciferase vector system, the transcriptional activity in the wild-type and the four POU4F3 variants were analyzed. All variants exhibited significantly reduced transcriptional activities compared to the wild type. Experiments were conducted in duplicate, and measurements were taken three times to determine luciferase activity. Consequently, the sample size for each experiment was six. The four mutant constructs corresponding to each variant differentiated by employing distinct colors for clear visualization. *, a statistical significance by one-way ANOVA and Bonferroni’s multiple comparison test.
Figure 6
Figure 6
Immunofluorescence of the wild-type and mutant POU4F3 proteins. (a) Cells were immuno-stained with anti-Myc (green) and phalloidin (red). The nuclei were stained with DAPI (blue). (b) Cells were immuno-stained with anti-DDK (green) and Rhodamine-phalloidin (red). Rhodamine-phalloidin (red) staining was used to label F-actin and stabilize actin filaments in vitro. The nuclei were stained with DAPI (blue). Upon examination through confocal microscopy, the region where the green fluorescence (representing the target protein) and the blue fluorescence (DAPI-stained nuclei) overlap appears as a turquoise color. (c) Quantitation of cytoplasmic and nuclear localization of POU4F3, depending on the variants.
Figure 7
Figure 7
RNA sequencing analysis. (a) Schematic diagram of the analysis flow. (b) Volcano plot of significantly different genes (n = 630). Upregulation (red dot) and downregulation (blue dot) gene numbers were summarized as a pie graph (inlet). (c) Heatmap analyses of differential gene expression. The higher expression level was shown as red color while the lower expression was shown as blue. (d) (Upper) Revigo visualization of the top 30 gene ontology (GO) data. Clustered terms were listed in each box. (Bottom) Top 10 GO terms in biological process. The red dot box showed top2 GO terms, including cell differentiation and cellular developmental process. (e) Ancestor chart view of the QuickGO. In each GO term, enriched gene number was shown in the dark green pie while term size was shown as green pie with the adjust p value calculated by hypergeometric test and multiple testing correction (FDR). The colored arrow showed the relationship between the Ancestor term and the Child term. The black arrow showed “is a” and the blue arrow showed “part of”, which is explained in the index box. 14 genes which belong to the GO-term (GO: 0048839) were significantly enriched (adjusted p value = 0.01). 14 transcripts were significantly enriched for the GO term (GO: 0048839) (adjusted p value = 0.01). To verify their dysregulation, each FPKM value of 14 genes from the health group (gray, n = 4) and the hearing loss group (white, n = 4) was compared as fold change with standard error of the means (SEM). *p < 0.05 was the result of a statistical significance test using the Student's t-test (bottom).
Figure 7
Figure 7
RNA sequencing analysis. (a) Schematic diagram of the analysis flow. (b) Volcano plot of significantly different genes (n = 630). Upregulation (red dot) and downregulation (blue dot) gene numbers were summarized as a pie graph (inlet). (c) Heatmap analyses of differential gene expression. The higher expression level was shown as red color while the lower expression was shown as blue. (d) (Upper) Revigo visualization of the top 30 gene ontology (GO) data. Clustered terms were listed in each box. (Bottom) Top 10 GO terms in biological process. The red dot box showed top2 GO terms, including cell differentiation and cellular developmental process. (e) Ancestor chart view of the QuickGO. In each GO term, enriched gene number was shown in the dark green pie while term size was shown as green pie with the adjust p value calculated by hypergeometric test and multiple testing correction (FDR). The colored arrow showed the relationship between the Ancestor term and the Child term. The black arrow showed “is a” and the blue arrow showed “part of”, which is explained in the index box. 14 genes which belong to the GO-term (GO: 0048839) were significantly enriched (adjusted p value = 0.01). 14 transcripts were significantly enriched for the GO term (GO: 0048839) (adjusted p value = 0.01). To verify their dysregulation, each FPKM value of 14 genes from the health group (gray, n = 4) and the hearing loss group (white, n = 4) was compared as fold change with standard error of the means (SEM). *p < 0.05 was the result of a statistical significance test using the Student's t-test (bottom).

References

    1. Vahava O, et al. Mutation in transcription factor POU4F3 associated with inherited progressive hearing loss in humans. Science. 1998;279:1950–1954. doi: 10.1126/science.279.5358.1950. - DOI - PubMed
    1. Weiss S, et al. The DFNA15 deafness mutation affects POU4F3 protein stability, localization, and transcriptional activity. Mol. Cell. Biol. 2003;23:7957–7964. doi: 10.1128/MCB.23.22.7957-7964.2003. - DOI - PMC - PubMed
    1. Collin RW, et al. Missense mutations in POU4F3 cause autosomal dominant hearing impairment DFNA15 and affect subcellular localization and DNA binding. Hum. Mutat. 2008;29:545–554. doi: 10.1002/humu.20693. - DOI - PMC - PubMed
    1. Erkman L, et al. Role of transcription factors a Brn-3.1 and Brn-3.2 in auditory and visual system development. Nature. 1996;381:603–606. doi: 10.1038/381603a0. - DOI - PubMed
    1. Xiang M, et al. Essential role of POU–domain factor Brn-3c in auditory and vestibular hair cell development. Proc. Natl. Acad. Sci. 1997;94:9445–9450. doi: 10.1073/pnas.94.17.9445. - DOI - PMC - PubMed

Publication types

MeSH terms

Supplementary concepts