. 2023 Aug 3;13(1):12630.
doi: 10.1038/s41598-023-39020-w.

The crosstalking immune cells network creates a collective function beyond the function of each cellular constituent during the progression of hepatocellular carcinoma

Affiliations

The crosstalking immune cells network creates a collective function beyond the function of each cellular constituent during the progression of hepatocellular carcinoma

Nicholas Koelsch et al. Sci Rep. .

Abstract

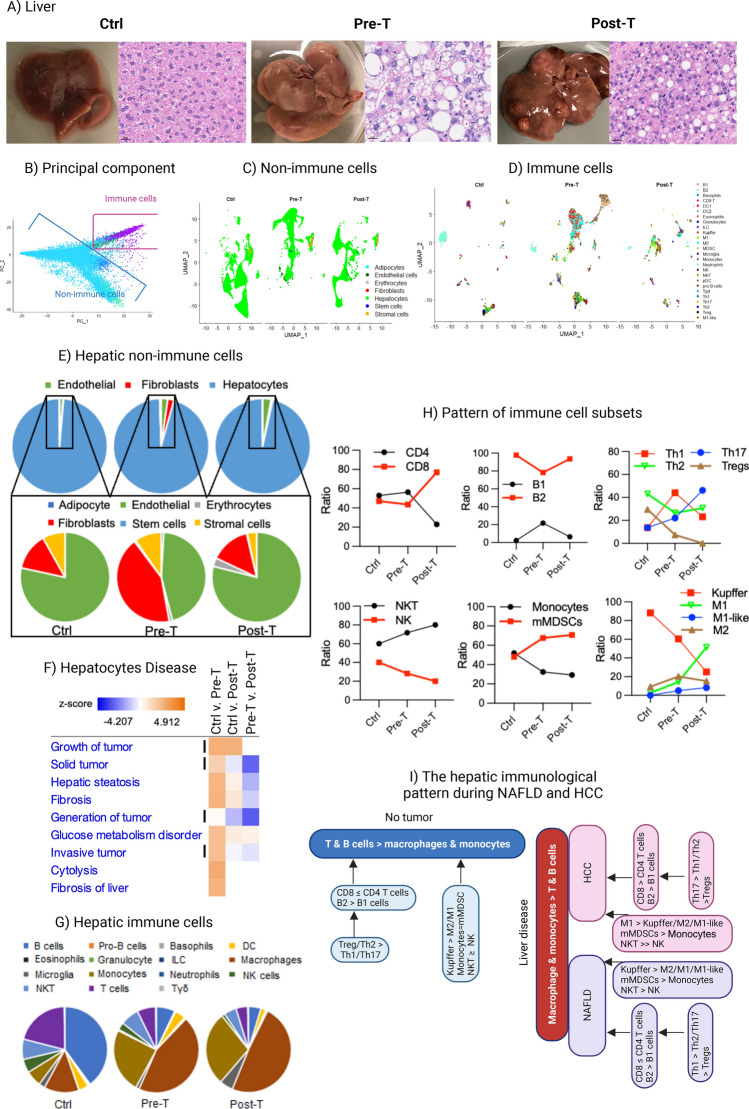
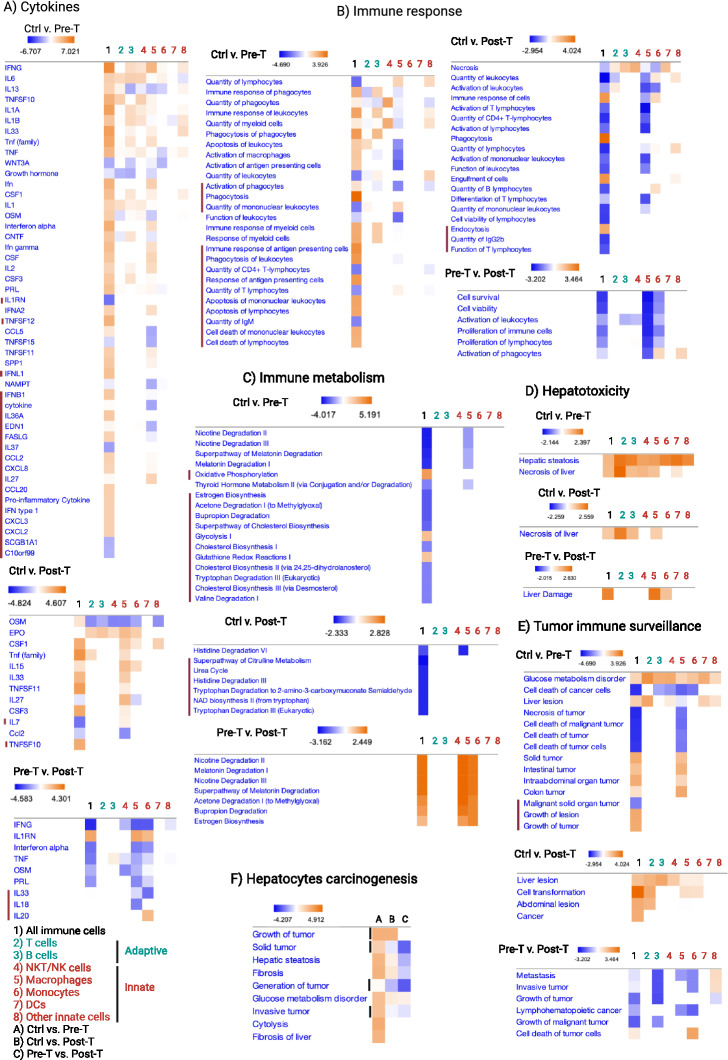
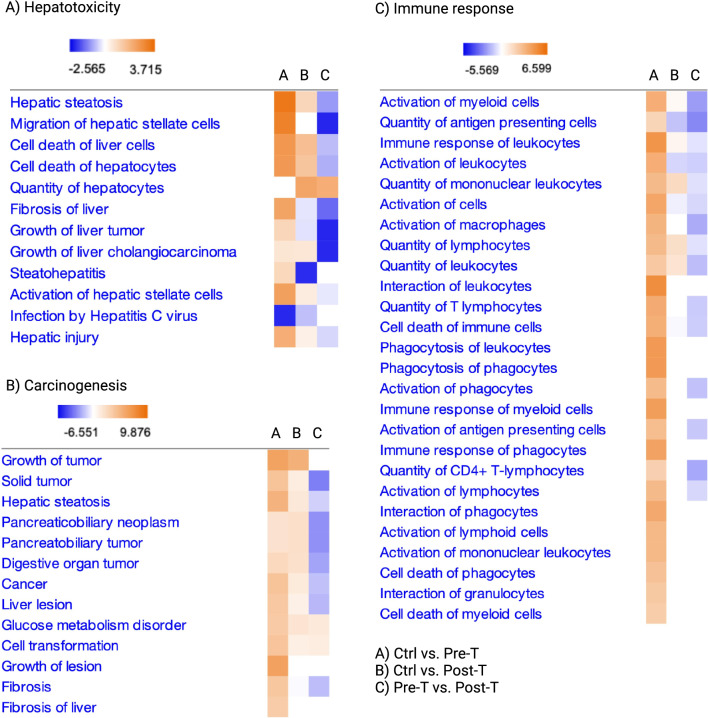
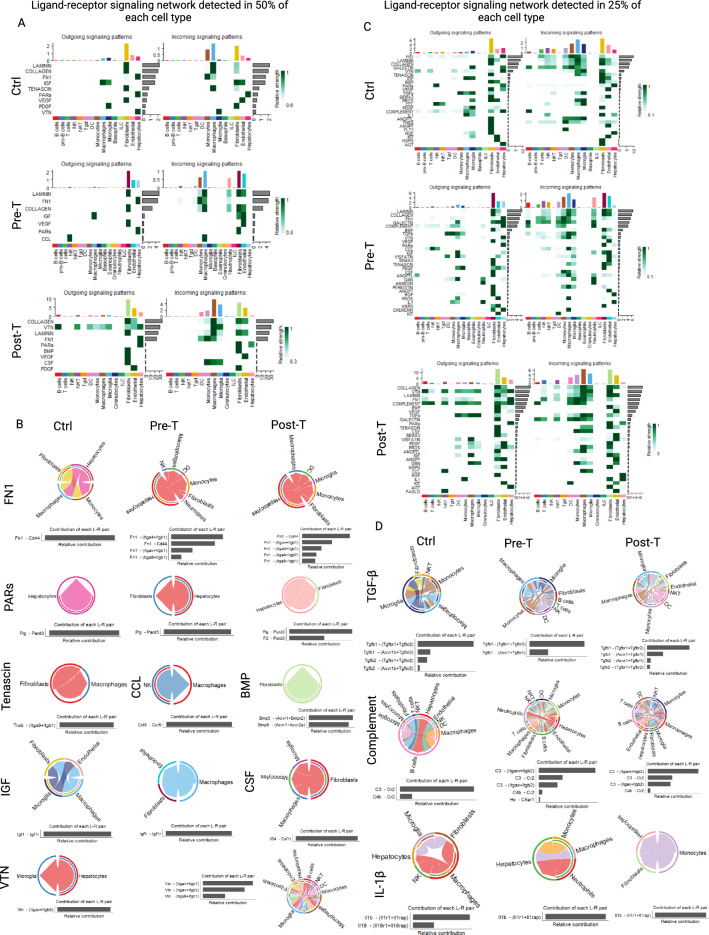
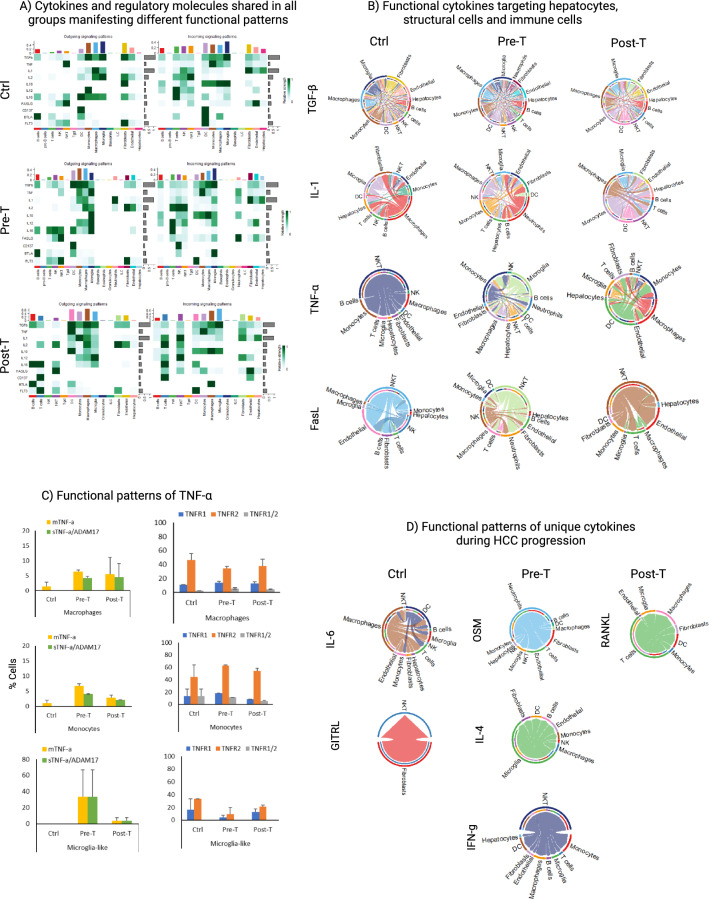
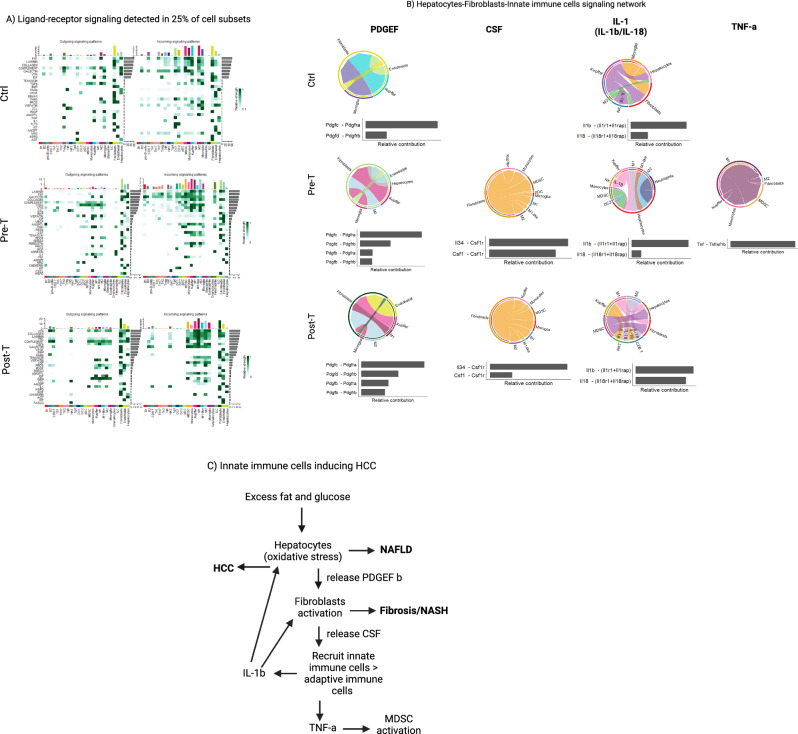
Abundance of data on the role of inflammatory immune responses in the progression or inhibition of hepatocellular carcinoma (HCC) has failed to offer a curative immunotherapy for HCC. This is largely because of focusing on detailed specific cell types and missing the collective function of the hepatic immune system. To discover the collective immune function, we take systems immunology approach by performing high-throughput analysis of snRNAseq data collected from the liver of DIAMOND mice during the progression of nonalcoholic fatty liver disease (NAFLD) to HCC. We report that mutual signaling interactions of the hepatic immune cells in a dominant-subdominant manner, as well as their interaction with structural cells shape the immunological pattern manifesting a collective function beyond the function of the cellular constituents. Such pattern discovery approach recognized direct role of the innate immune cells in the progression of NASH and HCC. These data suggest that discovery of the immune pattern not only detects the immunological mechanism of HCC in spite of dynamic changes in immune cells during the course of disease but also offers immune modulatory interventions for the treatment of NAFLD and HCC.


Conflict of interest statement

A.J.S. and F.M. hold a patent on the DIAMOND mouse model, PCT/US2016/056506. All other authors do not have any competing interest.

Figures

Figure 1
Figure 1
Visualization and pattern assessment of hepatic immune and non-immune cells: (A) Livers as well as hematoxylin–Eosin staining of liver specimens collected from the control group (Ctrl) as well as from animals being on a WD prior to tumor development (Pre-T) or after the development of HCC (Post-T). IHC pictures were generated using VectraPolaris 1.0 acquisition software, image size of 16.76 mm × 30.18 mm with the resolution of 25 µm/pixel (40×). (B) SingleR annotated cell types after all cells were classified by the ImmGen and MouseRNAseq reference databases. After annotations were complete and compared, the top 20 marker genes of each cell type (immune and non-immune) were passed to PCA to optimize visualization, indicated by separate clustering of immune and non-immune cells due to the use of these genes. (CD) UMAP of pooled samples split to show group specific non-immune cells (C) and immune cells (D). All SingleR annotated cell types and scSorter identified subsets were included in data visualization. (E) Pie graphs displaying non-immune cell components in each sample (hepatocytes accounted for over 95% of non-immune cells in each sample, while fibroblasts and endothelial cells primarily comprised the rest. (F) IPA analysis of the hepatocyte population portraying disease-related functions and activation z-scores (blue and orange bar) based on DESeq2 results after filtering on a p-value < 0.01 and z-scores > 2. Carcinogenesis events are shown using vertical lines. (G) Pie graphs showing the composition of immune cells annotated in each sample by ImmGen and MouseRNAseq databases accessed through SingleR. Panels E & G are based on the percentage of all cells in each compartment (innate and adaptive immune cells and non-immune cells) normalized in each for a total of 100%. (H) Ratio of immune cell subsets within each population was identified using scSorter (H only includes cells classified as specific subsets of interest from scSorter to normalize each subset of cells to 100%, while removing any “Unknown” cells that were not classifiable to ensure accuracy). (I) Multilayered immunological patterns during health and diseases, manifesting super-patterns and inferior patterns were quantitatively analyzed by focusing on the ratios/proportion of immune cells interacting with each other in a network.
Figure 2
Figure 2
A shift in immunological pattern from a dominant adaptive immunity to innate immunity alters the immune cells function and creates a collective function beyond its cellular constituents: DESeq2 was utilized to assess differences in the entire immune cell population (1) compared to each immune cell type components, including T cells (2), B cells (3), NKT/NK cells (4), Macrophages (5), Monocytes (6), DCs (7), and other immune cells (ILCs, granulocytes, eosinophils, basophils and microglia-like) (8) by using SingleR annotated cell types and passing differentially expressed genes to IPA. Cytokines, immune response pathways and immune metabolism that were only detected by collective immune function analysis (#1) but not the immune cell constituents separately (#2–8) are marked using red line. (A) Upstream analysis of comparative groups were performed to detect cytokines. (B) Diseases & functions analysis was focused on immune response related functions. (C) Metabolic canonical pathways were analyzed to detect immune cell metabolic functions identified across groups. (D) Toxic functions were analyzed for the detection of hepatotoxicity related functions when comparing immune cells in each group. (E) Diseases & functions analysis was focused on carcinogenesis events to detect tumor immunosurveillance functions in immune cells. (F) Hepatocyte populations were subjected to diseases & functions analysis focused on carcinogenesis events; columns represent comparisons, in (A) Ctrl vs. Pre-T, (B) Ctrl vs. Post-T, and (C) Pre-T vs. Post-T. Results from DESeq2 were filtered on a p-value < 0.01 and z-score > 2 in IPA for analysis. Carcinogenesis events are shown using vertical lines.
Figure 3
Figure 3
Collective immune function indicates increased inflammatory immune responses associated with liver damage and carcinogenesis events during a WD: All liver cells including the immune [B1, B2, pro-B cells, CD8+ T cells, CD4+ T cells (Th1, Th17, Th2, Treg), NK, NKT, Tγδ, DC1, DC2, pDC, MDSCs, Monocytes, Macrophages (Kupffer, M1, M2, M1-like), Microglia (microglia-like), Basophils, Eosinophils, Granulocytes, Neutrophils, ILCs] and non-immune cell population [Fibroblasts and Hepatocytes] and subsets from CellChat analysis containing SingleR annotated cell types and scSorter identified subsets were pooled to undergo DESeq2 and analysis in IPA. (A) Toxic functions were analyzed for the detection of hepatotoxicity related functions in each group. (B) Diseases & functions analysis focused on carcinogenesis events detected across groups. (C) Diseases & functions analysis was focused on immune response related functions. Contrasts are as followed and noted in the bottom right legend: Ctrl vs. Pre-T uses Ctrl group as reference, and Pre-T as test; Ctrl vs. Post-T tests the Post-T group against the Ctrl; and Pre-T vs. Post-T compares the Post-T group to the Pre-T as its reference.
Figure 4
Figure 4
Structural cells and innate immune cells dominate functional signaling network in the liver. (A) Heatmaps portraying all signaling pathways found to be significant by the CellChat R package across SingleR annotated cell types, encompassing immune cells, structural cells, and hepatocytes. CellChat analysis parameters were adjusted to use a truncated mean of 50% in order to detect pathways with ligand and receptor genes expressed in at least 50% of cells within annotated cell types, while only mapping significant pathways (p-value < 0.05) for each sample to show the cellular sources of signals (outgoing) and those receiving signals (incoming) based on the CellChat database of known ligand-receptor pairs in Ctrl (upper panel), Pre-T (Middle panel), and Post-T (lower panel). (B) Chord diagrams of shared signaling pathways ain all groups (FN1 and PARs), unique signaling pathway in each group (Tenascin, CCL, BMP, CSF) as well as shared signaling pathways in the Ctrl and Pre-T (IGF) or Ctrl and Post-T (VTN) groups. (C) Heatmaps portraying all identified significant signaling pathways by CellChat using default parameters (25% of cells expressing genes in each cell type. (D) Chord diagrams showing three signaling pathways shared by all groups. All figures were made through the use of CellChat version 1.5.0, and heatmaps in (A) and (C) used the dependent software ComplexHeatmap version 2.15.1 (https://github.com/jokergoo/ComplexHeatmap), while the chord diagrams in (B) and (D) used the dependent software circlize version 0.4.16 (https://github.com/jokergoo/circlize).
Figure 5
Figure 5
Functional signaling molecules being present in all groups exhibit different patterns of signaling interactions during HCC progression. (A) Heatmaps portraying only selected immunologically relevant signaling and regulatory molecules identified by CellChat with analysis parameters adjusted to use a truncated mean of 2.5%, in order to detect functional signaling pathways in reduced numbers of adaptive immune cells during a WD. (B) Chord diagrams showing the directionality of functional cytokine signaling targeting hepatocytes (TGF-β, IL-1, TNF-α, and FASL), as well as structural cells, and immune cells. (C) Functional patterns of the TNF-α signaling pathway were quantified by assessing the number of cells in each detected cell type involved in the pathway that were TNF-α + (Tnf > 0), TNF-α + /ADAM17 + (double positive and sTNF-α; Tnf > 0 & Adam17 > 0), TNFR1 + (Tnfrsf1a > 0), TNFR2 + (Tnfrsf1b > 0), and TNFR1 + /2 + (double positive; Tnfrsf1a > 0 & Tnfrsf1b > 0); all cells expressing genes are presented as a percentage of the cell type population in each sample. (D) Chord diagrams using CellChat for evaluating unique ligand-receptor in the Ctrl (IL-6 and GITRL), Pre-T (OSM, IL-4, and IFN-γ), and Post-T (RANKL). Figures (A), (B), and (D) were made through the use of CellChat version 1.5.0, and heatmaps in A used the dependent software ComplexHeatmap version 2.15.1 (https://github.com/jokergoo/ComplexHeatmap), while the chord diagrams in (B) and (D) used the dependent software circlize version 0.4.16 (https://github.com/jokergoo/circlize).
Figure 6
Figure 6
Structural cells are highly influential in the signaling interactions with other immune cells and non-immune cells in the liver. CellChat analyses enabled us to investigate signaling pathways based on the exact ligand and receptor pairs detected in each cell type, using the truncated mean of 2.5% analysis results. We focused on signaling coming from structural cells to immune cells, in which many functional signaling molecules were detected in endothelial cells (upper panel) and fibroblasts (lower panel) across groups.
Figure 7
Figure 7
Innate immune cells are central players in promoting HCC. (A) Heatmaps portraying all identified significant signaling pathways by CellChat using default parameters (25% of cells expressing genes in each cell type. (B) Chord diagrams showing signaling pathways among hepatocytes, structural cells and innate immune cells in all groups. (C) A summary of the stepwise signaling communications in the liver during a WD. Figures (A) and (B) were made through the use of CellChat version 1.5.0, and the heatmaps in A used the dependent software ComplexHeatmap version 2.15.1 (https://github.com/jokergoo/ComplexHeatmap), while the chord diagrams in B used the dependent software circlize version 0.4.16 (https://github.com/jokergoo/circlize).

References

    1. Younossi ZM. Non-alcoholic fatty liver disease—A global public health perspective. J. Hepatol. 2019;70:531–544. - PubMed
    1. Estes C, Razavi H, Loomba R, Younossi Z, Sanyal AJ. Modeling the epidemic of nonalcoholic fatty liver disease demonstrates an exponential increase in burden of disease. Hepatology. 2018;67:123–133. - PMC - PubMed
    1. Rathmell JC. Obesity, immunity, and cancer. N. Engl. J. Med. 2021;384:1160–1162. - PMC - PubMed
    1. Sanyal AJ, et al. Prospective study of outcomes in adults with nonalcoholic fatty liver disease. N. Engl. J. Med. 2021;385:1559–1569. - PMC - PubMed
    1. Peiseler M, Tacke F. Inflammatory mechanisms underlying nonalcoholic steatohepatitis and the transition to hepatocellular carcinoma. Cancers (Basel). 2021;13:730. - PMC - PubMed

Publication types