. 2023 Oct;26(10):1762-1774.
doi: 10.1038/s41593-023-01401-9. Epub 2023 Aug 3.

Unique functional responses differentially map onto genetic subtypes of dopamine neurons

Affiliations

Unique functional responses differentially map onto genetic subtypes of dopamine neurons

Maite Azcorra et al. Nat Neurosci. 2023 Oct.

Abstract

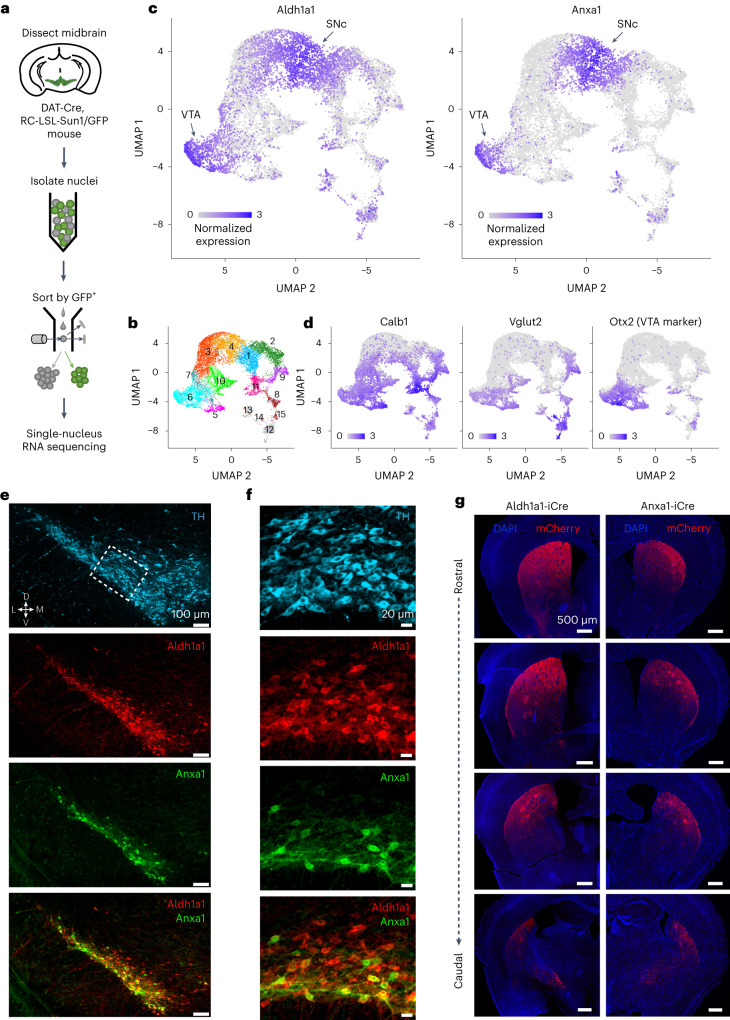
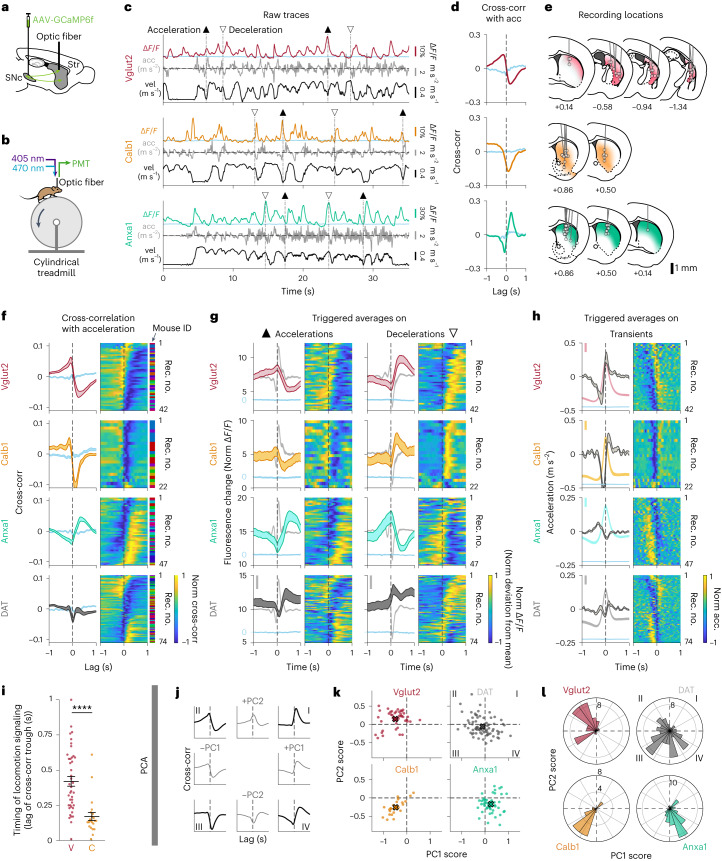
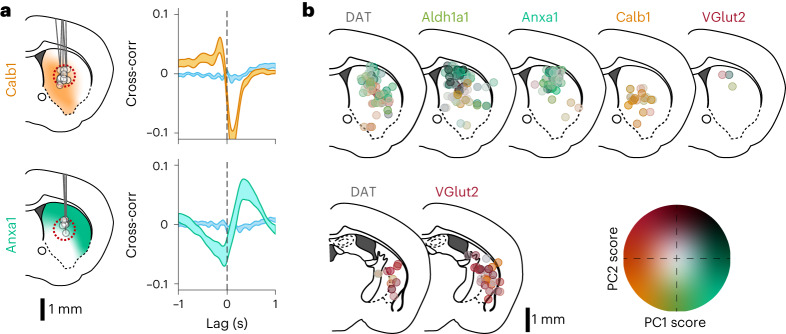
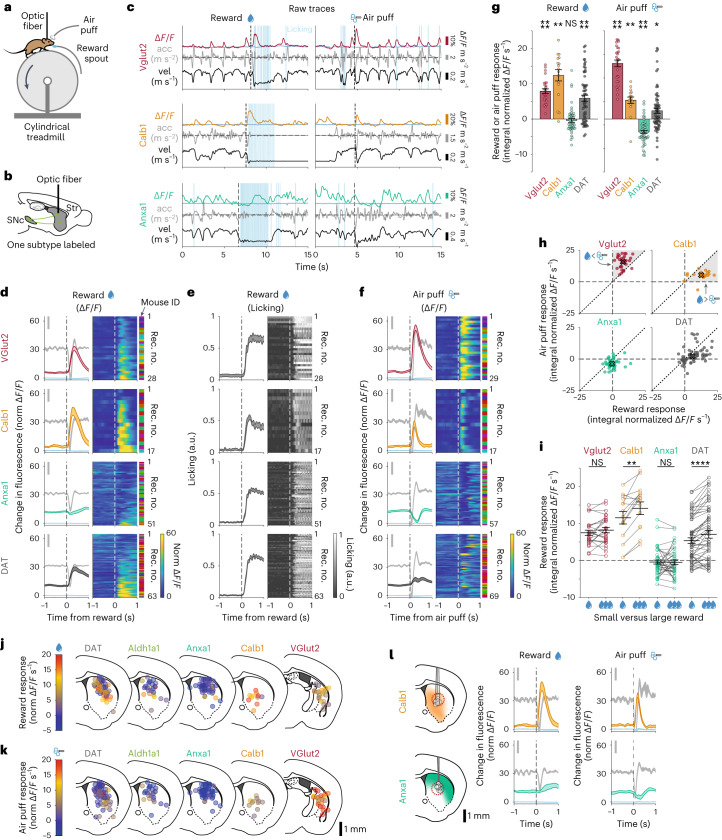
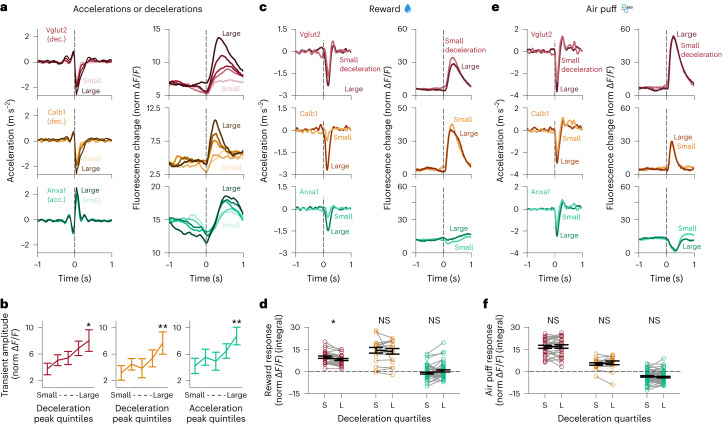
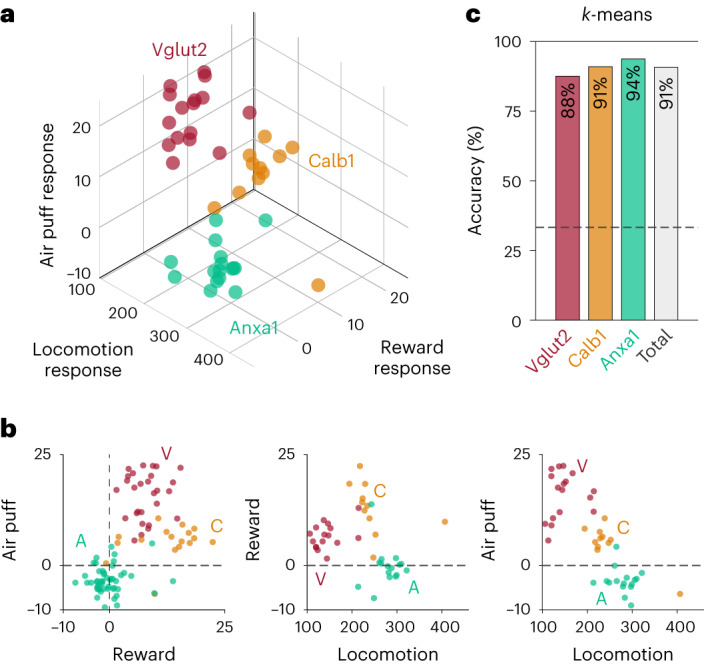
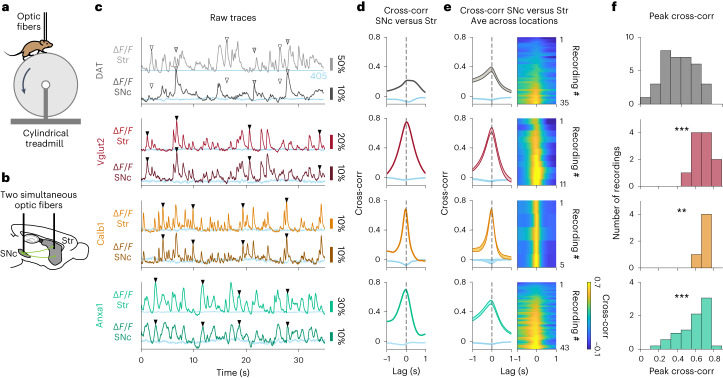
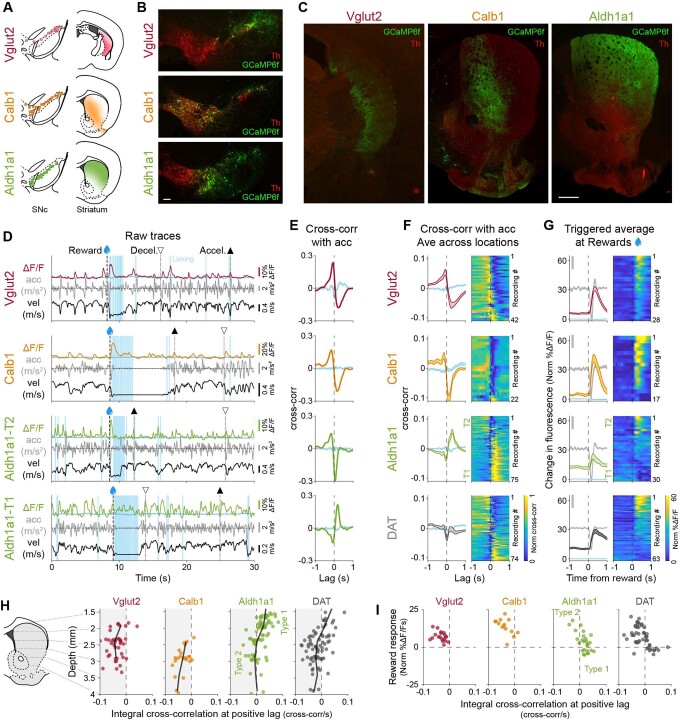
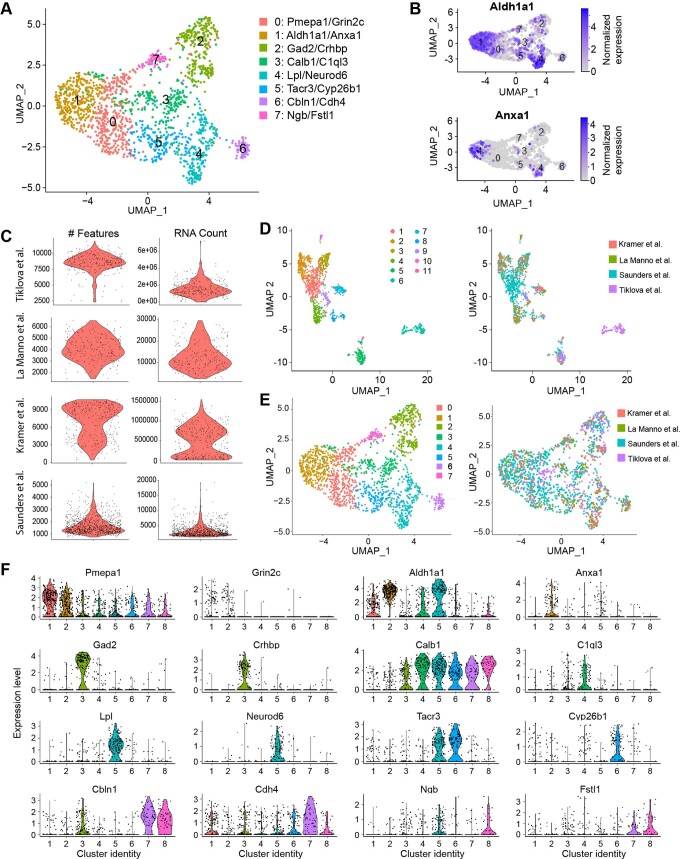
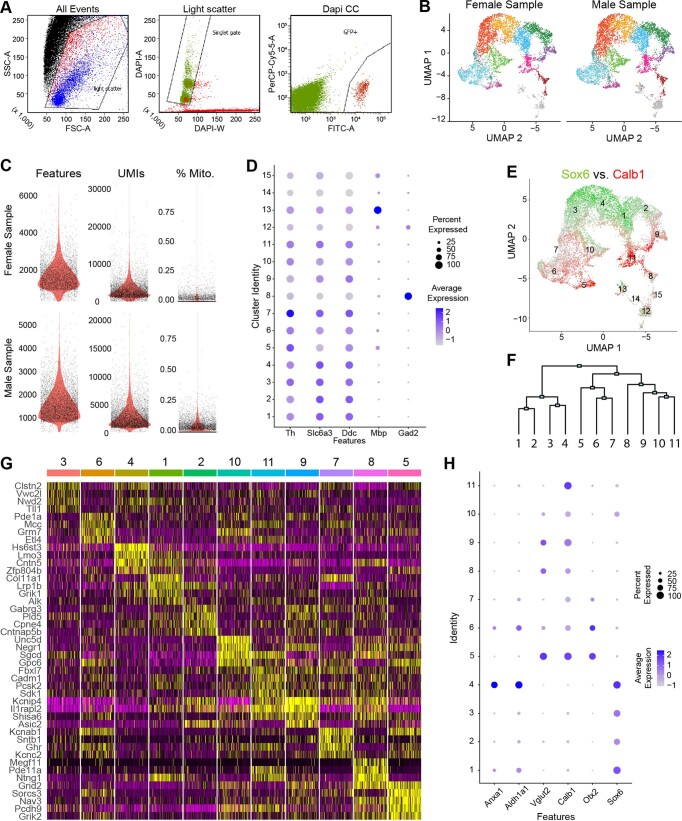
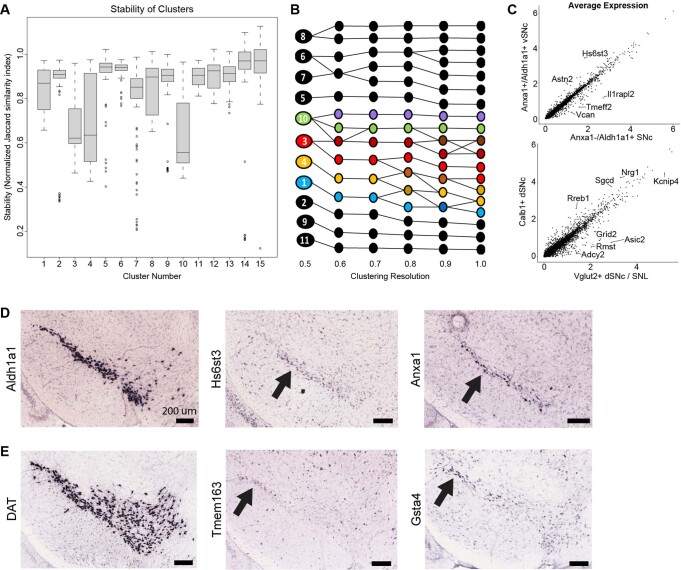
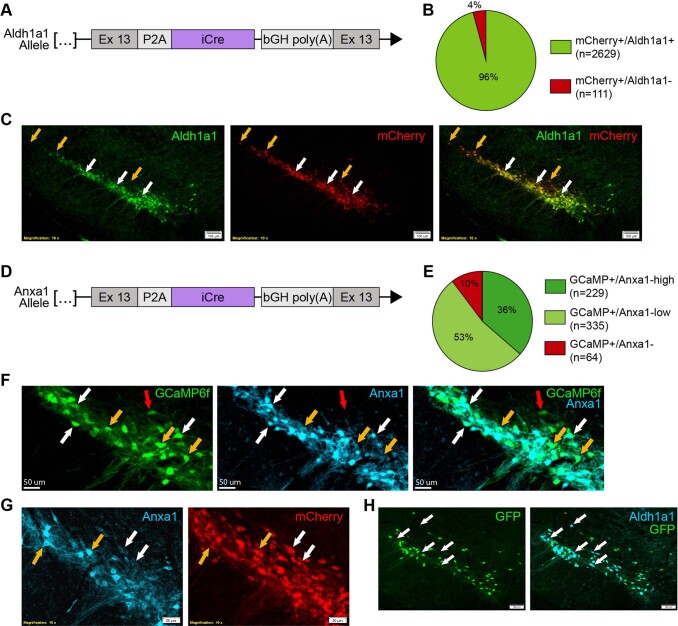
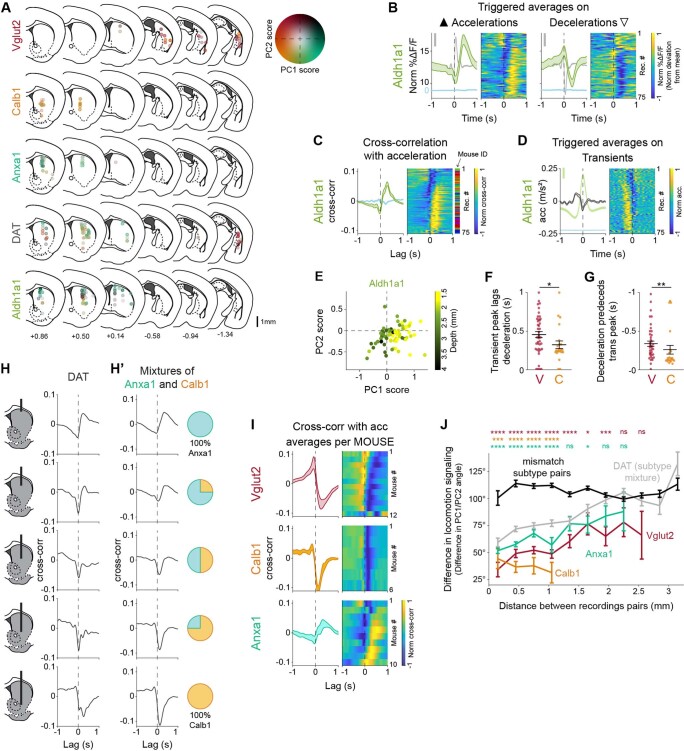
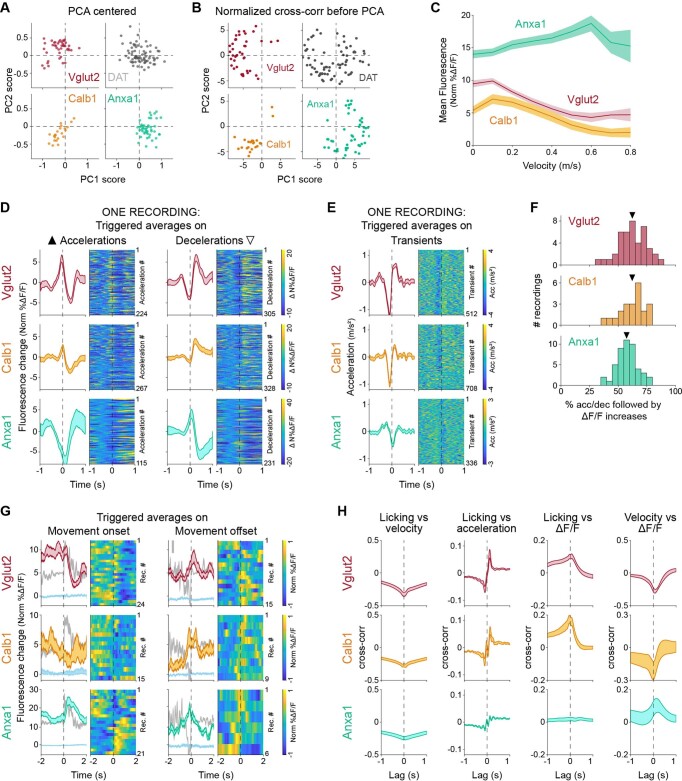
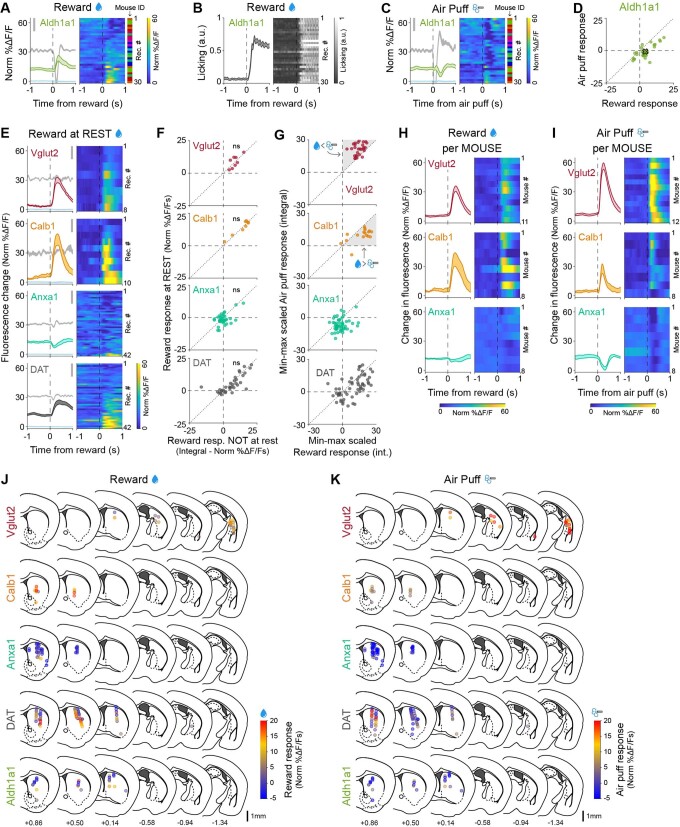
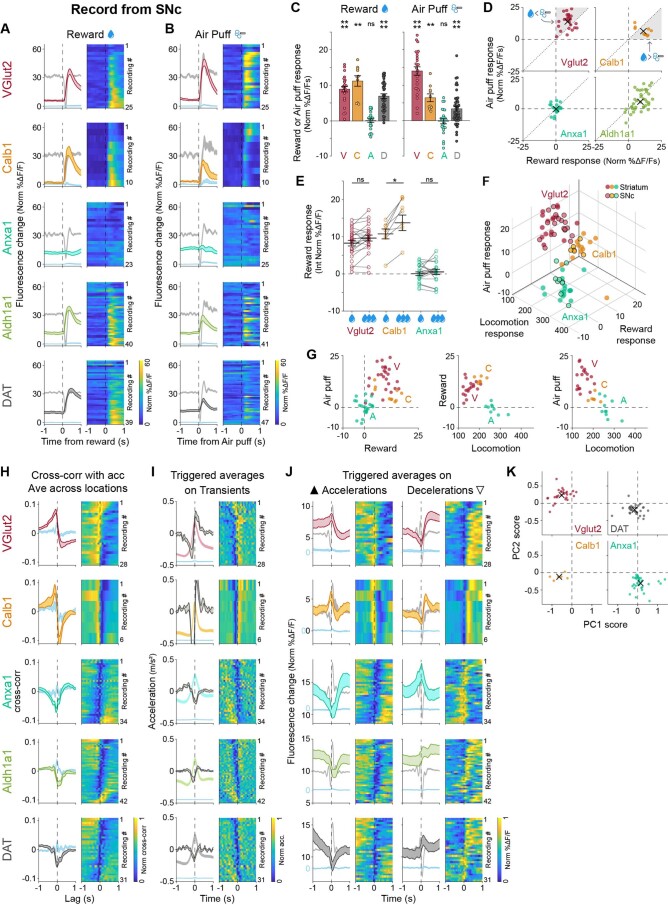
Dopamine neurons are characterized by their response to unexpected rewards, but they also fire during movement and aversive stimuli. Dopamine neuron diversity has been observed based on molecular expression profiles; however, whether different functions map onto such genetic subtypes remains unclear. In this study, we established that three genetic dopamine neuron subtypes within the substantia nigra pars compacta, characterized by the expression of Slc17a6 (Vglut2), Calb1 and Anxa1, each have a unique set of responses to rewards, aversive stimuli and accelerations and decelerations, and these signaling patterns are highly correlated between somas and axons within subtypes. Remarkably, reward responses were almost entirely absent in the Anxa1+ subtype, which instead displayed acceleration-correlated signaling. Our findings establish a connection between functional and genetic dopamine neuron subtypes and demonstrate that molecular expression patterns can serve as a common framework to dissect dopaminergic functions.


Conflict of interest statement

The authors declare no competing interests.

Figures

Fig. 1
Fig. 1. snRNA-seq reveals an Anxa1-expressing subtype within Aldh1a1+ dopamine neurons.
a, Schematic of snRNA-seq experimental pipeline. b, UMAP reduction of resulting clusters. In total, 15 clusters were found. Notably, four clusters (12, 13, 14 and 15) had weak dopaminergic characteristics (see Extended Data Fig. 3 for details). c, Expression of Aldh1a1 and Anxa1, the latter of which is expressed only within a subset of Aldh1a1-expressing neurons. d, Expression patterns of the additional markers used for genetic access in experiments here, as well as Otx2, a classical marker of most VTA neurons, enriched in clusters 5, 6 and 7. e, Immunofluorescence images of Aldh1a1 and Anxa1 protein expression in SNc (n = 4 mice). Anxa1 expression is limited to a ventral subset of Aldh1a1+ neurons. Thresholds for intensity scaling and gamma changes were set for each individual channel to maximize visibility of stained cells. f, Zoomed-in crops of section shown in e. Anxa1 expression was ventrally biased within SNc neurons. g, Right, projection patterns of Anxa1+ SNc axons based on viral labeling (n = 4 mice), which appear highly restricted to dorsolateral striatum and patches. Left, projection patterns of Aldh1a1+ SNc axons using the same virus (n = 4 mice); projections extend more ventrally relative to Anxa1+. Maximum thresholds for image intensity scaling were set to the highest detected pixel intensity in each section to better enable direct comparisons across brains. Source data
Fig. 2
Fig. 2. Dopaminergic genetic subtypes display different signaling patterns during locomotion.
a, Strategy used to label dopamine neuron subtypes and record from their axons in striatum with GCaMP6f, a calcium indicator whose changes in fluorescence can be used as a proxy for neuronal firing. b, Schematic of fiber photometry recording setup. c, Example recordings from each subtype studied, showing fluorescent traces (ΔF/F), mouse acceleration and velocity. Isosbestic control shown in blue. ▲, large accelerations; ▽, large decelerations. d, Cross-correlation between ΔF/F traces and acceleration for traces shown in c. Isosbestic control shown in blue. e, Recording locations in striatum for recordings shown in fh. Shaded colors represent projection patterns for each subtype. f, Average cross-correlation between ΔF/F traces and acceleration for all recordings of each subtype and DAT (subtypes indiscriminately labeled). Isosbestic control shown in blue. Shaded regions denote mean ± s.e.m. across recordings. Heat map shows cross-correlation for each recording, sorted by PC1/PC2 angle (see l). Vglut2 mice = 12, n = 42 recordings; Calb1 mice = 6, n = 22 recordings; Anxa1 mice = 10, n = 47 recordings; DAT mice = 14, n = 74 recordings. See Extended Data Fig. 6i for averages per mouse. g, ΔF/F averages triggered on large accelerations (left, ▲) and large decelerations (right, ▽) for all recordings of each subtype and DAT. Isosbestic control shown in blue, same scale as ΔF/F average but shifted for visibility. Acceleration shown in gray in background (scale bar, 0.2 m s2). Shaded regions denote mean ± s.e.m. across recordings. Heat map shows triggered average for each recording, sorted as in f. h, Acceleration averages triggered on ΔF/F transient peaks for all recordings of each subtype and DAT. ΔF/F average and isosbestic control shown in background (bar, 5% normalized ΔF/F). Shaded regions denote mean ± s.e.m. across recordings. Heat map shows triggered average for each recording, sorted as in f. i, Timing analysis showing the lag of the trough in the ΔF/F-acceleration cross-correlations for each recording from Calb1 and Vglut2, as shown in f (same recordings and n). Mean Vglut2 = 0.42, Calb1 = 0.17; P value for comparison = 1 × 10−6 (two-sided Wilcoxon rank-sum test with Bonferroni correction, same n as f). Error bars denote mean ± s.e.m. Analogous analysis conducted for triggered averages in Extended Data Fig. 6f,g. jl, PCA conducted on ΔF/F-acceleration cross-correlations for all striatal recordings from Vglut2, Calb1 and Anxa1 subtypes. j, ±PC1 and ±PC2 loadings (gray) and their combinations (black), which represent the different quadrants shown in kl. Together, PC1 and PC2 account for 84.3% of variance of all cross-correlations (PC1 = 64.2% of variance, PC2 = 20.1%). k, PC scores for each recording of each subtype and DAT along PC1 and PC2. X shows mean for each subtype. l, Radial histogram showing the PC1/PC2 angle of each recording in k. P values for comparison between subtypes VC = 2 × 10−7, VA = 4 × 10−11 and CA = 2 × 10−4 (two-sided Wilcoxon rank-sum test with Bonferroni correction). Acc, acceleration; Cross-corr, cross-correlation; Rec. no., recording number. Source data
Fig. 3
Fig. 3. Spatial distribution of subtype-specific locomotion responses.
a, Comparison of locomotion response (cross-correlation between ΔF/F and acceleration) for Calb1 and Anxa1 recordings only from a region of striatum where their axons overlap, dashed red circle (1-mm diameter). Isosbestic controls in blue. Shaded areas denote mean ± s.e.m. Calb1 mice = 4, n = 5 recordings; Anxa1 mice = 5, n = 16 recordings. b, Locomotion response (PC1/PC2 angle, as shown in Fig. 2l) mapped onto recording location for each subtype and DAT. Locations from the body (top) or the tail of the striatum (bottom) were collapsed into a single brain section. To reduce overlap, locations were shifted a random amount between ±0.4 mm mediolaterally. See Extended Data Fig. 6a for an expanded version of this panel without shifts or collapsing slices together. Cross-corr, cross-correlation. Source data
Fig. 4
Fig. 4. Dopaminergic genetic subtypes display different responses to rewards and aversive stimuli.
a, Mouse running on treadmill during fiber photometry while receiving unexpected rewards and air puffs. b, Schematic of fiber photometry recording strategy. c, Example recordings for each subtype studied, showing fluorescence traces (ΔF/F), mouse velocity, acceleration, licking and reward (left) or air puff (right) delivery times. Isosbestic controls in light blue, same scale as ΔF/F traces. Reward and air puff examples for each subtype are from the same recording. d, ΔF/F averages triggered on reward delivery times for all recordings of each subtype and DAT. Isosbestic control in light blue, same scale as ΔF/F average. Acceleration shown in gray in background (scale bar, 0.2 m s2). Shaded regions denote mean ± s.e.m. across recordings. Heat maps show triggered average for each recording, sorted by size of reward response. Vglut2 mice = 11, n = 28 recordings; Calb1 mice = 8, n = 17 recordings; Anxa1 mice = 8, n = 51; DAT mice = 11, n = 63 recordings. See Extended Data Fig. 8h,i for averages per mouse. e, Licking average triggered on reward delivery times for all recordings of each subtype and DAT (same as d). Shaded areas denote mean ± s.e.m. across recordings. Heat map shows triggered average for each recording, sorted as in d. f, ΔF/F averages triggered on air puff delivery times for all recordings of each subtype and DAT. Isosbestic control in light blue, same scale as ΔF/F average. Acceleration shown in gray in background (scale bar, 0.2 m s2). Shaded regions denote mean ± s.e.m. Heat map shows triggered average for each recording, sorted by reward size as in d,e. Vglut2 mice = 12, n = 29 recordings; Calb1 mice = 8, n = 17 recordings; Anxa1 mice = 8, n = 57 recordings; DAT mice = 11, n = 69 recordings. g, Average reward and air puff responses for each subtype (integral of fluorescence in a 0.5-s window after stimulus minus integral in 0.5 s before stimulus). Error bars denote mean ± s.e.m. across recordings. Means (m) and P values for reward: Vglut2 mice = 7.9 normalized ΔF/F s, P = 2 × 10−5; Calb1 mice = 12.4, P = 0.001; Anxa1 mice = −0.5, P = 0.1 (NS); DAT mice = 5.9, P = 9 × 10−7. Means (m) and P values for air puff: Vglut2 mice = 15.8, P = 1 × 10−5; Calb1 mice = 5.3, P = 0.007, Anxa1 mice = −3.7, P = 4 × 10−8; DAT mice = 5.3, P = 0.02 (two-sided Wilcoxon signed-rank test with Bonferroni correction). Same n as d,f. h, Reward versus air puff responses for all recordings of each subtype and DAT. X shows mean for each subtype. Shaded regions are areas representing greater air puff than reward response (for Vglut2) or greater reward versus air puff response (for Calb1). i, Comparison of responses to small versus large rewards for each subtype. Error bars denote mean ± s.e.m. Mean difference (m) and P values: Vglut2 mice = 0.9 normalized ΔF/F s, P = 0.6 (NS); Calb1 mice = 3.9, P = 9 × 10−3; Anxa1 mice = 0.04, P = 1 (NS); DAT mice = 1.9, P = 8 × 10−5(two-sided paired Wilcoxon signed-rank test with Bonferroni correction). Vglut2 mice = 11, n = 25 recordings; Calb1 mice = 6, n = 14 recordings; Anxa1 mice = 8, n = 42 recordings; DAT mice = 10, n = 55 recordings. j, Reward response mapped onto recording locations for each subtype and DAT. Locations from the body or the tail of the striatum were collapsed into a single brain section. To reduce overlap, locations were shifted a random amount between ±0.4 mm mediolaterally. See Extended Data Fig. 8j,k for an expanded version of this panel without shifts or collapsing slices together. k, Same as j but for air puff response. l, Comparison of reward and air puff response for Calb1 and Anxa1 recordings only from a region of striatum where their axons overlap, dashed red circle. Isosbestic control in blue. Shaded regions denote mean ± s.e.m. across recordings. Calb1 mice = 4, n = 9 recordings; Anxa1 mice = 5, n = 13 for rewards, n = 17 for air puffs. acc, acceleration; vel, velocity. Source data
Fig. 5
Fig. 5. Transients scale with acceleration/deceleration amplitude, but reward and air puff responses are independent of movement.
a, Acceleration (left) and ΔF/F (right) averages triggered on decelerations (for Vglut2 and Calb1) and accelerations (for Anxa1, bottom) as in Fig. 2g but with decelerations/accelerations split into five quantiles based on their amplitude. Vglut2 mice = 12, n = 42 recordings; Calb1 mice = 6, n = 22 recordings; Anxa1 mice = 10, n = 47 recordings (same as Fig. 2f–h). b, Average ΔF/F transient amplitude for decelerations/accelerations of increasing size, as shown in a. Percent increase in transient amplitude for the largest versus smallest quintile of decelerations/accelerations: Vglut2 = 214%, Calb1 = 243%, Anxa1 = 206%. P values: Vglut2 = 0.01, Calb1 = 0.002, Anxa1 = 0.002 (two-sided paired Wilcoxon signed-rank test with Bonferroni correction). Same n as a. Error bars denote mean ± s.e.m. c, Acceleration (left) and ΔF/F (right) averages triggered on rewards as in Fig. 4d but split into two quantiles based on the amplitude of the accompanying deceleration. Vglut2 mice = 11, n = 28 recordings; Calb1 mice = 8, n = 17 recordings; Anxa1 mice = 8, n = 51 recordings (same as Fig. 4d).¸d, Average ΔF/F transient amplitude for rewards based on the size of the accompanying deceleration, as shown in c. P values for comparison between transient amplitude for the smallest versus largest decelerations: Vglut2 = 0.01 (but for a decrease in transient amplitude for larger decelerations), Calb1 = 1 (NS) and Anxa1 = 0.1 (NS) (two-sided paired Wilcoxon signed-rank test with Bonferroni correction). Same n as c. Error bars denote mean ± s.e.m. e, Acceleration (left) and ΔF/F (right) averages triggered on air puffs as in Fig. 4f but split into two quantiles based on the amplitude of the accompanying deceleration. Vglut2 mice = 12, n = 29 recordings; Calb1 mice = 8, n = 17 recordings; Anxa1 mice = 8, n = 57 recordings (same as Fig. 4f). f, Average ΔF/F transient amplitude for air puffs based on the size of the accompanying deceleration, as shown in e. P values for comparison between transient amplitude for the smallest versus largest decelerations: Vglut2 = 1 (NS), Calb1 = 1 (NS) and Anxa1 = 1 (NS) (two-sided paired Wilcoxon signed-rank test with Bonferroni correction). Same n as e. Error bars denote mean ± s.e.m. Source data
Fig. 6
Fig. 6. Unique locomotion, reward and air puff responses differentially map onto genetic subtypes of dopamine neurons.
a, 3D plot showing locomotion (PC1/PC2 angle; Fig. 2l), reward and air puff responses for each recording and each subtype. b, 2D plots corresponding to all the combinations of the three dimensions used in a. c, Unsupervised k-means classification distinguished subtypes based on locomotion (PC1 and PC2 scores), reward and air puff responses, with total accuracy of 91%: 14/16 Vglut2, 10/11 Calb1 and 15/16 Anxa1 recordings correctly classified. Dashed line represents chance accuracy (33%). Source data
Fig. 7
Fig. 7. Highly correlated signaling in axons and somas within genetic subtypes of dopamine neurons.
a, Mouse running on treadmill during dual fiber photometry. b, Schematic of simultaneous photometry recordings from SNc and striatum. c, Example recordings for DAT and each subtype showing simultaneous fluorescence traces (ΔF/F) from SNc and striatum. Isosbestic controls in blue. ▼, example transients present in SNc and in striatum; ▽, example transient present in striatum but not in SNc (white fill) or vice versa (gray fill). d, Cross-correlation between ΔF/F traces from striatum and SNc shown in c. Isosbestic controls in blue. e, Average cross-correlation between simultaneous ΔF/F traces from striatum and SNc for all recordings of each subtype and DAT. Isosbestic controls in blue. Shaded regions denote mean ± s.e.m. across recordings. Heat map shows cross-correlations for each paired recording sorted by peak magnitude. DAT mice = 5, n = 35 recordings; Vglut2 mice = 4, n = 11 recordings; Calb1 mice = 2, n = 5 recordings; Anxa1 mice = 8, n = 43 recordings. f, Distribution of peak cross-correlations between SNc and striatum for recordings of all subtypes and DAT shown in e. P values for comparison to DAT: Vglut2 = 3 × 10−4, Calb1 = 3 × 10−3, Anxa1 = 3 × 10−4 (two-sided Mann–Whitney U-test with Bonferroni correction). Ave, average; Cross-corr, cross-correlation; Str, striatum. Source data
Extended Data Fig. 1
Extended Data Fig. 1. The Aldh1a1+ subtype is functionally heterogeneous.
(a) Schematic showing the distribution of somas and axons across the SNc and striatum for three previously described subtypes (See Poulin et al. 2018 for in depth characterization of each of these subtypes). (b) Representative distribution of somas for different subtypes within SNc. Scale bar 100 um. Thresholds for intensity scaling and gamma changes were set for each individual channel to maximize visibility of stained cells. (c) Representative projection patterns of different subtypes in striatum. Scale bar 500 um. Thresholds for intensity scaling and gamma changes were set for each individual channel to maximize visibility of stained axons. (d) Example recordings for each subtype studied (two from Aldh1a1 with different functional signaling patterns, Type 1 and Type 2), showing fluorescence traces (ΔF/F), velocity, acceleration, licking, and reward delivery times. Isosbestic control shown in blue. Large accelerations = ▲, large decelerations = ▽. (e) Cross-correlation between ΔF/F traces and acceleration for traces shown in D. Isosbestic control shown in blue. (f) Average cross-correlation between ΔF/F traces and acceleration for all recordings of each subtype and DAT (subtypes indiscriminately labeled). Isosbestic control shown in blue. Shaded regions denote mean ± s.e.m. Heatmap shows cross-correlations for each recording, sorted by the integral of the cross-correlation at positive lags. Vglut2 mice = 12, n = 42 recordings; Calb1 mice = 6, n = 22; Aldh1a1 mice = 14, n = 75 DAT mice = 14, n = 74. (g) ΔF/F triggered averages on reward delivery times for all recordings of each subtype and DAT. Isosbestic control shown in light blue, same scale as ΔF/F average. Acceleration shown in gray in the background (scale bar = 0.2 m/s2). Shaded regions denote mean ± s.e.m. Heatmap shows triggered average for each recording, sorted by size of reward response. Vglut2 mice = 11, n = 28 recordings; Calb1 mice = 8, n = 17; Aldh1a1 mice = 8, n = 30; DAT mice = 11, n = 63. (h) Distribution of locomotion response (integral of the cross-correlation at positive lags) along the dorso-ventral axis of the striatum for all recordings of all subtypes and DAT, showing how in Aldh1a1 dorsal recordings show acceleration correlation (Type 1) while more ventral recordings show deceleration correlation (Type 2). Black line represents moving average (0.5 mm bins). (i) Relationship between reward response and locomotion response for each recording of each subtype, showing how in Aldh1a1 larger reward responses correspond with deceleration correlation (Type 2), while small or negative reward responses correspond with acceleration correlation (Type 1). Source data
Extended Data Fig. 2
Extended Data Fig. 2. Integration of scRNA-seq datasets reveals more granular resolution of DA neuron subtypes.
(a) Resulting clusters from integrating datasets. (b) Expression patterns of Anxa1 and Aldh1a1, the top defining markers for cluster 1. Expression of Anxa1 appears to be limited to a subset of Aldh1a1-expressing neurons. (c) Violin plots of number of genes and RNA counts from each source dataset, which were used to determine cutoffs for quality control filtering. (d) LIGER clustering of the meta-dataset, revealing one cluster that was more distantly related to all other DA neurons and came solely from the Tiklova et al. dataset. This cluster was subsequently removed. (e) Cells colored by cluster (left) or source dataset (right), which reveals that all clusters were represented by each dataset. (f) Violin plots of the top 2 defining marker genes for each cluster.
Extended Data Fig. 3
Extended Data Fig. 3. Details of generation and analysis of single-nucleus RNAseq dataset.
(a) Example plots from FACS sorting of GFP+ nuclei. (b) Plots showing the distribution of cells from either the male or female samples, showing all clusters were represented by both samples. (c) Quality control plots of number of genes (features), UMIs, and percent mitochondrial reads for each sample. (d) Dotplot of classic DA neuron markers as well as Mbp and Gad2, which were used to determine non-classical DA clusters (12, 13, 14 & 15). Clusters 12, 14 & 15 significantly under-express DA neuron markers. Mbp is significantly expressed in cluster 13. Gad2 expression is limited to cluster 8, suggesting this cluster represents a previously described population of gabaergic dopamine neurons. (e) Overlaid expression patterns of Sox6 (green) and Calb1 (red) recapitulates a previously observed dichotomy among midbrain dopamine neurons. (f) Dendrogram of hierarchical clustering estimation. Height of branch points approximates the relatedness of clusters. Notably, clusters 1–4 appear to be Sox6+, 5–7 are Otx2+, and 8–11 are negative for both markers. (g) Heatmap of top 4 differentially expressed genes for each cluster, excluding non-classical DA clusters. (h) Dotplot of expression of key marker genes of dopamine neuron subpopulations.
Extended Data Fig. 4
Extended Data Fig. 4. Cluster heterogeneity and distinguishing features.
(a) Quantification of stability (via normalized Jaccard similarity index) of all 15 clusters from n = 100 iterations of stability calculations (simulated randomly down-sampled datasets, see Methods). Lower stability measurements imply the possibility of further subdivisions within the cluster, or additional subpopulations that may have been split across adjacent clusters. Center represents median, upper and lower box bounds represent 75th and 25th percentiles respectively, whiskers represent maxima and minima excluding outliers (data points more than 1.5 times the IQR outside the box bounds). (b) Mapping clusters across progressively higher resolutions reveals potential subdivisions either within clusters (for example, the splitting of Cluster 8 into two stable clusters) or across adjacent clusters (for example a novel cluster emerging at the intersection of clusters 3 and 10 as resolution increases). Four clusters with lower stability, as shown in panel A, are colored to highlight the potential source of their instabilities. (c) Scatter plots comparing the average expression for all genes across two clusters. Several examples of distinguishing genes with notably enriched expression patterns are highlighted. Top: Clusters 4 (Anxa1+/Aldh1a1+) vs. 1 (Anxa1-/Aldh1a1+). Bottom: Clusters 11 (Calb1+ SNc) vs. 9 (Vglut2+ SNc/SNL). Transcriptomic similarity of cluster pairs can be approximated by the correlation coefficient of their average gene expressions. (d) In situ hybridization images from the Allen Mouse Brain Atlas of ventral tier marker genes. Note that Hs6st3, which is highly enriched in our Anxa1+ cluster, appears limited to ventral-most SNc and highly resembles the expression of Anxa1 (black arrows). Images available from Allen Mouse Brain Atlas, mouse.brain-map.org (e) Additional ISH images showing expression of two marker genes that distinguish Cluster 9 (Vglut2+) from Cluster 11 (Calb1+), further corroborating the distinct identities of these populations. DAT expression is shown for reference to highlight the localization of these markers to SN pars lateralis, matching the previously described location of Vglut2+ SN DA neurons and thus supporting Cluster 9 as the Vglut2+ neurons investigated in the GCaMP activity recordings in this study. Source images available from Allen Mouse Brain Atlas, mouse.brain-map.org.
Extended Data Fig. 5
(a) Schematic representation of Aldh1a1-iCre transgenic line. Endogenous Aldh1a1 gene was targeted for insertion of a P2A peptide and iCre immediately following the peptide encoded by Exon 13. (b) Ratio of mCherry virally labelled cells co-staining for Aldh1a1 (n = 4 mice). (c) Substantia nigra pars compacta immunofluorescence staining from Aldh1a1-iCre mice injected with an AAV5-DIO-mCherry virus (n = 4 mice). Co-staining shows excellent efficiency and fidelity of iCre recombination, which is notably limited to TH+ cells in this region. White arrows: examples of mCherry and Aldh1a1 co-stained cells. Orange arrows: mCherry-expressing cells with undetectable Aldh1a1 staining, which were primarily localized to the dorsal and lateral SNc. Thresholds for intensity scaling and gamma changes were set for each individual channel to maximize visibility of stained cells. (d) Schematic representation of Anxa1-iCre transgenic line. (e) Ratios of virally labelled cells co-staining for Anxa1 protein (n = 4 mice), showing high fidelity of Cre recombination. (f) High magnification of immunofluorescence staining from Anxa1-iCre mice injected with an AAV1-CAG-FLEX-GCaMP6f virus (n = 4 mice) shows that recombination occurs in cells with both high Anxa1 (white arrow) and low Anxa1 (orange arrow), with ~10% of labelled cells showing undetectable Anxa1 protein (red arrows). Thresholds for intensity scaling and gamma changes were set for each individual channel to maximize visibility of stained cells. (g) High magnification of immunofluorescence staining from Anxa1-iCre mice injected with an AAV5-DIO-mCherry virus (n = 4 mice) confirms that recombination occurs in cells with both high Anxa1 protein staining (orange arrows) as well as low Anxa1 protein (white arrows), making it difficult to assess specificity using protein staining alone. Thresholds for intensity scaling and gamma changes were set for each individual channel to maximize visibility of stained cells. (h) IF staining of GFP and Aldh1a1 in Anxa1-iCre, TH-Flpo, RC::FrePe mice (n = 2 mice). Recombination by iCre and Flpo leads to GFP expression in Anxa1+ DA neurons. Co-staining with Aldh1a1 corroborates that Anxa1-iCre recombination is less broad than Aldh1a1 expression and confirms that viral labelling results were not due to insufficient viral delivery / diffusion (example cells with Aldh1a1 staining but no recombination shown with white arrows). Thresholds for intensity scaling and gamma changes were set for each individual channel to maximize visibility of stained cells. Source data
Extended Data Fig. 6
Extended Data Fig. 6. Dopaminergic genetic subtypes show different signaling patterns during locomotion.
(a) Locomotion response (PC1/PC2) mapped onto recording location for each subtype and DAT. Same as Fig. 3b but without collapsing slices for compactness and without random mediolateral shifting of recording locations to reduce overlap. (b) Average ΔF/F triggered on large accelerations (left, ▲) and large decelerations (right, ▽) for Aldh1a1 recordings (as Fig. 2g). Isosbestic control shown in light blue, same scale as ΔF/F average but shifted. Acceleration shown in grey in the background (scale bar = 0.2 m/s2). Shaded regions denote mean ± s.e.m. Heatmap shows triggered average for each recording, sorted by PC1/PC2 angle (see Fig. 2l). Aldh1a1 mice = 14, n = 75 recordings. (c) Average cross-correlation between ΔF/F traces and acceleration for Aldh1a1 recordings (as Fig. 2f). Isosbestic control shown in blue. Shaded regions denote mean ± s.e.m. Heatmap shows cross-correlation for each recording, sorted as in B. (d) Average acceleration triggered on large transients for Aldh1a1 recordings (as Fig. 2h). ΔF/F average and isosbestic control shown in the background (scale bar = 5% Norm ΔF/F.) Shaded regions denote mean ± s.e.m. Heatmap shows triggered average for each recording, sorted as in B. (e) Principal component scores for each recording along PC1 and PC2 for Aldh1a1 (same as Fig. 2k) but with each Aldh1a1 recording color-coded by depth within striatum, showing that Aldh1a1 axons deeper in striatum show similar locomotion signaling to Calb1. (f) Timing of the calcium transient peak in triggered averages on decelerations (Fig. 2g, right) for each recording from Calb1 and Vglut2. Means Vglut2 = 0.35, Calb1 = 0.23; p-value for comparison between subtypes = 0.01 (two-sided Wilcoxon rank-sum test). Vglut2 mice = 12, n = 42 recordings; Calb1 mice = 6, n = 22 (as in Fig. 2i). Error bars denote mean ± s.e.m. (g) Timing of the deceleration peak in triggered averages on ΔF/F transient peaks (Fig. 2h) for each recording from Calb1 and Vglut2. Means Vglut2 = 0.47, Calb1 = 0.34; p-value for comparison between subtypes = 0.005 (two-sided Wilcoxon rank-sum test). Same n as F. Error bars denote mean ± s.e.m. (h) The locomotion signaling observed in DAT mice across depths (H) can be explained by mixtures of the Anxa1 and Calb1 subtypes in varying ratios matching the relative abundance of each subtypes’ axons in that depth (H’). (i) Average cross-correlation between ΔF/F traces and acceleration for all recordings of each functionally homogeneous subtype (as Fig. 2f) but averaged per mouse. Shaded regions denote mean ± s.e.m. Heatmap shows cross-correlation average for each mouse, sorted by PC1/PC2 angle (see Fig. 2l). (j) Difference in locomotion signaling (measured as the difference in PC1/2 angle, as shown in Fig. 2l) between pairs of recordings made at difference distances from each other, for pairs of recordings from the same subtype (Vglut2, Calb1, and Anxa1, in colors), from DAT mice (mixture of subtypes, in grey), or from mismatched subtypes (Vglut2-Calb1, Vglut2-Anxa1, and Calb1-Anxa1). P-values for comparison between pairs within same subtype vs mismatch subtypes: Vglut2 = 3 × 10−05, 6 × 10−23, 2 × 10−25, 5 × 10−25, 1 × 10−08, 0.03, 9 × 10−04, 1, 0.9; Calb1 = 2 × 10−04, 5 × 10−22, 4 × 10−10, 1 × 10−07; Anxa1 = 8 × 10−08, 6 × 10−35, 1 × 10−21, 5 × 10−09, 0.06, 0.02, 1, 1 (two-sided Mann-Whitney U test with Bonferroni correction). Number of pairs of recordings per distance bin (from 0 in steps of 0.3 mm): Vglut2 = [24, 107, 108, 91, 58, 29, 28, 14, 6, 0, 0], Calb1 = [37, 83, 29, 18, 1, 3, 0, 0, 0, 0, 0], Anxa1 = [252, 410, 250, 52, 49, 30, 28, 10, 0, 0, 0], Mismatch = [47, 245, 438, 525, 461, 661, 542, 615, 367, 189, 49]. Error bars denote mean ± s.e.m. Source data
Extended Data Fig. 7
Extended Data Fig. 7. Dopaminergic genetic subtypes show different signaling patterns during locomotion continued.
(a) Principal component scores for each recording of each subtype and DAT along PC1 and PC2, as show in Fig. 2k but when PCA analysis is conducted with data centering, showing this variable does not have an effect in the differentiation of subtypes. (b) Principal component scores for each recording of each subtype and DAT along PC1 and PC2, as show in Fig. 2k but where the cross-correlations for each recording have been min-max scaled before running PCA analysis. This has a similar effect as considering only the angle of PC1/2 as shown in Fig. 2l, with recordings being pushed out into an annulus of which different subtypes occupy different sectors. (c) Ongoing velocity is encoded by each subtype. Average fluorescence for each subtype at different ranges of velocities (bin width 0.1 m/s). Error bands denote mean ± s.e.m. (D) Average ΔF/F triggered on large accelerations (left, ▲) and large decelerations (right, _) (as Fig. 2g) for one representative recording of each subtype. Shaded regions denote mean ± s.e.m. across events. Heatmap shows ΔF/F traces for each acceleration or deceleration for the recording in chronological order, shifted to better show relative changes in fluorescence (subtract average ΔF/F in a window −0.7 to −0.1 s before trigger points). (e) Average acceleration triggered on large transients (as Fig. 2h) for one representative recording of each subtype. Shaded regions denote mean ± s.e.m. across events. Heatmap shows acceleration traces for each transient in the recording in chronological order. (f) Percent of accelerations (for Anxa1) or decelerations (for Vglu2 and Calb1) followed by an increase in ΔF/F. Mean: Vglut2 = 62.4%, Calb1 = 62.3%, Anxa1 = 57.5%. (g) Average ΔF/F triggered on movement onsets (left) and offsets (right) for each subtype. Isosbestic control shown in light blue, same scale as ΔF/F average but shifted. Acceleration shown in grey in the background (scale bar = 0.5 m/s2). Shaded regions denote mean ± s.e.m. across recordings. Heatmap shows ΔF/F traces for each recording randomly sorted. Mice: Vglut2 = 10/8, Calb1 = 5/8, Anxa1 = 8/4. (h) Cross-correlations between different behavioral variables. Shaded regions denote mean ± s.e.m. Source data
Extended Data Fig. 8
Extended Data Fig. 8. Dopaminergic subtypes show different signaling to rewards and aversive stimuli.
(a) ΔF/F average triggered on reward delivery times for all recordings from Aldh1a1 (as Fig. 4d). Isosbestic control shown in light blue, same scale as ΔF/F average. Acceleration shown in gray in the background (scale bar = 0.2 m/s2). Shaded regions denote mean ± s.e.m. Heatmap shows triggered average for each recording, sorted by size of reward response. Aldh1a1 mice = 8, n = 30 recordings. (b) Licking average triggered on reward delivery times (same as A) for all recording from Aldh1a1 (as Fig. 4e). Shaded regions denote mean ± s.e.m. Heatmap shows triggered average for each recording, sorted as in A. (c) ΔF/F average triggered on air puff delivery times for all recordings from Aldh1a1 (as Fig. 4f). Isosbestic control shown in light blue, same scale as ΔF/F average. Acceleration shown in gray in the background (scale bar = 0.2 m/s2). Shaded regions denote mean ± s.e.m. Heatmap shows triggered average for each recording, sorted by reward size as in A, B. Aldh1a1 mice = 8, n = 30 recordings. (d) Reward vs air puff responses for Aldh1a1 (as shown in Fig. 4h for other subtypes). X shows mean. (e) ΔF/F averages triggered on rewards delivered during rest for all recordings of each subtype and DAT. Isosbestic control shown in light blue, same scale as ΔF/F average. Acceleration shown in gray in the background (scale bar = 0.2 m/s2). Shaded regions denote mean ± s.e.m. Heatmaps show triggered average for each recording, sorted by size of the reward response. Vglut2 mice = 6, n = 8 recordings; Calb1 mice = 6, n = 10; Anxa1 mice = 8, n = 42; DAT mice = 10, n = 42. (f) Comparison between response to rewards at rest (E) vs response to rewards not at rest for all recordings of each subtype and DAT. Diagonal dotted line represents identity line (same response to rewards at rest vs all rewards). p-values: Vglut2 = 1 (ns), Calb1 = 1 (ns), Anxa1 = 0.4 (ns), DAT = 0.2 (ns), two-sided paired Wilcoxon signed-rank test with Bonferroni correction. (g) Subtypes can still be distinguished by their air puff and reward responses after min-max scaling the responses. (H) ΔF/F average triggered on reward delivery times for all recordings of each functionally homogeneous subtype (as Fig. 4d) but averaged per mouse. Shaded regions denote mean ± s.e.m. Heatmap shows triggered average for each recording, randomly sorted. (i) Same as H but for air puffs. (j) Reward response mapped onto recording locations for each subtype and DAT. Same as Fig. 4j but without collapsing slices for compactness and without random mediolateral shifting of recording locations to reduce overlap. (k) Same as J but for air puff response (matching Fig. 4k but without collapsing slices or random shifting). Source data
Extended Data Fig. 9
Extended Data Fig. 9. SNc somas of genetic dopamine neuron subtypes have similar signaling patterns to their axons in response to rewards and air puffs and during locomotion.
(a-e) Same as Fig. 4 but for recordings made in SNc. (a) ΔF/F averages triggered on reward delivery times for all recordings of each subtype and DAT. Isosbestic control shown in light blue, same scale as ΔF/F average. Acceleration shown in gray in the background (scale bar = 0.2 m/s 2). Shaded regions denote mean ± s.e.m. Heatmap shows triggered average for each recording, sorted by size of reward response. Vglut2 mice = 9, n = 25 recordings; Calb1 mice = 5, n = 10; Anxa1 mice = 5, n = 23; Aldh1a1 mice = 11, n = 40; DAT mice = 7, n = 39. (b) ΔF/F averages triggered on air puff delivery times for all recordings of each subtype and DAT. Isosbestic control shown in light blue, same scale as ΔF/F average. Acceleration shown in gray in the background (scale bar = 0.2 m/s 2). Shaded regions denote mean ± s.e.m. Heatmap shows triggered average for each recording, sorted by reward size as in A. Vglut2 mice = 9, n = 25 recordings; Calb1 mice = 5, n = 10; Anxa1 mice = 5, n = 25; Aldh1a1 mice = 11, n = 41; DAT mice = 8, n = 47. (c) Average reward and air puff responses for each subtype. Error bars denote ± s.e.m. p-values for reward: Vglut2 = 5 × 10−05, Calb1 = 0.007, Anxa1 = 1 (not significant), DAT = 2 × 10−07. p-values for air puff: VGlut2 = 5 × 10−05, Calb1 = 0.008, Anxa1 = 1 (not significant), DAT = 3 × 10−05. Two-sided Wilcoxon sign-rank test with Bonferroni correction. Same recordings and n as A,B. (d) Reward vs air puff responses for all recordings of each subtype and DAT. X shows mean for each subtype. Shaded regions are areas representing greater air puff than reward response (for Vglut2) or greater reward vs air puff response (for Calb1). (e) Comparison of responses to small vs large rewards for each subtype. Error bars denote mean ± s.e.m. p-values: Vglut2 = 0.05 (not significant), Calb1 = 0.03, Anxa1 = 1 (not significant). Two-sided paired Wilcoxon Signed Rank test with Bonferroni correction. Vglut2 mice = 9, n = 25 recordings; Calb1 mice = 5, n = 10; Anxa1 mice = 5, n = 23. (F) 3D plot showing locomotion (PC1/PC2 angle), reward and air puff responses for each recording and each subtype, comparing striatal recordings (same as Fig. 6a) and SNc recordings. (G) 2D plots for each pair of variables shown in the 3D plot in F. (h-k) Same as Fig. 2 but for recordings made in SNc. (h) Average cross-correlation between ΔF/F traces and acceleration for all recordings of each subtype. Isosbestic control shown in blue. Shaded regions denote mean ± s.e.m. Heatmap shows cross-correlation for each recording, sorted by PC1/PC2 angle (see Fig. 2l). Vglut2 mice = 11, n = 28 recordings; Calb1 mice = 3, n = 6; Anxa1 mice = 8, n = 34; Aldh1a1 mice = 13, n = 42; DAT mice = 8, n = 31. (I) ΔF/F averages triggered on large accelerations (left, ▲) and large decelerations (right, ▽) for all recordings of each subtype. Isosbestic control shown in light blue, same scale as ΔF/F average but shifted. Acceleration shown in gray in the background (scale bar = 0.2 m/s2). Shaded regions denote mean ± s.e.m. Heatmap shows triggered average for each recording, sorted as in H. (J) Acceleration averages triggered on large transients for all recordings of each subtype. ΔF/F average and isosbestic control shown in the background (scale bar = 5% Norm ΔF/F.) Shaded regions denote mean ± s.e.m. Heatmap shows triggered average for each recording, sorted as in H. (K) Principal component scores for each recording of each subtype along PC1 and PC2 (same PCs obtained from the striatal recordings, as shown in Fig. 2j–l). X shows mean for each subtype. Striatal PCs explain 77.6% of SNc variance (52.4% PC1, 25.2% PC2). Source data
Extended Data Fig. 10
Extended Data Fig. 10. Highly correlated signaling in axons and somas within genetic subtypes of dopamine neurons.
(a) Example recording for Aldh1a1 showing simultaneous fluorescence traces (ΔF/F) from SNc and striatum. Isosbestic control shown in blue. ▼= Example transients present in SNc and in striatum. (b) Cross-correlation between ΔF/F traces from striatum and SNc shown in A. Isosbestic control shown in blue. (c) Average cross-correlation between ΔF/F traces from striatum and SNc for all recordings of Aldh1a1 (as Fig. 6e). Isosbestic control shown in blue. Shaded regions denote mean ± s.e.m. Heatmap shows cross correlations for each paired recording sorted by peak magnitude. Aldh1a1 mice = 8, n = 29 recordings. (d) Distribution of peak cross correlations between SNc and striatum for recordings of Aldh1a1 and DAT shown in C (as Fig. 6f). P-value for comparison DAT-Aldh1a1 = 0.03 (two-sided Mann-Whitney U test with Bonferroni correction). (e) Peak cross correlations between dorsal striatum recordings (from Aldh1a1 or DAT) vs different relative depths in SNc, showing that for Aldh1a1 dorsal striatum signaling is best correlated to ventral SNc. Source data

References

    1. Schultz W. The reward signal of midbrain dopamine neurons. N. Physiol. Sci. 1999;14:249–254. - PubMed
    1. Eshel, N., Tian, J., Bukwich, M. & Uchida, N. Dopamine neurons share common response function for reward prediction error. Nat. Neurosci.19, 479–486 (2016). - PMC - PubMed
    1. Dabney, W. et al. A distributional code for value in dopamine-based reinforcement learning. Nature577, 671–675 (2020). - PMC - PubMed
    1. Coddington LT, Dudman JT. Learning from action: reconsidering movement signaling in midbrain dopamine neuron activity. Neuron. 2019;104:63–77. doi: 10.1016/j.neuron.2019.08.036. - DOI - PubMed
    1. Berridge KC. The debate over dopamine’s role in reward: the case for incentive salience. Psychopharmacolgy (Berl). 2007;191:391–431. doi: 10.1007/s00213-006-0578-x. - DOI - PubMed

Publication types