. 2023 Sep;55(9):1440-1447.
doi: 10.1038/s41588-023-01468-x. Epub 2023 Aug 3.

Somatic mutations in facial skin from countries of contrasting skin cancer risk

Affiliations

Somatic mutations in facial skin from countries of contrasting skin cancer risk

Charlotte King et al. Nat Genet. 2023 Sep.

Erratum in

Abstract

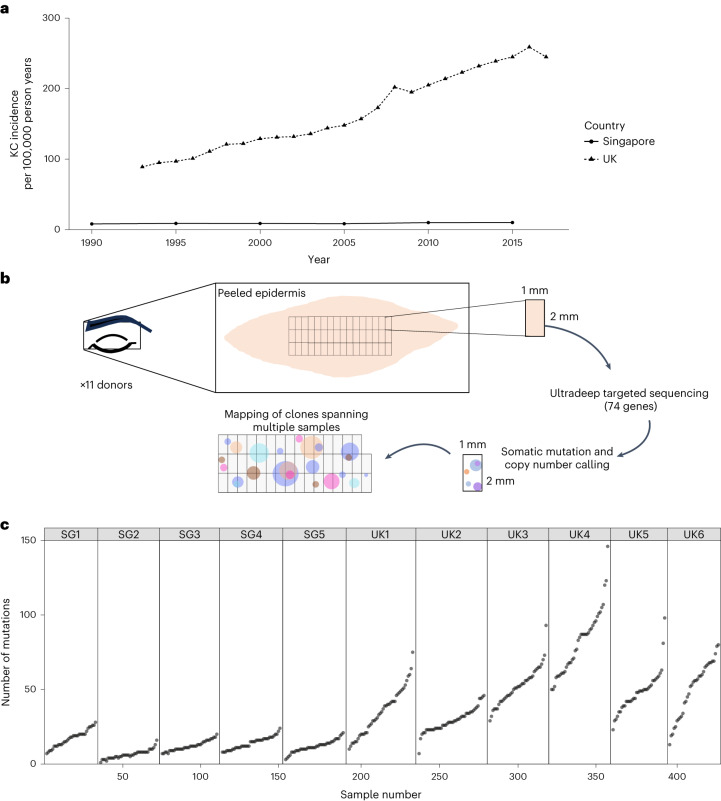
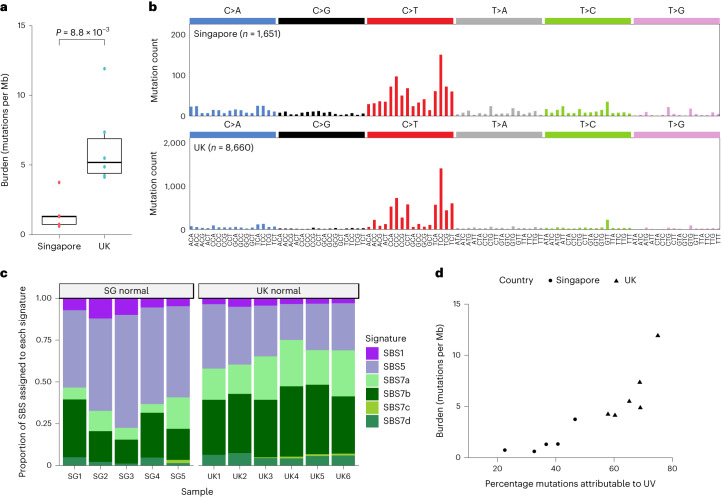
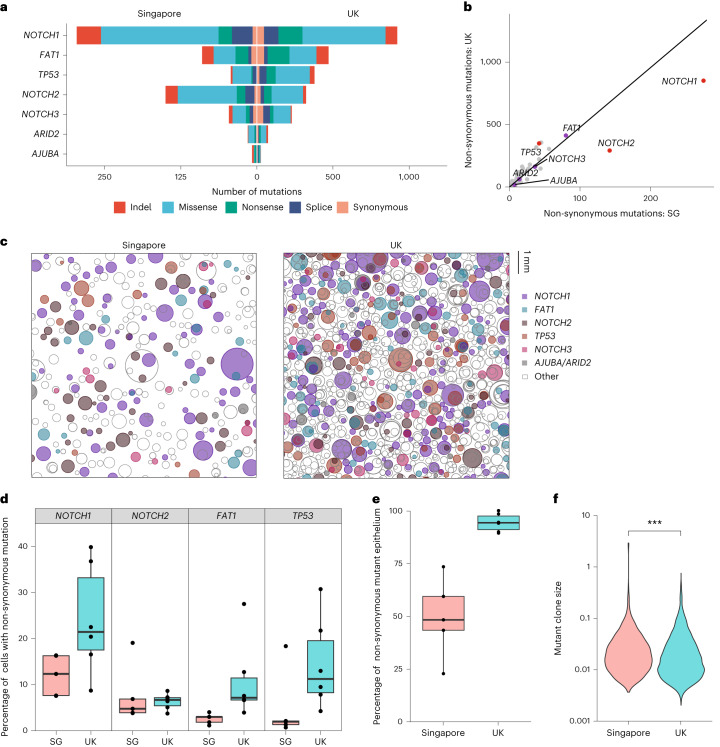
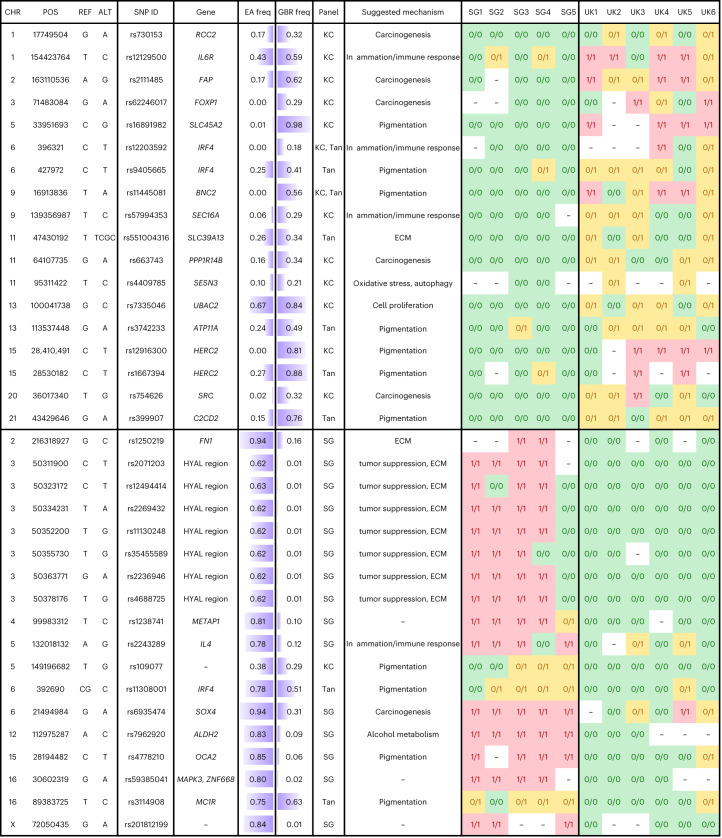
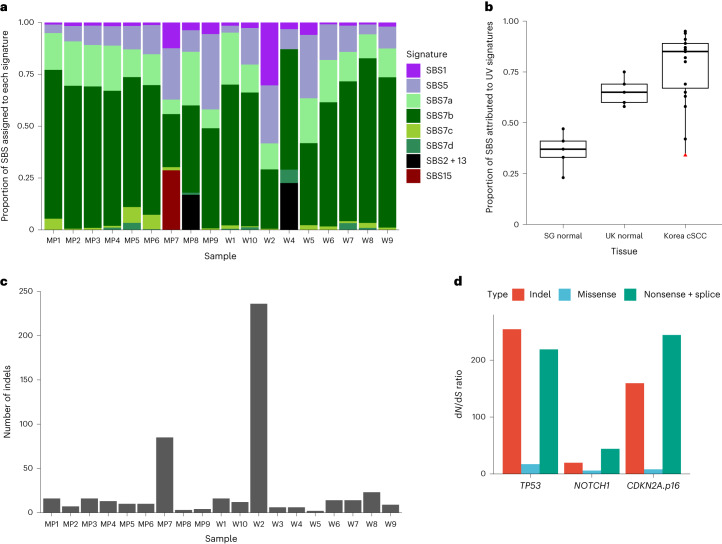
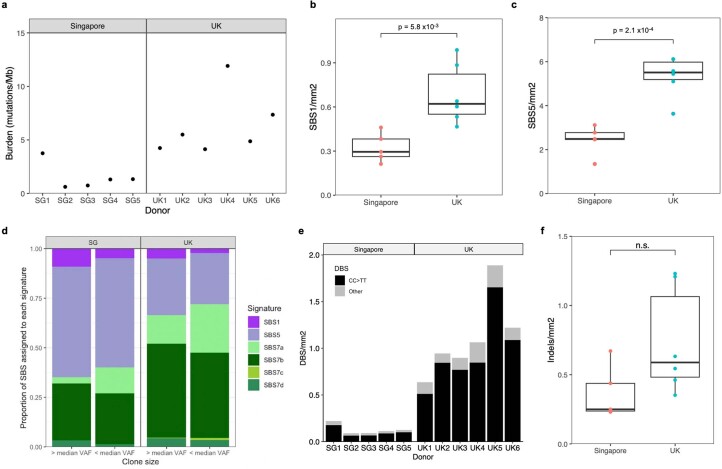
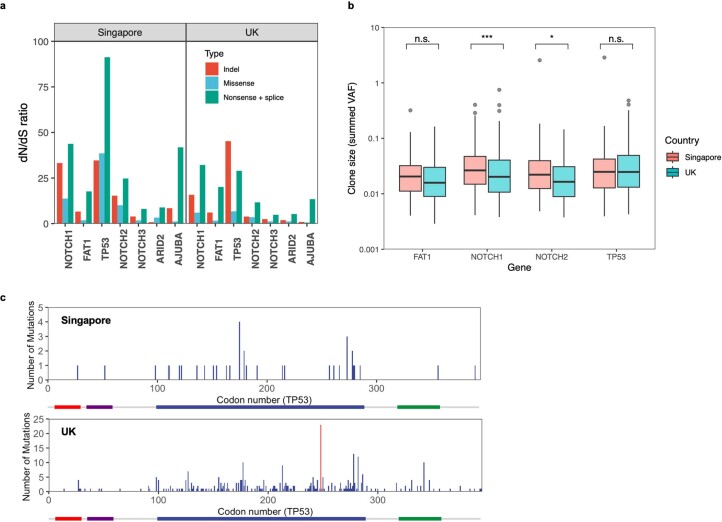
The incidence of keratinocyte cancer (basal cell and squamous cell carcinomas of the skin) is 17-fold lower in Singapore than the UK1-3, despite Singapore receiving 2-3 times more ultraviolet (UV) radiation4,5. Aging skin contains somatic mutant clones from which such cancers develop6,7. We hypothesized that differences in keratinocyte cancer incidence may be reflected in the normal skin mutational landscape. Here we show that, compared to Singapore, aging facial skin from populations in the UK has a fourfold greater mutational burden, a predominant UV mutational signature, increased copy number aberrations and increased mutant TP53 selection. These features are shared by keratinocyte cancers from high-incidence and low-incidence populations8-13. In Singaporean skin, most mutations result from cell-intrinsic processes; mutant NOTCH1 and NOTCH2 are more strongly selected than in the UK. Aging skin in a high-incidence country has multiple features convergent with cancer that are not found in a low-risk country. These differences may reflect germline variation in UV-protective genes.


Conflict of interest statement

The authors declare no competing interests.

Figures

Fig. 1
Fig. 1. Sampling of facial skin across two countries with contrasting skin cancer risk.
a, Age-standardized incidence rates per 100,000 person years for keratinocyte cancers (KC) in the UK and Singapore. Data were collated from Cancer Research UK and the Singapore Cancer Registry,. b, Sampling method to allow mapping of clones spanning multiple samples of epidermis. c, Number of mutations detected per 2-mm2 sample of epidermis (n = 428) across sequencing of 74 genes per donor.
Fig. 2
Fig. 2. Mechanisms of mutagenesis differ by country.
a, Estimates of genome-wide mutation burden per donor according to country (n = 11 donors, two-sided t-test: P = 8.8 × 10−3). Tukey box plot where the lower and upper hinges represent the first and third quartile, the center is the median and the outliers are more than 1.5× the interquartile range (IQR). b, Trinucleotide context for SBS in skin from UK and Singaporean donors. c, Proportion of SBS assigned to each signature per donor (purple, aging; green, UV). Signature contributions are clustered significantly according to country (Methods; unsupervised hierarchical clustering with accuracy obtained through bootstrapping: a.u. = 0.99999, P < 1 × 10−5). d, Proportion of SBS attributed to UV damage was positively correlated with burden estimates per donor (Pearson’s r = 0.87, Spearman rank = 0.95).
Fig. 3
Fig. 3. Clonal selection and competition differ according to country.
a, Number of mutations of each consequence for positively selected genes (dNdScv: q < 0.01) according to country. ARID2 is not significantly positively selected in the Singapore samples. b, Plot of non-synonymous mutations per gene in Singapore versus UK samples. Gradient of line: total number of non-synonymous mutations in the UK/Singapore = 6,846/1,432. Positively selected genes (purple) are labeled. Red indicates positively selected genes with a significant (one-sided likelihood ratio test: Padj < 0.001) difference in dN/dS ratio according to country, after accounting for global differences. c, A representation of protein-altering mutations in 1 cm2 of skin from donors from Singapore and the UK. Samples were randomly selected and mutations are displayed as circles, randomly distributed in the space. Sequencing data, including copy number, were used to infer the size and number of clones and, where possible, the nesting of subclones. Otherwise, subclones are nested randomly. d, Estimated percentage of cells with at least one non-synonymous mutation per positively selected gene, according to country (n = 11 donors, samples with known CNA removed). Tukey box plot where the lower and upper hinges represent the first and third quartile, the center represents the median and the outliers are more than 1.5× the IQR. Two-sided Wilcoxon signed-rank test: Padj = 0.03 (NOTCH1), 0.66 (NOTCH2), 8.7 × 10−3 (FAT1) and 0.05 (TP53) with Holm multiple testing correction. e, Estimated percentage of cells with at least one non-synonymous mutation across 74 genes according to country (Methods; n = 11 donors, two-sided Wilcoxon signed-rank test: P = 4.3 × 10−3). Tukey box plot where the lower and upper hinges represent the first and third quartile, the center represents the median and the outliers more than 1.5× the IQR. f, Violin plot comparing clone size distributions (summed variant allele fraction) per mutation according to country. UK donor mutations had a lower mean clone size (two-sided Welch’s t-test: P = 4.27 × 10−14).
Fig. 4
Fig. 4. Thirty-six risk loci where donor genotypes differ according to country.
Loci are either associated with keratinocyte cancer or tan response (Tan) or previously found to be under selection in Singaporean genomes; – for genotype indicates that no call could be made (Methods). Associated genes and mechanisms are suggested using phenome-wide association studies (PheWAS) and expression quantitative trait locus (eQTL) data from the Open Targets Genetics database. ECM, extra-cellular matrix; – indicates that the mechanism is unknown. Population allele frequencies are reported for East Asia (EA freq) and Great Britain (GBR freq) using data from the 1000 Genomes Project Phase 3 (Methods). Purple shading indicates the frequency of the alternative (ALT) allele in each population. Note that all loci in the HYAL region form part of the same linkage disequilibrium block on chromosome 3p.21. For each donor, green indicates homozygous reference (REF) alleles, yellow heterozygous and red homozygous ALT alleles.
Fig. 5
Fig. 5. Features of tumors from a low-incidence country (South Korea).
a, Proportion of SBS attributed to reference mutational signatures according to donor (purple, aging signatures; green, UV radiation signatures; black, APOBEC mutagenesis; red, defective DNA mismatch repair). Korean samples are labeled as in the original study. b, Proportion of substitutions attributable to UV radiation reference signatures SBS7a–d according to tissue (Singapore normal: n = 5 donors; UK normal: n = 6 donors; Korean cSCC: n = 19 tumors; red triangle, MP7, a Korean tumor sample with defective DNA repair). Tukey box plot where the lower and upper hinges represent the first and third quartile, the center represents the median and the outliers are more than 1.5× the IQR. c, Number of insertions and deletions called in each Korean tumor sample. d, Ratio of observed and expected non-synonymous mutations for positively selected genes (q < 0.01 by dNdScv). Line drawn at y = 1.
Extended Data Fig. 1
Extended Data Fig. 1. Mutational burden and signatures.
a Estimates of genome-wide mutation burden per donor. b Proportion of SBS1 mutations/mm2 per donor (n = 11) by country (two-sided t-test: p = 5.8 × 10−3). Tukey boxplot where lower and upper hinges = 1st and 3rd quartile, centre = median, outliers > 1.5 x inter-quartile range. c Proportion of SBS5 mutations/mm2 per donor (n = 11) by country (two-sided t-test: p = 2.1 × 10−4). Tukey boxplot where lower and upper hinges = 1st and 3rd quartile, centre = median, outliers > 1.5 × inter-quartile range. d Proportion of SBS assigned to each signature, split by mutations above and below median variant allele frequency (VAF) for each country (Pearson’s chi-square UK: p < 2.2 × 10−16; SG: p = 1.3 × 10−14). e Counts of double-base substitutions (DBS) per mm2 of skin of donors from each country (UK mean = 1.08 DBS/mm2, SG mean = 0.126 DBS/mm2, two-sided Welch’s t-test: p = 2.3 × 10−3). f Count of insertions and deletions per mm2 in each donor (n = 11) by country (UK mean = 0.72 indels/mm2, SG mean = 0.37 indels/mm2, two-sided Welch’s t-test: p = 0.07). Tukey boxplot where lower and upper hinges = 1st and 3rd quartile, centre = median, outliers > 1.5 x inter-quartile range.
Extended Data Fig. 2
Extended Data Fig. 2. Mutant clone selection differs by country.
a Ratio of observed/expected non-synonymous mutations for positively selected genes by country (q < 0.01). No synonymous mutations were detected in Singaporean skin for TP53 and AJUBA, leading to high dN/dS ratios. Line drawn at y = 1. b Sizes of all clones with protein-altering mutations in the top four positively selected genes, by country (samples with known CNA removed), two-sided t-test adjusted by Bonferroni multiple test correction: p = 6 × 10−4 (NOTCH1, n = 1,020), 1.5 × 10−2 (NOTCH2, n = 390), 0.68 (FAT1, n = 432) and 1.0 (TP53, n = 366). Tukey boxplot where lower and upper hinges = 1st and 3rd quartile, centre = median, outliers > 1.5 x inter-quartile range. c Distributions of mutations across codons in TP53. The most frequently mutated codon in cancer, R248 (shown red), is the most common codon change in UK skin but is absent in Singaporean skin.
Extended Data Fig. 3
Extended Data Fig. 3. Sample mutation counts do not correlate with sequencing coverage.
Correlation between mean quality sequencing coverage per sample and the number of mutations detected for a Singapore and b UK (error bands = 95% confidence interval). Mean depth of coverage was calculated after removing off-target reads, duplicates and those with mapping quality of 25 or less and base quality of 30 or less. Samples of neither country show a correlation between depth of coverage and mutation counts (linear regression: (SG) R = 0.13, p = 0.01; (UK) R = 0.26, p = 5.8 × 10−9).

Similar articles

Cited by

References

    1. Non-melanoma Skin Cancer Incidence Trends Over Time (Cancer Research UK, 2023); https://www.cancerresearchuk.org/health-professional/cancer-statistics/s...
    1. Singapore Cancer Registry Annual Report 2019 (National Registry of Diseases Office, 2022); https://www.nrdo.gov.sg/docs/librariesprovider3/default-document-library...
    1. Venables ZC, et al. Epidemiology of basal and cutaneous squamous cell carcinoma in the U.K. 2013-15: a cohort study. Br. J. Dermatol. 2019;181:474–482. doi: 10.1111/bjd.17873. - DOI - PMC - PubMed
    1. Gies P, et al. Global solar UV index: Australian measurements, forecasts and comparison with the UK. Photochem. Photobiol. 2004;79:32–39. doi: 10.1111/j.1751-1097.2004.tb09854.x. - DOI - PubMed
    1. Nyiri P. Sun protection in Singapore’s schools. Singapore Med. J. 2005;46:471–475. - PubMed

Publication types