

Classification of mild Parkinson's disease: data augmentation of time-series gait data obtained via inertial measurement units
- PMID: 37537260
- PMCID: PMC10400620
- DOI: 10.1038/s41598-023-39862-4
Classification of mild Parkinson's disease: data augmentation of time-series gait data obtained via inertial measurement units
Abstract
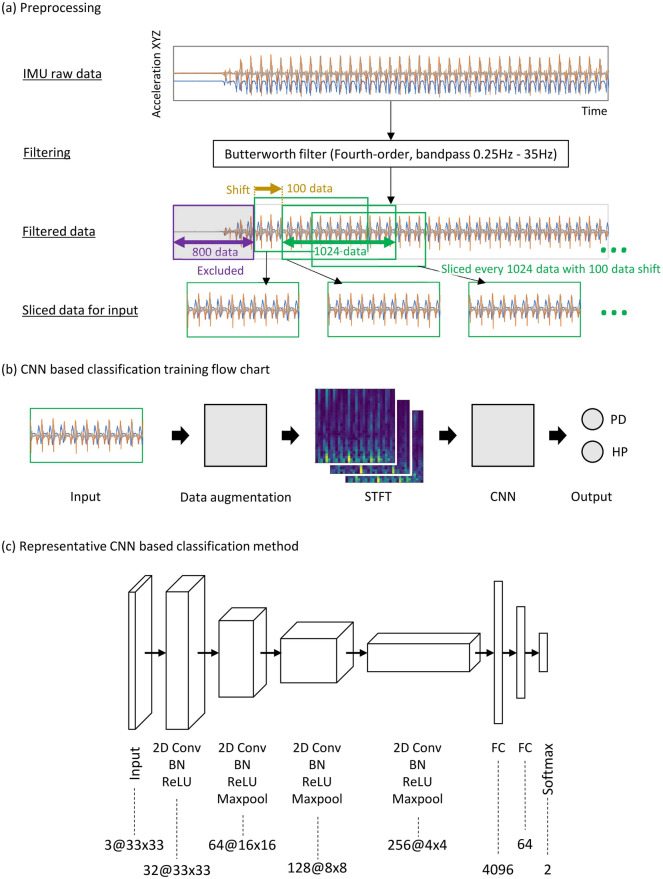
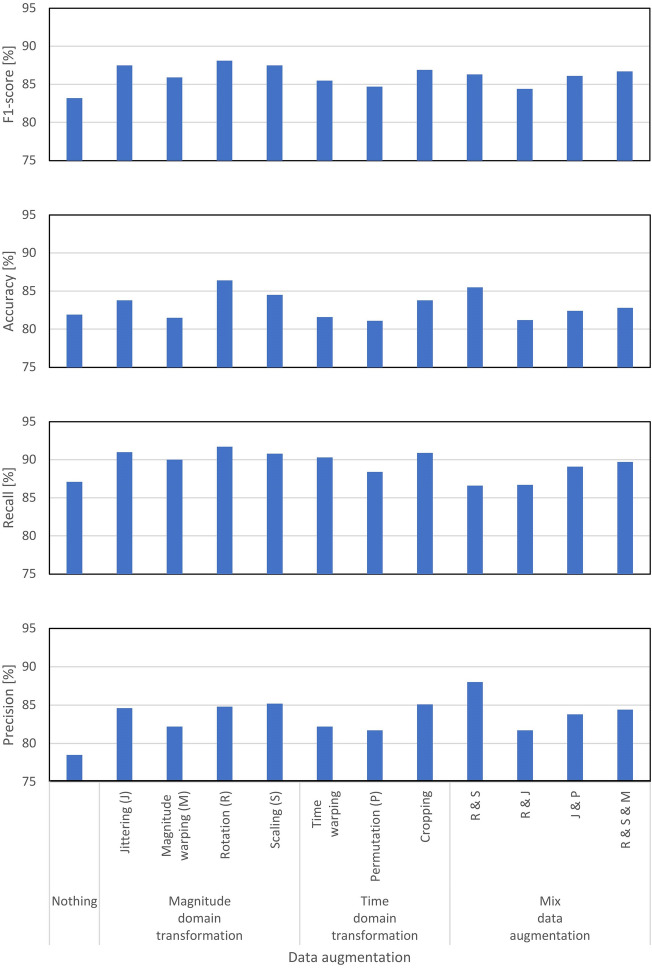
Data-augmentation methods have emerged as a viable approach for improving the state-of-the-art performances for classifying mild Parkinson's disease using deep learning with time-series data from an inertial measurement unit, considering the limited amount of training datasets available in the medical field. This study investigated effective data-augmentation methods to classify mild Parkinson's disease and healthy participants with deep learning using a time-series gait dataset recorded via a shank-worn inertial measurement unit. Four magnitude-domain-transformation and three time-domain-transformation data-augmentation methods, and four methods involving mixtures of the aforementioned methods were applied to a representative convolutional neural network for the classification, and their performances were compared. In terms of data-augmentation, compared with baseline classification accuracy without data-augmentation, the magnitude-domain transformation performed better than the time-domain transformation and mixed-data augmentation. In the magnitude-domain transformation, the rotation method significantly contributed to the best performance improvement, yielding accuracy and F1-score improvements of 5.5 and 5.9%, respectively. The augmented data could be varied while maintaining the features of the time-series data obtained via the sensor for detecting mild Parkinson's in gait; this data attribute may have caused the aforementioned trend. Notably, the selection of appropriate data extensions will help improve the classification performance for mild Parkinson's disease.
© 2023. Springer Nature Limited.
Conflict of interest statement
The authors declare no competing interests.
Figures

Similar articles
-
Efficient quantification of Parkinson's disease severity using augmented time-series data.PLoS One. 2025 Apr 2;20(4):e0319826. doi: 10.1371/journal.pone.0319826. eCollection 2025. PLoS One. 2025. PMID: 40173391 Free PMC article.
-
Deep neural networks for wearable sensor-based activity recognition in Parkinson's disease: investigating generalizability and model complexity.Biomed Eng Online. 2024 Feb 9;23(1):17. doi: 10.1186/s12938-024-01214-2. Biomed Eng Online. 2024. PMID: 38336781 Free PMC article.
-
Real-time detection of freezing of gait in Parkinson's disease using multi-head convolutional neural networks and a single inertial sensor.Artif Intell Med. 2023 Jan;135:102459. doi: 10.1016/j.artmed.2022.102459. Epub 2022 Nov 24. Artif Intell Med. 2023. PMID: 36628783
-
Convolutional Neural Network for Freezing of Gait Detection Leveraging the Continuous Wavelet Transform on Lower Extremities Wearable Sensors Data.Annu Int Conf IEEE Eng Med Biol Soc. 2020 Jul;2020:5410-5415. doi: 10.1109/EMBC44109.2020.9175687. Annu Int Conf IEEE Eng Med Biol Soc. 2020. PMID: 33019204
-
Implementation of a Deep Learning Algorithm Based on Vertical Ground Reaction Force Time-Frequency Features for the Detection and Severity Classification of Parkinson's Disease.Sensors (Basel). 2021 Jul 31;21(15):5207. doi: 10.3390/s21155207. Sensors (Basel). 2021. PMID: 34372444 Free PMC article.
Cited by
-
Smartphone-derived multidomain features including voice, finger-tapping movement and gait aid early identification of Parkinson's disease.NPJ Parkinsons Dis. 2025 May 5;11(1):111. doi: 10.1038/s41531-025-00953-w. NPJ Parkinsons Dis. 2025. PMID: 40325040 Free PMC article.
-
A review of machine learning and deep learning for Parkinson's disease detection.Discov Artif Intell. 2025;5(1):24. doi: 10.1007/s44163-025-00241-9. Epub 2025 Mar 12. Discov Artif Intell. 2025. PMID: 40092968 Free PMC article. Review.
-
Adaptive Detection in Real-Time Gait Analysis through the Dynamic Gait Event Identifier.Bioengineering (Basel). 2024 Aug 8;11(8):806. doi: 10.3390/bioengineering11080806. Bioengineering (Basel). 2024. PMID: 39199764 Free PMC article.
-
Optimizing Rare Disease Gait Classification through Data Balancing and Generative AI: Insights from Hereditary Cerebellar Ataxia.Sensors (Basel). 2024 Jun 3;24(11):3613. doi: 10.3390/s24113613. Sensors (Basel). 2024. PMID: 38894404 Free PMC article.
-
Convolutional neural network based detection of early stage Parkinson's disease using the six minute walk test.Sci Rep. 2024 Sep 30;14(1):22648. doi: 10.1038/s41598-024-72648-w. Sci Rep. 2024. PMID: 39349539 Free PMC article.
References
-
- Fahn S, Elton RL. Unified Parkinson’s disease rating scale. In: Fahn S, Marsden CD, Calne D, Goldstein M, editors. Recent Developments in Parkinson’s Disease. Macmillan Healthcare Information; 1987.
Publication types
MeSH terms
LinkOut - more resources
Full Text Sources
Medical
