. 2023 Sep;30(9):2078-2091.
doi: 10.1038/s41418-023-01191-4. Epub 2023 Aug 3.

A novel auxin-inducible degron system for rapid, cell cycle-specific targeted proteolysis

Affiliations

A novel auxin-inducible degron system for rapid, cell cycle-specific targeted proteolysis

Marina Capece et al. Cell Death Differ. 2023 Sep.

Abstract

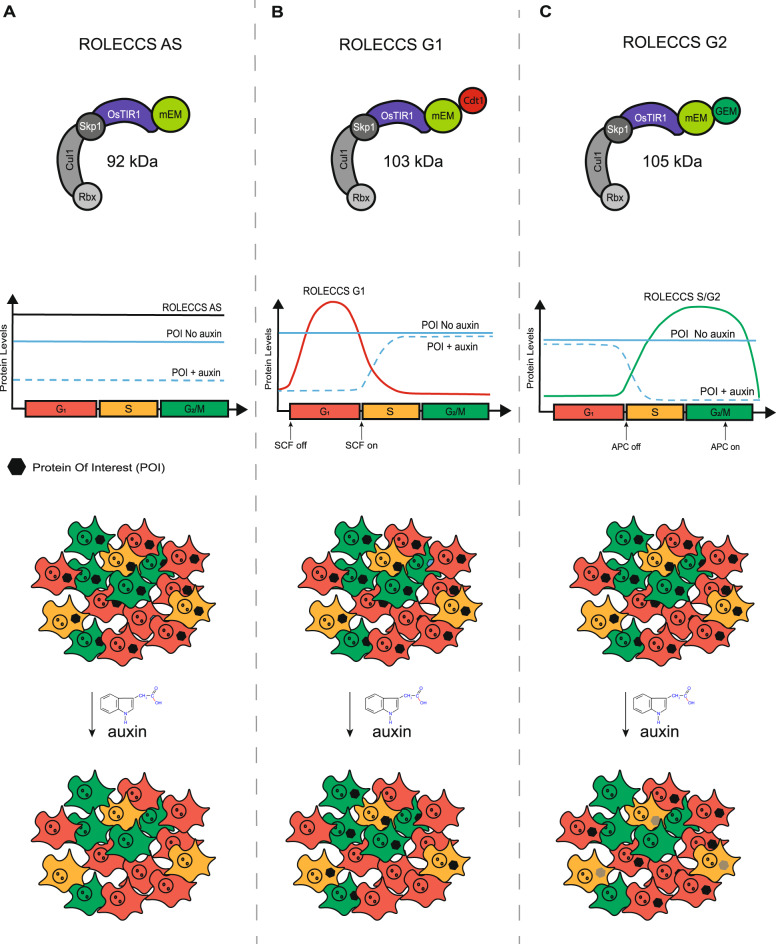
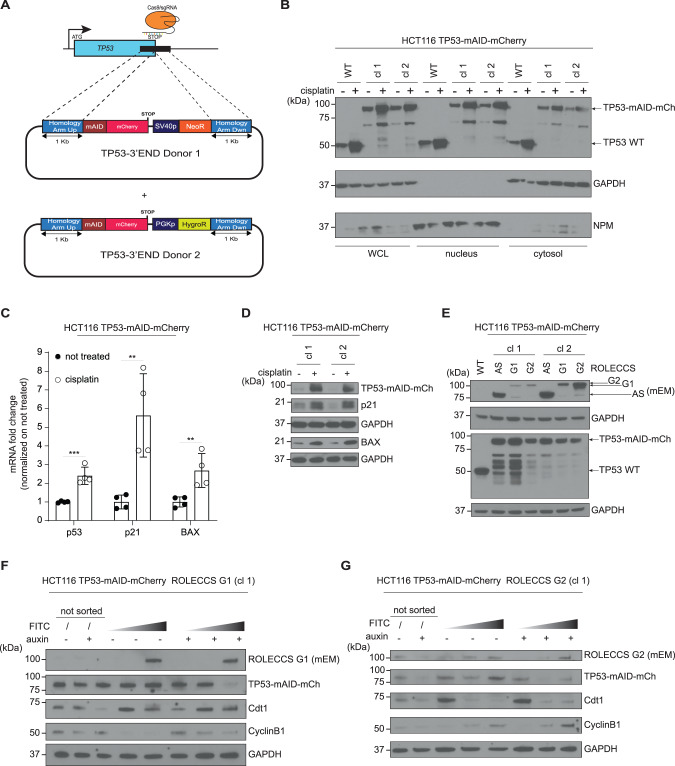
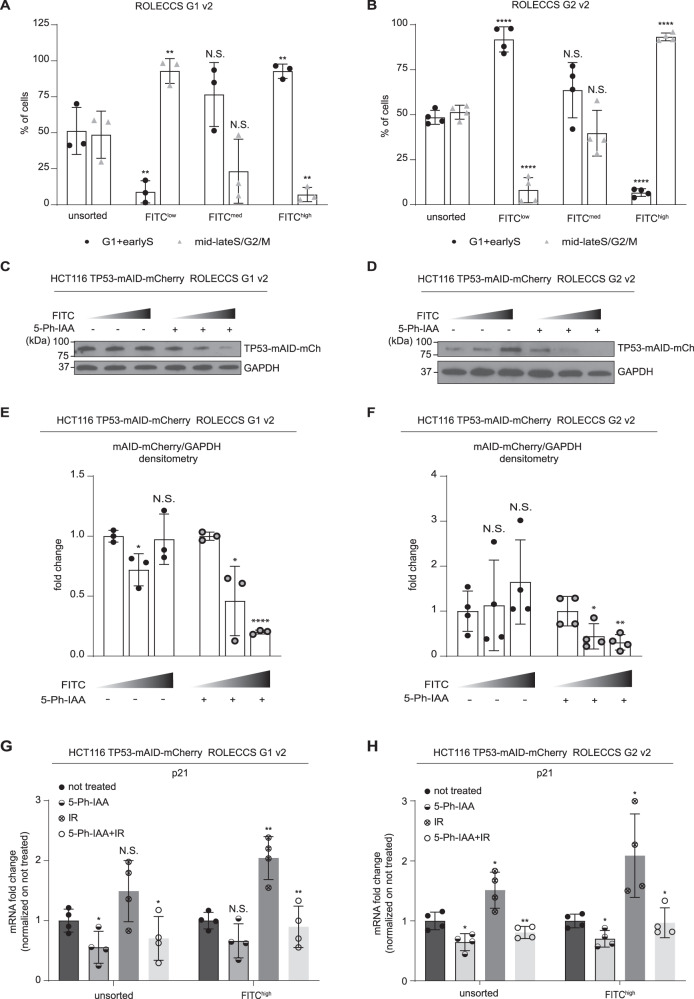
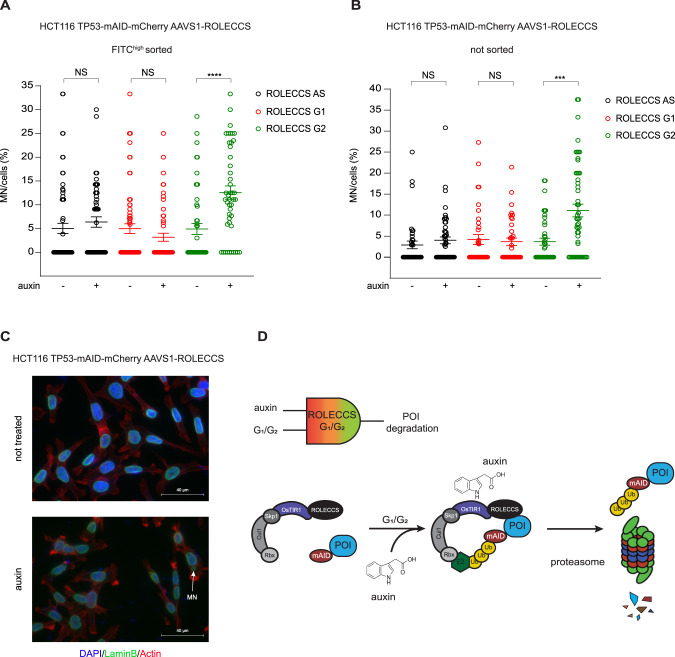
The discrimination of protein biological functions in different phases of the cell cycle is limited by the lack of experimental approaches that do not require pre-treatment with compounds affecting the cell cycle progression. Therefore, potential cycle-specific biological functions of a protein of interest could be biased by the effects of cell treatments. The OsTIR1/auxin-inducible degron (AID) system allows "on demand" selective and reversible protein degradation upon exposure to the phytohormone auxin. In the current format, this technology does not allow to study the effect of acute protein depletion selectively in one phase of the cell cycle, as auxin similarly affects all the treated cells irrespectively of their proliferation status. Therefore, the AID system requires coupling with cell synchronization techniques, which can alter the basal biological status of the studied cell population, as with previously available approaches. Here, we introduce a new AID system to Regulate OsTIR1 Levels based on the Cell Cycle Status (ROLECCS system), which induces proteolysis of both exogenously transfected and endogenous gene-edited targets in specific phases of the cell cycle. We validated the ROLECCS technology by down regulating the protein levels of TP53, one of the most studied tumor suppressor genes, with a widely known role in cell cycle progression. By using our novel tool, we observed that TP53 degradation is associated with increased number of micronuclei, and this phenotype is specifically achieved when TP53 is lost in S/G2/M phases of the cell cycle, but not in G1. Therefore, we propose the use of the ROLECCS system as a new improved way of studying the differential roles that target proteins may have in specific phases of the cell cycle.


Conflict of interest statement

The authors declare no competing interests.

Figures

Fig. 1
Fig. 1. Schematic representation of the design for Regulated OsTIR1 Levels of Expression based on the Cell Cycle Status (ROLECCS) variants.
A OsTIR1-mEmerald protein (asynchronous ROLECCS, ROLECCS AS, 92 KDa) is stably expressed throughout the cell cycle. Upon auxin treatment, OsTIR1 enzymatic activity elicits the degradation of the mAID-tagged protein of interest (POI) in any cell, independently of the cell cycle status. B The expression of the ROLECCS G1 variant (OsTIR1-mEmerald-Cdt1, 103 KDa) is restricted to the G1/early S phase by the presence of the Cdt1 tag, when the SCFSkp2 E3 ligase activity is off. This, in turn, leads to auxin-dependent ubiquitylation and proteasome degradation of mAID-tagged POIs. In cells transitioning during S, G2 and M phases, SCFSkp2 activity is naturally restored, leading to ROLECCS G1 degradation by ubiquitylation, and stabilization of the POI even in the presence of auxin. C The Geminin tag of the ROLECCS G2 variant (OsTIR1-mEmerald-GEM, 105 KDa) ensures its restricted expression during the late S-G2-M phase, as APCCdh1-mediated ubiquitylation and degradation is rapidly triggered during M/G1 transition. Therefore, auxin treatment induces degradation of the POI exclusively in cells going through the late S-G2-M phase of the cell cycle.
Fig. 2
Fig. 2. Characterization of ROLECCS AS, G1, and G2 cellular distribution and during cell-cycle progression.
A, B Representative WB analysis of nuclear/cytoplasmic distribution of ROLECCS proteins upon transient (72 h) transfection (A) or AAVS1 integration (B) in HEK-293T cells. ROLECCS AS, ROLECCS G1, ROLECCS G2 (see main text) were detected using anti-GPF antibody that recognizes the mEmerald tag of the proteins (see arrows). Nucleophosmin (NPM) and GAPDH antibodies were used as loading and purity control for nuclear and cytoplasmic soluble protein fractions, respectively. Not transfected (NT) or wild-type (WT) HEK-293T were used as negative control. WCL indicates Whole Cell Lysate. C Direct fluorescence images of HEK-293T AAVS1-integrated clones. DAPI staining (blue) was used to label nuclei, mEmerald (green) signal was detected from ROLECCS variants (AS, G1, G2). D Time-frame pictures of duplicating HEK-293T AAVS1-integrated clones. Note the cell cycle-dependent changes in fluorescence of specific ROLECCS variants (AS, G1, G2) (green). Arrows indicate cells that are completing a cell cycle. E, G Cell-cycle distribution histograms of HEK-293T AAVS1-integrated clones expressing ROLECCS G1 and G2, obtained by propidium iodide staining and flow cytometry analysis. Red peaks indicate G1 and G2 phase, stripes indicate S phase. Cells were prior sorted based on FITC levels (FITClow, FITCmed, FITChigh), as described in Supplementary Fig. 2. Not sorted (unsorted) populations are reported for comparison. Data are representative of four independent experiments (n = 4). F, H Quantification of experiments reported in E and G. FITClow, FITCmed, FITChigh subpopulations were analyzed for cells composition as percentage of cells in G1+earlyS and cells in mid-lateS/G2/M, using ModFit software v5.0. Error bars indicate mean ± SD. ***p < 0.001, N.S. not significant. Statistics (two-tailed t-test) is calculated versus respective unsorted populations. Data are the average of four independent experiments (n = 4).
Fig. 3
Fig. 3. Biological activity of ROLECCS proteins.
AC Schematic representation of lentiviral vectors (pLentiROLECCS AS, G1, and G2) and their corresponding translated proteins with respective molecular weight. D WB analysis of transient (24 h) and stable transfection (bulk population) of pLentiROLECCS vectors in HEK-293T cells. Anti-GPF antibody, recognizing the mEmerald tag (mEM) of the proteins, was used to detect ROLECCS proteins (see arrows), anti-mCherry antibody was used to detect mAID-mCherry. Not transfected HEK-293T (NT) and GAPDH were used as negative and loading control respectively. E Densitometric quantification of mAID-mCherry normalized on GAPDH intensity of WB analyses of HEK-293T cells transfected with pLentiROLECCS G1, presented in Supplementary Fig. 3 B (clone 1) and C (clone 2). Relative quantification versus FITClow sorted population is reported. Error bars indicate mean ± SD. ***p < 0.001, N.S. not significant. Statistics (two-tailed t-test) is calculated versus FITClow sorted population. Data are representative of four independent experiments (n = 4). F Densitometric quantification of mAID-mCherry normalized on GAPDH intensity of WB analyses of HEK-293T cells transfected with pLentiROLECCS G2, presented in Supplementary Fig. 3 D (clone 1) and E (clone 2). Relative quantification versus FITClow sorted population is reported. Error bars indicate mean ± SD. *p < 0.05, N.S. not significant. Statistics (two-tailed t-test) is calculated versus FITClow sorted population. Data are representative of three independent experiments (n = 3). G, H Live-cell confocal microscopy imaging on MCF 10a normal breast epithelial cells, transduced with LentiROLECCS G1 (G) or LentiROLECCS G2 (H). Upon 5-Ph-IAA cells treatment, red fluorescent signal (mAID-mCherry) faded away before the green-fluorescent signal (ROLECCS G1, panel G and ROLECCS G2, panel H) could be detected. Hoechst staining (greyscale) of DNA content was performed to follow cell cycle division, confirming ROLECCS G1 expression increase after completion of cell division (G) and ROLECCS G2 detection during the progression through S and G2 phase (H). G Interval between still images is 100 min. Single cell traces (mAID-mCherry as red trace, ROLECCS G1 as green trace) of three different cells are representative and do not correspond with the images above. (H) Interval between still images is 120 min. Single cell traces (mAID-mCherry as red trace, ROLECCS G2 as green trace) are representative and do not correspond with the images above.
Fig. 4
Fig. 4. ROLECCS system downregulates endogenous proteins in a cell cycle-specific fashion.
A Diagram of TP53 gene editing strategy in HCT116 via CRISPR/Cas9-mediated knock-in. The stop codon was replaced by mAID-mCherry fusion cassette, cloned between 1-kb long Homology Arms. To achieve targeting of both TP53 alleles, two donor plasmids (TP53-3’END Donor 1 and Donor 2) were used, bearing Neomycin (NeoR) or Hygromycin (HygroR) resistance genes, respectively. The antibiotic resistance genes are under the transcriptional control of independent promoters (SV40 and PGK, respectively). B WB analysis of nuclear/cytoplasmic distribution of TP53 protein (TP53-mAID-mCherry, 87 kDa) in HCT116 TP53-mAID-mCherry clone 1 (cl 1) and clone 2 (cl 2). HCT116 wild type (WT) were loaded as control for TP53 activation upon cisplatin (20 µM) treatment for 48 h. NPM and GAPDH were used as purity and loading controls for nuclear and cytoplasmic soluble protein fractions, respectively. WCL indicates Whole Cell Lysate. Images are representative of two independent experiments. C Messenger RNA fold change of TP53, p21 and BAX genes in HCT116 TP53-mAID-mCherry cells treated with cisplatin (20 µM for 24 h) quantified by Real Time PCR. GAPDH gene was used as housekeeping control and data were normalized on not treated samples. Error bars indicate mean ± SD. ***p < 0.001, **p < 0.01, N.S. not significant. Statistics (two-tailed t-test) is calculated versus not treated. Experiment was repeated twice on two independent clones (n = 4). D WB analysis of cisplatin-induced TP53-mAID-mCherry (87 kDa), p21 (21 kDa) and BAX (21 kDa) proteins increase in HCT116 TP53-mAID-mCherry. Cells were treated with 20 µM cisplatin and collected for protein extraction at 48 h. Lysates were loaded in duplicate to probe membranes with antibodies against proteins with same molecular weight, GAPDH was used as loading control. Two independent HCT116 TP53-mAID-mCherry clones (cl 1, cl 2) were analyzed. Images are representative of two independent experiments. E WB analysis of characterization of HCT116 TP53-mAID-mCherry with AAVS1-integrated ROLECCS variants (AS/G1/G2). ROLECCS AS, ROLECCS G1, and ROLECCS G2 were detected using anti-GPF antibody (see arrows), TP53 wild type (WT) and TP53-mAID-mCherry (TP53-mAID-mCh) were detected using anti-TP53 antibody. GAPDH was used as loading control. HCT116 wild type (WT) were loaded for comparison. Two independent HCT116 TP53-mAID-mCherry ROLECCS clones (cl 1, cl 2) were analyzed. Images are representative of two independent experiments. F WB analysis of HCT116 TP53-mAID-mCherry AAVS1-edited with ROLECCS G1, clone 1 (cl 1) after sorting. Cells were treated with auxin or left untreated for one hour and then sorted for FITC intensity (ascending grey gradient triangle). Membrane was probed with anti-GFP antibody (reecognizing mEmerald, mEM) for ROLECCS G1 detection and mCherry antibody for TP53-mAID-mCherry (TP53-mAID-mCh) detection. Cdt1 and CyclinB1 were used as G1 phase and G2 phase specific markers, respectively. GAPDH was used as loading control. Not sorted (unsorted) cells were loaded for comparison. G WB analysis of HCT116 TP53-mAID-mCherry AAVS1-edited with ROLECCS G2, clone 1 (cl 1) after sorting. Treatments, sortings, and antibodies are the same as shown in (F). Blots are representative of two independent experiments.
Fig. 5
Fig. 5. Cell cycle phase-specific expression and functionality of ROLECCS v2 proteins.
A, B Quantification of cell-cycle distribution experiments of HCT116 TP53-mAID-mCherry AAVS1-integrated clones expressing ROLECCS v2 G1 (A) and G2 (B). Cells were prior sorted based on FITC levels (FITClow, FITCmed, FITChigh), as described in Supplementary Fig. 8, and then stained with propidium iodide as described in Methods. FITClow, FITCmed, FITChigh subpopulations were analyzed for cells composition as percentage of cells in G1+earlyS and cells in mid-lateS/G2/M, using ModFit software v5.0. Not sorted (unsorted) populations are reported for comparison. Data are the average of three independent experiments (n = 3, Fig. 5A) and four independent experiments (n = 4, Fig. 5B). Error bars indicate mean ± SD. ****p < 0.0001, **p < 0.01, N.S. not significant. Statistics (two-tailed t-test) is calculated versus respective unsorted populations. C WB analysis of HCT116 TP53-mCherry AAVS1-edited with ROLECCS v2 G1 after sorting. Cells were treated with 1 µM 5-Ph-IAA or left untreated for 1 h and then sorted for increasing FITC intensity (ascending grey gradient triangle). Membrane was probed with anti-GFP antibody, that recognizes the mEmerald tag (mEM) of the protein, was used for ROLECCS G1 detection and mCherry antibody for TP53-mAID-mCherry (TP53-mAID-mCh) detection. GAPDH was used as loading control. D WB analysis of HCT116 TP53-mCherry AAVS1-edited with ROLECCS v2 G2 after sorting. Treatments, sortings and antibodies are the same as (C). E Densitometric quantification of TP53-mAID-mCherry normalized on GAPDH intensity of WB analyses. Relative quantification versus FITClow sorted population is reported. Densitometric analyses are the average of at least one experiment on 2 different clones (n = 3). Error bars indicate mean ± SD. ****p < 0.0001, *p < 0.05, N.S. not significant. Statistics (two-tailed t-test) is calculated versus respective FITClow sorted population. F Densitometric quantification performed as in (E). Error bars indicate mean ± SD. **p < 0.01, *p < 0.05, N.S. not significant. Statistics (two-tailed t-test) is calculated versus respective FITClow sorted population (n = 4). G, H Messenger RNA fold changes of p21 gene in HCT116 TP53-mAID-mCherry AAVS1-integrated clones expressing ROLECCS v2 G1 (G) and G2 (H) quantified by Real Time PCR. Cells were treated with 5-Ph-IAA or left untreated for one hour. Cells were then exposed to ionizing radiation or not with 5 Gy. After two hours from radiation, cells were sorted based on FITC levels (FITClow, FITCmed, FITChigh), as described in Supplementary Fig. 8, and collected for RNA extraction. OAZ1 gene was used as housekeeping control and data were normalized on not treated samples. Error bars indicate mean ± SD. **p < 0.01, *p < 0.05, N.S. not significant. Statistics (two-tailed t-test) is calculated versus not treated. Experiment was repeated twice on two independent clones (n = 4).
Fig. 6
Fig. 6. Micronuclei accumulation upon cell cycle phase-specific TP53 abrogation.
A HCT116 TP53-mAID-mCherry ROLECCS AS, G1, and G2 were treated with auxin or left untreated for 1 h and then FITChigh population was sorted and plated on glass coverslips in the presence of auxin or medium for 24 h before fixation and IF staining for Lamin B. Dot plot graph represents percentage of micronucleated HCT116 TP53-mAID-mCherry ROLECCS cells with micronuclei per field. B Asynchronously growing HCT116 TP53-mAID-mCherry ROLECCS AS, G1, and G2 were seeded on glass coverslips for 24 h, then treated with auxin or left untreated for 24 h before fixation and IF staining. Dot plot graph representing percentage of cells with micronuclei per field. Error bars in A and B indicate mean ± SD. ****p < 0.0001, ***p < 0.001, N.S. not significant. Statistics (two-tailed t-test) is calculated versus respective not treated. Data represent four independent experiments. C Representative images of micronuclei immunofluorescence staining in HCT116 TP53-mAID-mCherry ROLECCS cells. Micronuclei (MN, white arrow) are identified as separate extra-nuclear structures with rounded shape, positive for DAPI (blue) and encased by nuclear envelope positive to laminin B1 staining (green). Phalloidin-iFluor 647 staining (red) was used to stain actin, to facilitate single cell identification. D Schematic description of the ROLECCS system for cell cycle-specific targeted proteolysis. The ROLECCS system performs a Boolean logic computation. The contemporary presence of auxin and appropriate phase of the cell cycle are both simultaneously required to lead to targeted protein degradation. ROLECCS G1 and G2 are stable only through specific phases of the cell cycle (G1/early S for ROLECCS G1, late S/G2/M for ROLECCS G2), therefore their biological activity is restricted to those phases. However, auxin is required to trigger OsTIR1-mediated protein ubiquitylation, allowing proteasomal degradation of the POI only “on demand”, and only in the appropriate phase of the cell cycle.

References

    1. Schafer KA. The cell cycle: a review. Vet Pathol. 1998;35:461–78. doi: 10.1177/030098589803500601. - DOI - PubMed
    1. Alberts B, Johnson A, Lewis J, Raff M, Roberts K, Walter P. An overview of the cell cycle. 2002.
    1. Sclafani RA, Holzen TM. Cell cycle regulation of DNA replication. Annu Rev Genet. 2007;41:237–80. doi: 10.1146/annurev.genet.41.110306.130308. - DOI - PMC - PubMed
    1. Takeda DY, Dutta A. DNA replication and progression through S phase. Oncogene. 2005;24:2827–43. doi: 10.1038/sj.onc.1208616. - DOI - PubMed
    1. Lew D Cell Cycle. In: Encyclopedia of Genetics. Elsevier, 2001, pp 286–96.

Publication types