. 2023 Sep;5(9):1526-1543.
doi: 10.1038/s42255-023-00854-3. Epub 2023 Aug 3.

Methionine restriction-induced sulfur deficiency impairs antitumour immunity partially through gut microbiota

Affiliations

Methionine restriction-induced sulfur deficiency impairs antitumour immunity partially through gut microbiota

Ming Ji et al. Nat Metab. 2023 Sep.

Abstract

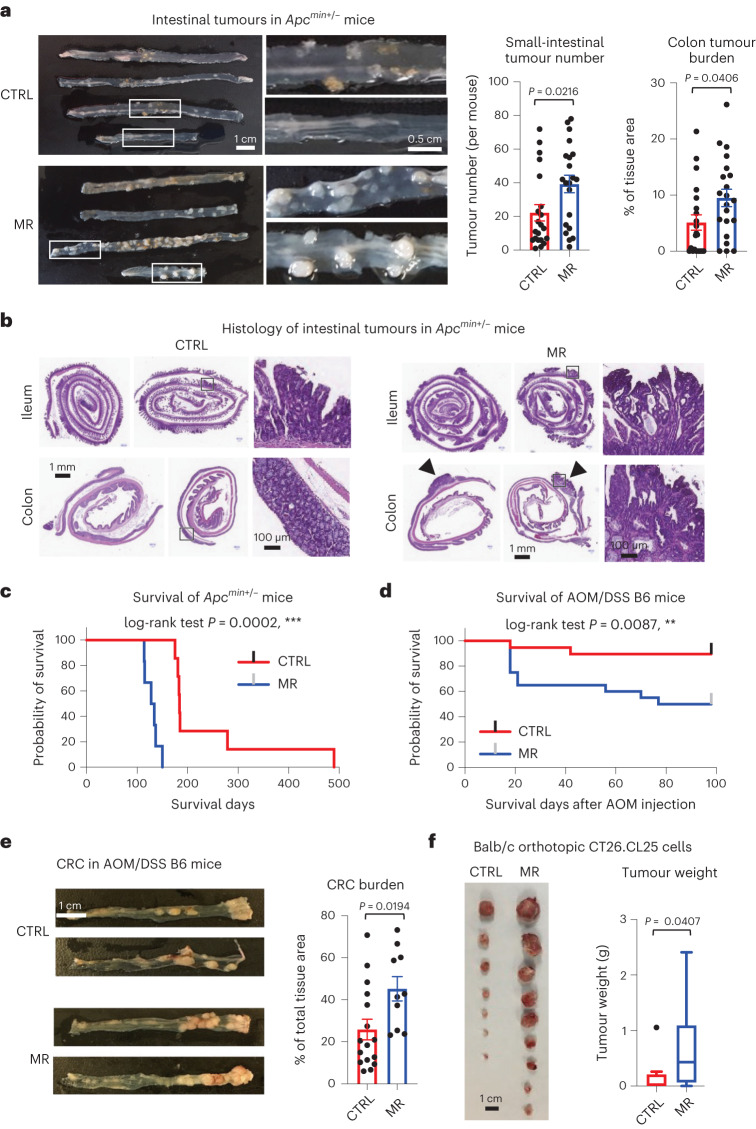
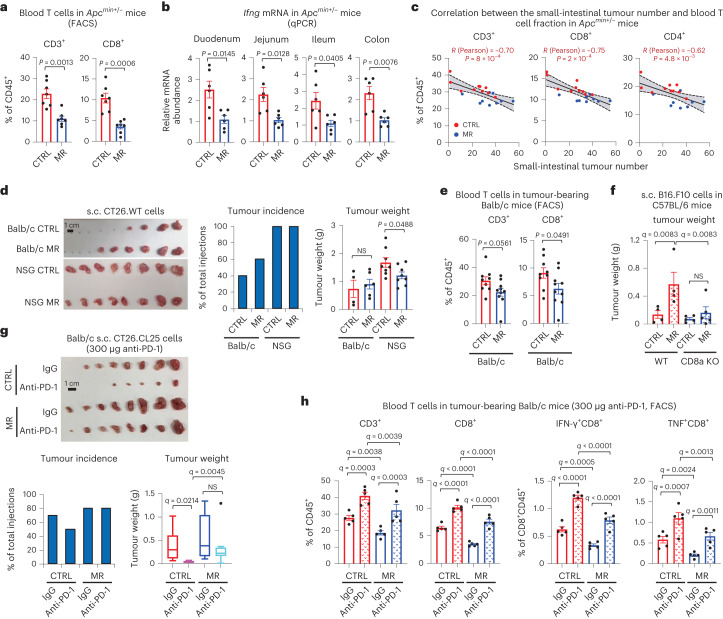
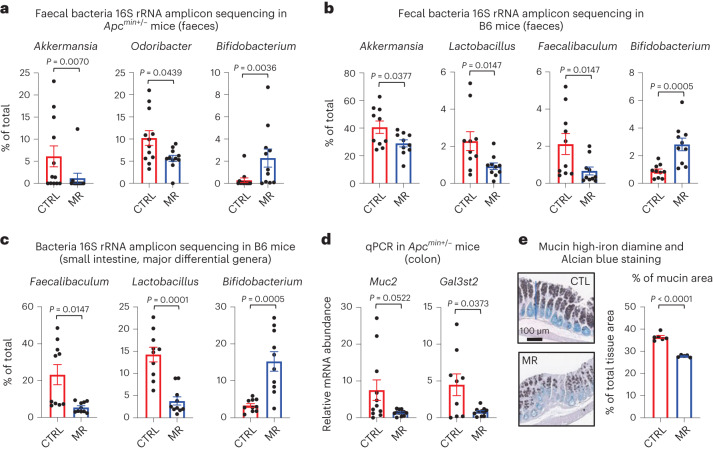
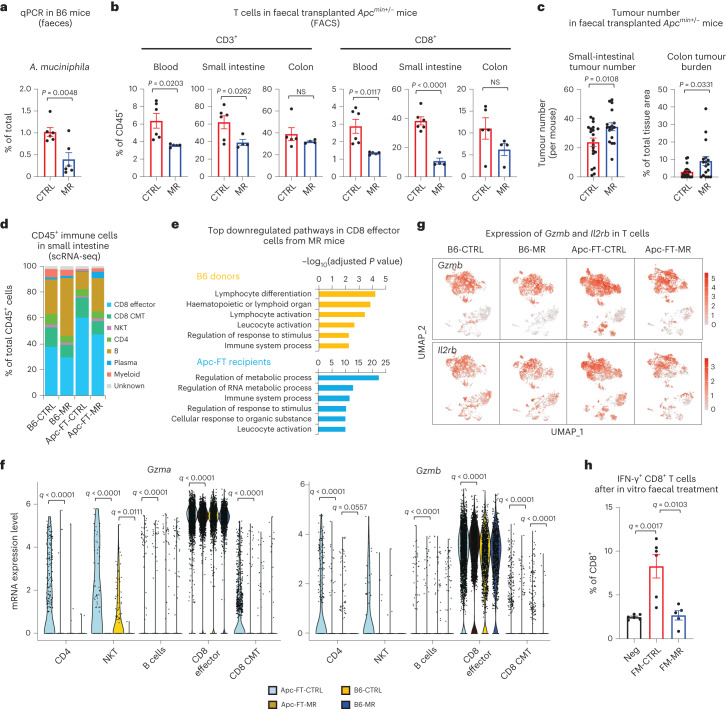
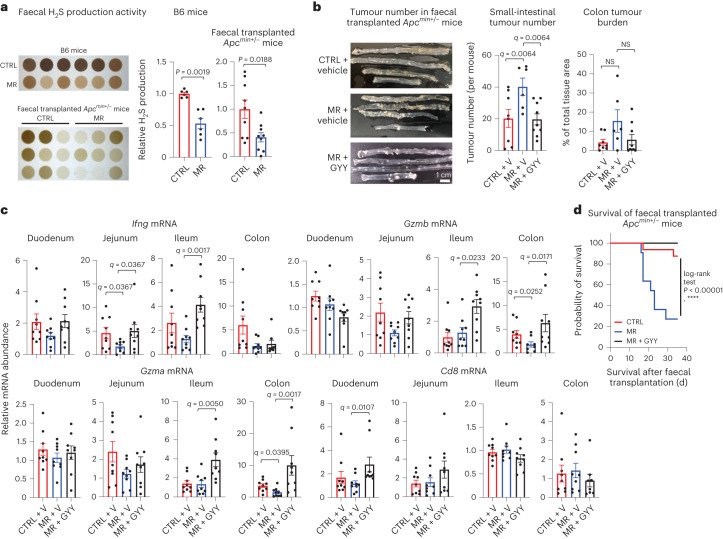
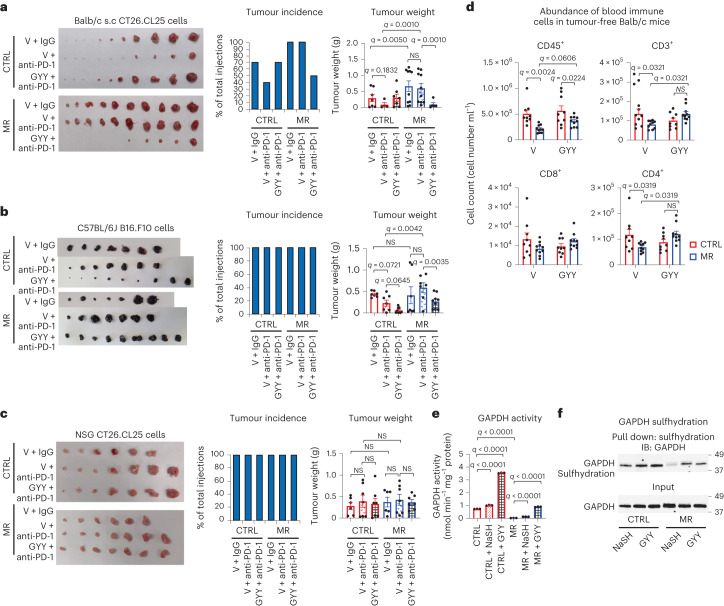
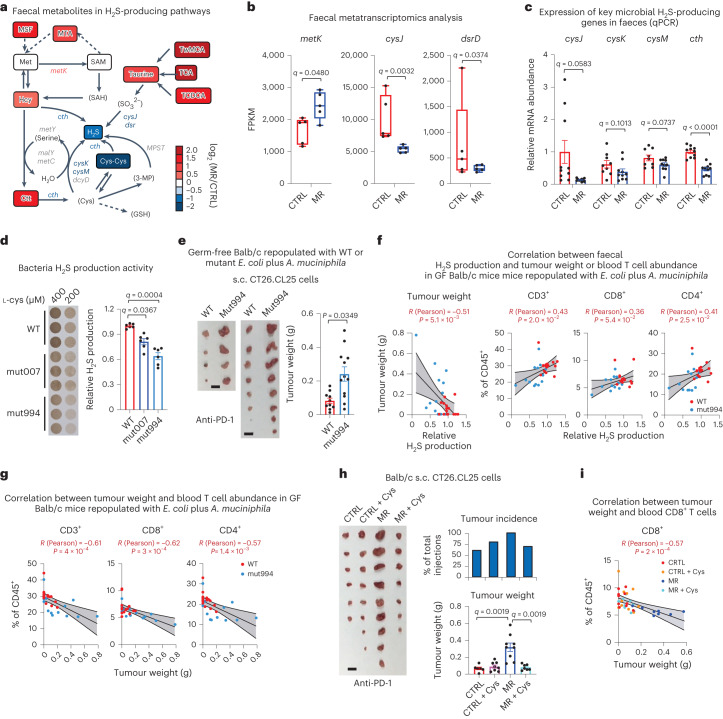
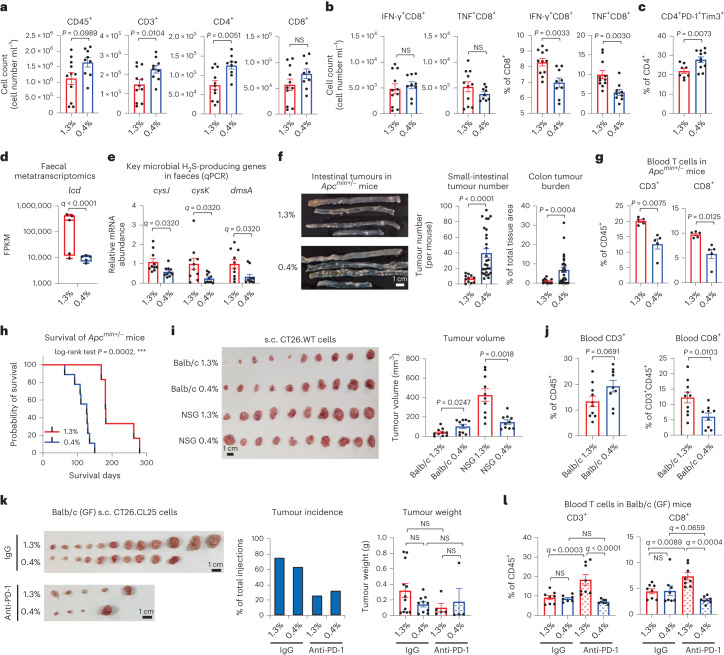
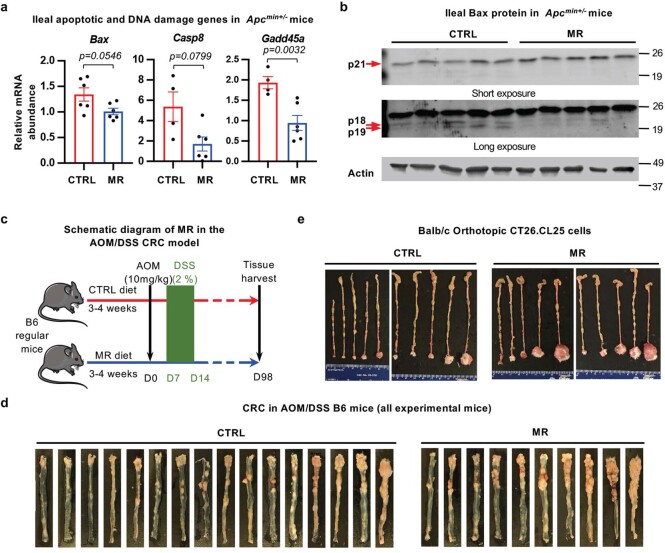
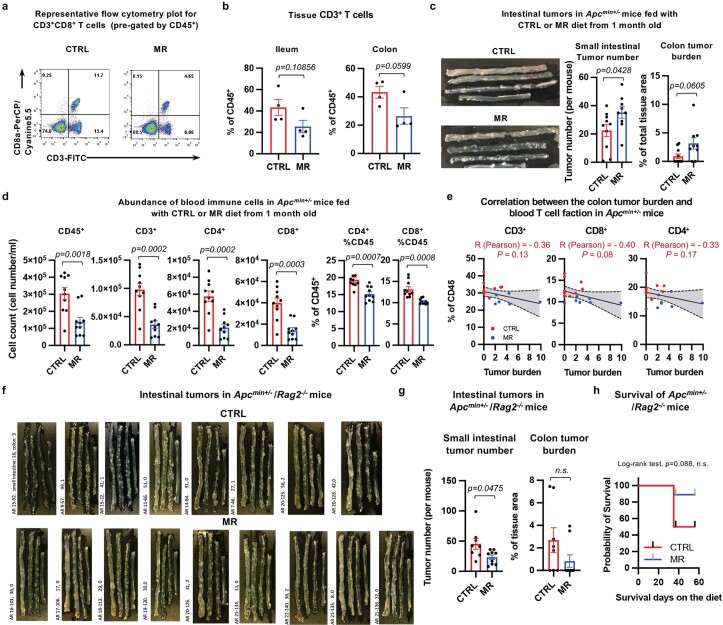
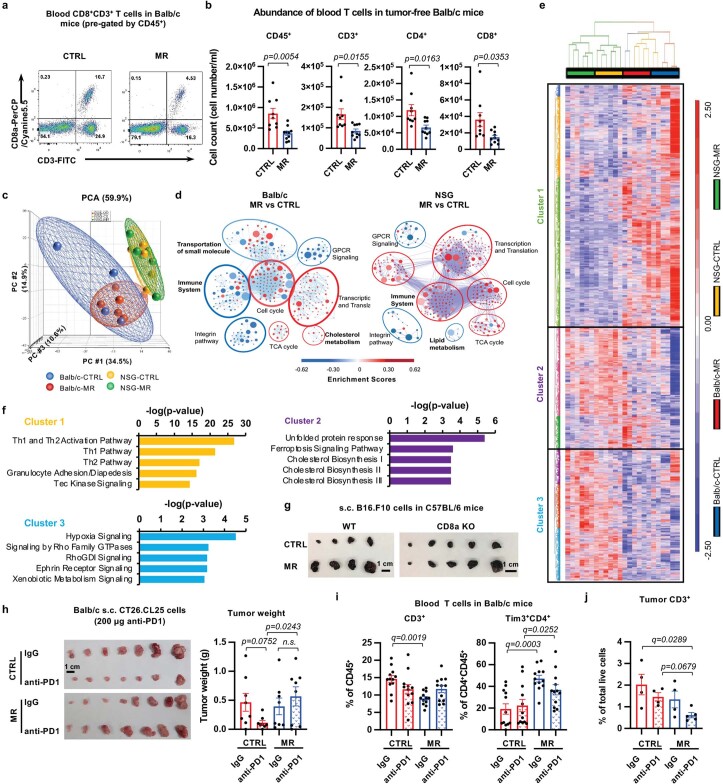
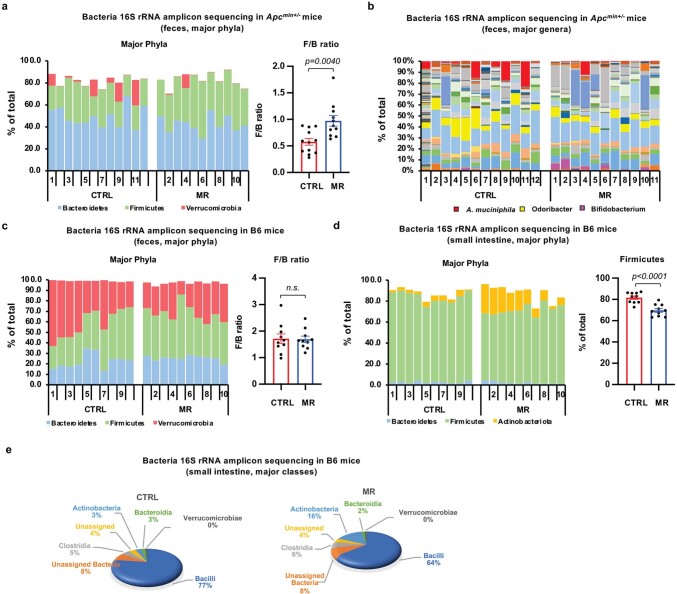
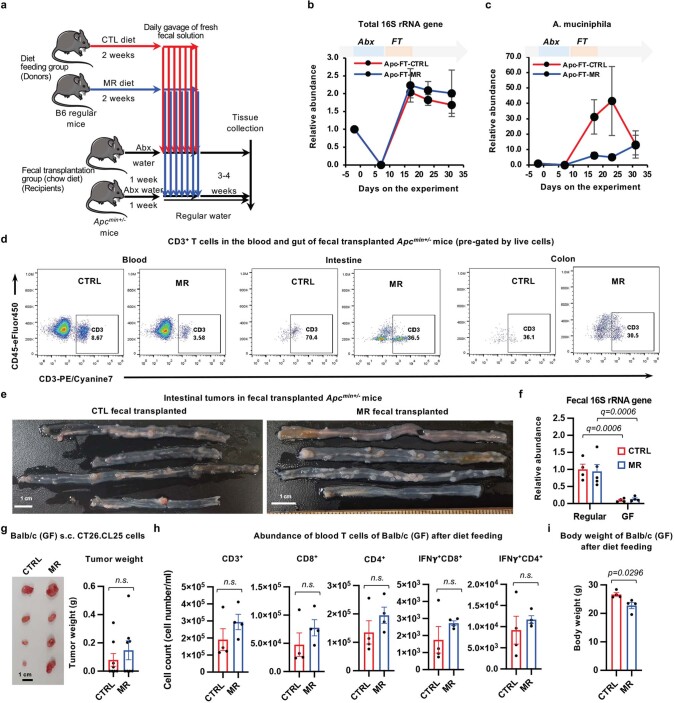
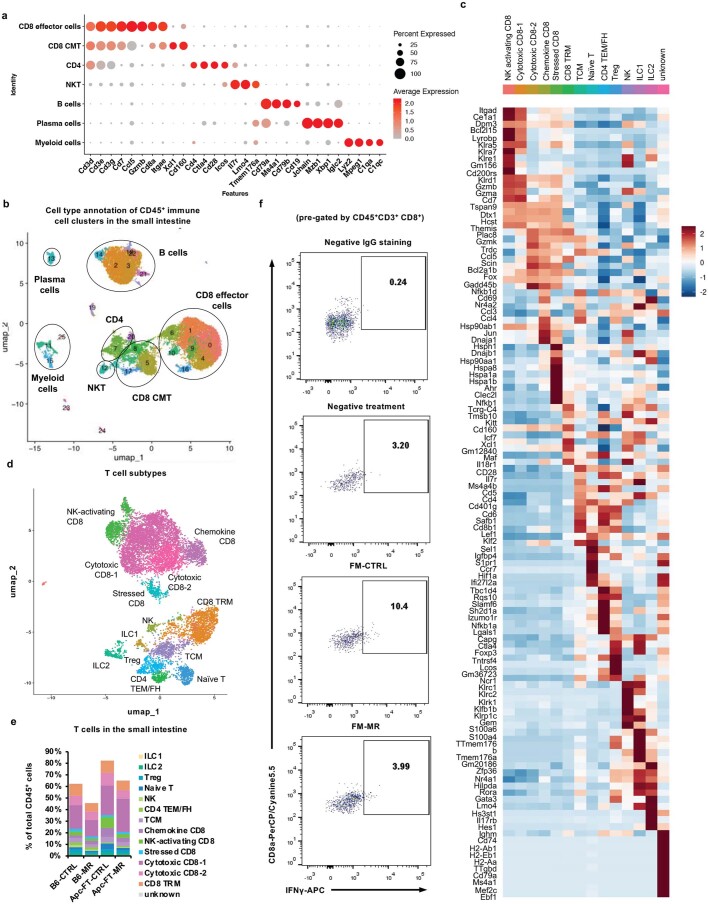
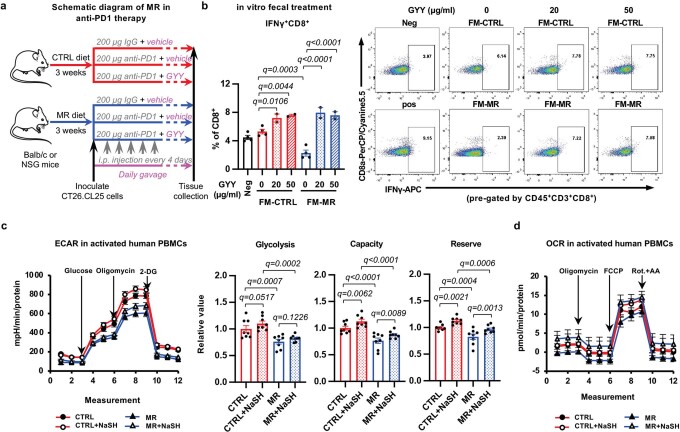
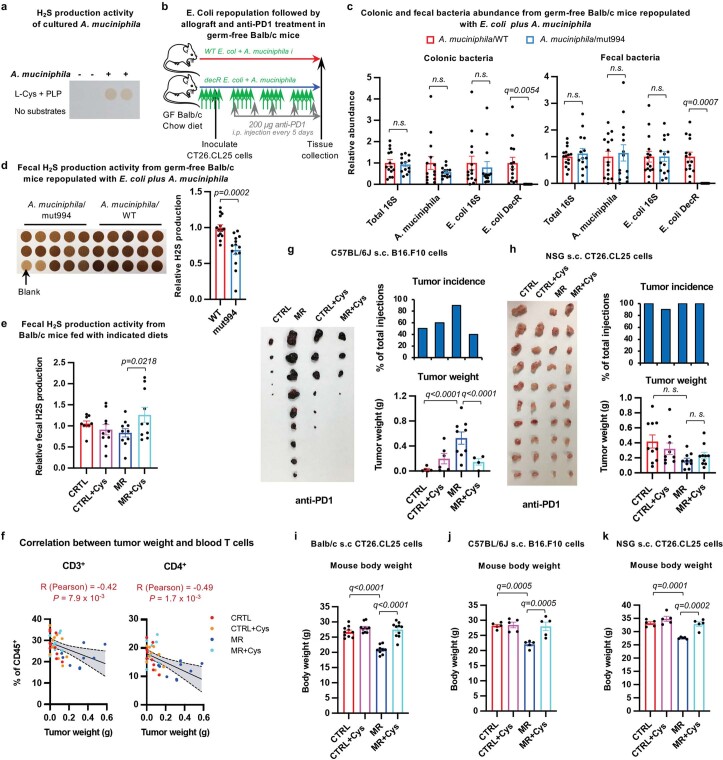
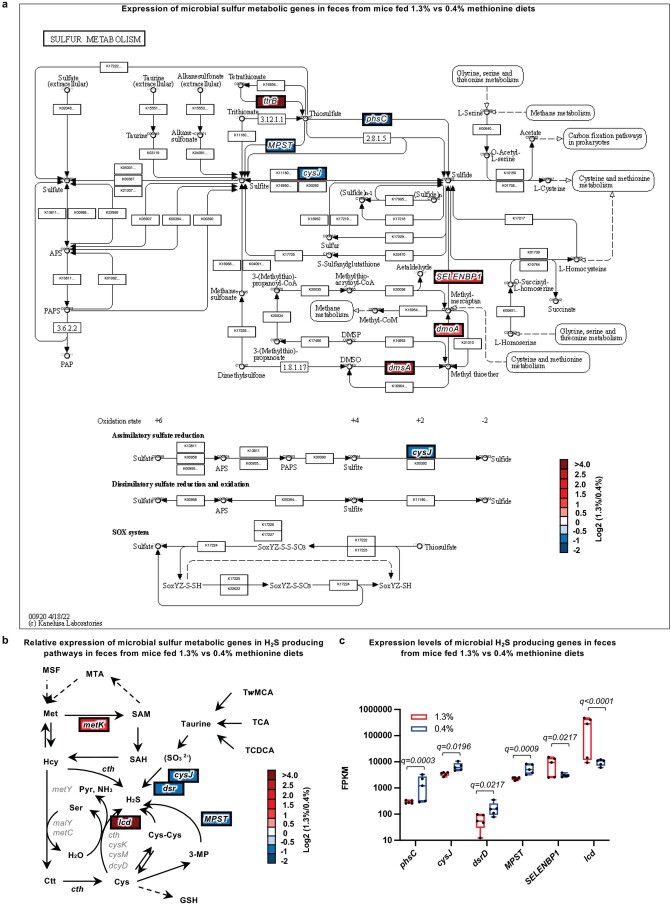
Restriction of methionine (MR), a sulfur-containing essential amino acid, has been reported to repress cancer growth and improve therapeutic responses in several preclinical settings. However, how MR impacts cancer progression in the context of the intact immune system is unknown. Here we report that while inhibiting cancer growth in immunocompromised mice, MR reduces T cell abundance, exacerbates tumour growth and impairs tumour response to immunotherapy in immunocompetent male and female mice. Mechanistically, MR reduces microbial production of hydrogen sulfide, which is critical for immune cell survival/activation. Dietary supplementation of a hydrogen sulfide donor or a precursor, or methionine, stimulates antitumour immunity and suppresses tumour progression. Our findings reveal an unexpected negative interaction between MR, sulfur deficiency and antitumour immunity and further uncover a vital role of gut microbiota in mediating this interaction. Our study suggests that any possible anticancer benefits of MR require careful consideration of both the microbiota and the immune system.


Conflict of interest statement

The authors declare no competing interests.

Figures

Fig. 1
Fig. 1. Methionine restriction enhances tumour progression in immunocompetent mice.
a, MR increased intestinal tumour growth in Apcmin+/− mice (n = 21 mice per group, two-tailed unpaired Student’s t-test; values are expressed as mean ± s.e.m.). b, Representative images of H&E-stained ileum and colon sections. Arrowheads, colonic tumours. c, MR reduced the survival of Apcmin+/− mice (n = 7 mice on CTRL diet and 6 mice on MR diet, log-rank test). d, MR sensitized C57BL/6 mice to AOM/DSS-induced death. Regular B6 mice were subjected to a modified AOM/DSS CRC procedure as described in Methods (n = 19 CTRL and 20 MR initial mice, log-rank test). e, MR pre-feeding enhanced tumour progression in C57BL/6 mice in an AOM/DSS CRC model (n = 16 mice on CTRL diet and 10 mice on the MR diet, two-tailed unpaired Student’s t-test; values are expressed as mean ± s.e.m.). f, MR pre-feeding enhanced the growth of orthotopically implanted CT26.CL25 cells in Balb/c mice (n = 10 tumours per group, two-tailed unpaired Student’s t-test, one outlier in the control group was removed by >Q3 + 3.0 times the interquartile range (IQR); box-and-whiskers plot, Tukey with whiskers: Q1 minus 1.5 times the IQR to Q3 plus 1.5 times the IQR). Details of statistical tests are in Methods. Source data
Fig. 2
Fig. 2. Methionine restriction represses T cell activation and blunts tumour response to anticancer immunotherapy in immunocompetent mice.
a, MR reduced the fraction of circulating T cells in Apcmin+/− mice (n = 7 mice per group, two-tailed unpaired Student’s t-test). b, MR reduced the expression of Ifng in all segments of the tumour-containing intestine of in Apcmin+/− mice (n = 6 mice per group, two-tailed unpaired Student’s t-test). c, The small-intestinal tumour number was negatively correlated with the abundance of circulating T cells in Apcmin+/− mice fed with CTRL or MR diets. One-month-old Apcmin+/−mice were fed with CTRL or MR diet for 3 months (n = 10 mice for CTRL diet, 9 mice for MR diet). The Pearson correlation coefficient was analysed in Prism (two tailed, 95% confidence intervals are labelled). d, The impact of MR on tumour incidence and growth was dependent on the status of host immune system (n = 10 tumours per group for Balb/c mice; 8 tumours/for NSG mice, two-tailed unpaired Student’s t-test within each mouse strain). e, MR reduced blood CD3+ T cells in tumour-bearing immunocompetent Balb/c mice. The percentage of the indicated circulating T cell populations from Balb/c mice in d was analysed by flow cytometry (n = 10 mice per group, two-tailed unpaired Student’s t-test). f, MR failed to enhance the growth of allografted B16.F10 mouse melanoma cells in CD8a knockout mice (for WT mice, n = 4 mice per group; for CD8a knockout mice, n = 5 mice per group; two-way ANOVA). g, Anti-PD-1 antibody (300 μg per injection) failed to suppress tumour growth in methionine-restricted immunocompetent mice (n = 7 tumours for CTRL IgG group; 5 tumours for CTRL anti-PD-1 group; 8 tumours for MR IgG group; and 8 tumours for MR anti-PD-1 group; two-way ANOVA, one outlier in the MR anti-PD-1 group was removed by >Q3 + 3.0 times the IQR; box-and-whiskers plot, Tukey with whiskers: Q1 minus 1.5 times the IQR to Q3 plus 1.5 times the IQR). Mice were inoculated with tumour cells in both flanks. h, MR reduced circulating CD3+ and CD8+ T cells in tumour-bearing Balb/c mice treated with or without 300 μg per injection of anti-PD-1 (n = 5 mice per group, two-way ANOVA). Values are expressed as the mean ± s.e.m., except in c. Details of statistical tests are in Methods. NS, not significant. Source data
Fig. 3
Fig. 3. Methionine restriction alters gut microbiota in immunocompetent mice.
a, MR significantly disrupted three major bacterial taxa in Apcmin+/− mice. The faecal bacteria abundance in diet-fed Apcmin+/− mice were determined by 16S rRNA gene amplicon sequencing (n = 12 mice on CTRL diet; 11 mice on MR diet, two-tailed unpaired Student’s t-test). b, MR significantly disrupted four major bacterial groups in C57BL/6J (B6) mice (n = 10 mice per group, two-tailed unpaired Student’s t-test). c, MR reduced Faecalibaculum and Lactobacillus but increased Bifidobacterium in the small intestine of B6 mice (n = 10 mice per group, two-tailed unpaired Student’s t-test). d, MR repressed the expression of Muc2 and Gal3st2 in the tumour-containing colons of Apcmin+/− mice. The mRNA abundance of Muc2 and Gal3st2 was analysed by qPCR with lamin as a loading control (n = 6 mice on CTRL diet and 5 mice on MR diet, two-tailed unpaired Student’s t-test; one outlier in Gal3st2 MR group was removed by >Q3 + 3.0 times the IQR). e, MR reduced the mucin in the colons of Apcmin+/− mice. The colonic sections of Apcmin+/− mice on different diets were stained with the high-iron diamine and Alcian blue, and the percentages of total mucin-positive area were quantified in Fiji (n = 6 mice on control diet and n = 5 mice on MR diet, two-tailed unpaired Student’s t-test). Values are expressed as the mean ± s.e.m. Details of statistical tests are in Methods. Source data
Fig. 4
Fig. 4. Methionine restriction promotes intestinal cancer progression and suppresses antitumour immunity through gut microbiota in immunocompetent mice.
a, MR reduced A. muciniphila in B6 mice (n = 6 mice per group, two-tailed unpaired Student’s t-test). b, Apcmin+/− mice transplanted with faeces from MR diet-fed B6 mice had reduced abundance of CD3+ and CD8+ T cells in the blood and small intestine (n = 6 mice transplanted with faeces from mice fed CTRL diet and four to five mice transplanted with faeces from mice fed MR diet, two-tailed unpaired Student’s t-test). c, Apcmin+/− mice transplanted with faeces from MR diet-fed B6 mice had more intestinal tumours (n = 20 mice transplanted with faeces from mice fed a CTRL diet and 17 mice transplanted with faeces from mice fed an MR diet, two-tailed unpaired Student’s t-test). d, MR and MR diet-trained faecal microbiota reduced the fraction of CD8+ T cells in the small intestine. Total CD45+ immune cells from the small intestine of B6 donors and Apcmin+/− faecal recipient mice were analysed by scRNA-seq. e, CD8+ effector T cells from MR diet-fed B6 donor mice and Apcmin+/− faecal recipient mice had reduced expression of genes involved in immune cell function and activation in the small intestine. Significantly downregulated genes in CD8 effector cells in B6-MR mice and Apc-FT-MR mice in Supplementary Table 7 were analysed for enriched pathways (Methods). Top pathways identified in Gene Ontology, KEGG and Reactome are shown. f, Violin plots showing the reduced expression of Gzma and Gzmb in different groups of immune cells in B6-MR and Apc-FT-MR mice. g, Feature plots showing the reduced expression of Ifngr1 and Il2rb in sub-T cell groups in B6-MR and Apc-FT-MR mice. h, Faecal microbiota from MR diet-fed mice failed to induce the expression of IFN-γ in CD8+ T cells. Purified mouse PBMCs were treated with faecal microbiota (FM) from CTRL diet or MR diet-fed donor mice for 12 h in vitro as described in Methods. The fraction of IFN-γ+CD8+ T cells was analysed by flow cytometry (n = 5 biological replicates per sample, Kruskal–Wallis test). Values are expressed as the mean ± s.e.m. Details of statistical tests are in Methods. NS, not significant. Source data
Fig. 5
Fig. 5. Methionine restriction reduces faecal hydrogen sulfide production and suppresses antitumour immunity in immunocompetent Apcmin+/− mice.
a, MR reduced faecal H2S production activity. Faeces from CTRL or MR diet-fed C57BL/6J donor mice as well as respective Apcmin+/− recipient mice were subjected to H2S production assay using the lead sulfide assay as described in Methods (n = 6 mice each for C57BL/6J donor groups; 9 mice each for Apcmin+/− recipient groups, two-tailed unpaired Student’s t-test). b, Oral supplementation of GYY4137 rescues MR-induced increase of tumour progression in Apcmin+/− mice. Apcmin+/− mice transplanted with faeces from CTRL- or MR-fed B6 mice were oral gavaged daily with vehicle (V) or GYY4137 (GYY) as described in Methods (n = 8 mice on CTRL diet, 6 mice on MR diet and 9 mice on MR diet + GYY, Kruskal–Wallis test). c, Oral supplementation of GYY4137 rescued MR-induced reduction of Ifng, Gzma and Gzmb mRNA in the tumour-containing intestine of Apcmin+/− mice. Apcmin+/− mice were treated as in b, and the mRNA levels of indicated genes were analysed by qPCR (n = 9 mice per group, Kruskal–Wallis test). d, Oral supplementation of GYY4137 rescued the survival of Apcmin+/− mice on MR diet. Apcmin+/− mice were treated as in b (n = 16 mice on CTRL diet, 11 mice on MR diet and 9 mice on MR diet + GYY, log-rank test). Values are expressed as the mean ± s.e.m., except in d. Details of statistical tests are in Methods. NS, not significant. Source data
Fig. 6
Fig. 6. Supplementation of hydrogen sulfide donors enhances antitumour immunity in immunocompetent mice.
a, Oral supplementation of GYY4137 rescued MR-induced resistance of subcutaneously grafted CT26.CL25 tumours to anti-PD-1 treatment in Balb/c mice (n = 10 mice/10 tumour injections per group, two-way ANOVA). b, Oral supplementation of GYY rescued MR-induced resistance of subcutaneously grafted B16.F10 tumours to anti-PD-1 treatment in C57BL/6J mice (n = 7, 7, 9, 7, 7 and 9 tumours per group, two-way ANOVA). c, Neither MR nor oral supplementation of GYY4137 affected the growth of allografted CT26.CL25 tumours in immunodeficient NSG mice (n = 6, 7, 7, 6, 7 and 7 tumours per group, two-way ANOVA). d, Oral supplementation of GYY4137 rescued MR-induced reduction of CD3+ and CD4+ T cells in regular Balb/c mice. CTRL or MR-fed Balb/c mice were daily gavaged with GYY for 20 d. The total cell number of indicated blood T cells was analysed by flow cytometry (n = 9, 10, 9 and 10 mice per group, two-way ANOVA). e, Supplementation of H2S donors increased the activity of GAPDH in activated human PBMCs. Human PMBCs activated by CD3/CD28 beads and IL-2 were cultured in control RPMI 1640 medium containing 100 μM methionine (CTRL) or a methionine-restricted medium containing 10 μM methionine (MR) with or without 500 μM NaSH or GYY overnight. The activity of GAPDH was measured as described in Methods (n = 3 biological repeats per group, two-way ANOVA). f, Supplementation of H2S donors increased the sulfhydration of GAPDH in activated human PBMCs. Human PMBCs were treated as previously and sulfhydration of GAPDH was measured as described in Methods. Representative immunoblots are shown. Values are expressed as the mean ± s.e.m. Details of statistical tests are included in Methods. Source data
Fig. 7
Fig. 7. Deficiency in gut microbiota-mediated H2S production impairs antitumour immunity.
a, MR altered faecal metabolites in H2S-producing pathways. Faecal metabolites were analysed by metabolomics, and the log ratios of the relative abundance of metabolites in MR/CTRL faeces were presented by a colour scale (n = 10 mice per group). b, MR altered the expression of key H2S-producing microbial genes in the faeces (n = 5 mice per group; box-and-whiskers plot, whiskers represent the minimum to maximum values, corrected using the Benjamini–Hochberg method for the false discovery rate). c, MR reduced the expression of indicated faecal microbial H2S-producing enzymes (qPCR using total bacterial 16S rRNA gene as a control, n = 10 mice per group, from an independent cohort, multiple two-tailed unpaired Student’s t-tests; one outlier in CTRL group was removed for cysK and cysM by >Q3 + 3.0 times the IQR). d, DecR mutant E. coli has reduced H2S-producing activity in vitro (n = 6 replicates, Kruskal–Wallis test). e, CT26.CL25 tumours exhibit increased growth in germ-free Balb/c mice repopulated with decR mutant E. coli/A. muciniphila after treatment with anti-PD-1 (n = 10 tumours for WT and 12 tumours for decR mutant, two-tailed unpaired Student’s t-test). Scale bars, 1 cm. f, The faecal H2S-producing activity was negatively correlated with the tumour weight yet positively correlated with the abundance of circulating T cells in germ-free Balb/c mice repopulated with E. coli/A. muciniphila. All mice in e were analysed (n = 15 mice for WT and 14 mice for decR mutant; two tailed, 95% confidence intervals are labelled). g, The tumour weight was negatively correlated with the abundance of circulating T cells in germ-free Balb/c mice repopulated with E. coli/A. muciniphila (n = 15 mice for WT and 14 mice for decR mutant; two tailed, 95% confidence intervals are labelled). h, Dietary cysteine supplementation rescued MR-induced growth and resistance of subcutaneous (s.c.) CT26.CL25 tumours to anti-PD-1 treatment in Balb/c mice (n = 10 mice/10 tumour injections per group, two-way ANOVA). Scale bar, 1 cm. i, The tumour weight was negatively correlated with the abundance of circulating CD8+ T cells in Balb/c mice fed with indicated diets (n = 10 mice per group; two tailed, 95% confidence intervals are labelled). Values are expressed as the mean ± s.e.m., except in b, f, g and i. Details of statistical tests are in Methods. Ctt, cystathionine; Hcy, homocysteine. Source data
Fig. 8
Fig. 8. Dietary methionine supplementation activates T cells and suppresses tumour progression in immunocompetent mice.
a, Dietary methionine supplementation reduced the abundance of circulating T cells (n = 11 mice on 1.3% diet and 9 mice on 0.4% diet, two-tailed unpaired Student’s t-test). b, Dietary methionine supplementation increased the abundance and fraction of activated CD8+ T cells (n = 11 mice on 1.3% diet and 9 mice on 0.4% diet, two-tailed unpaired Student’s t-test). c, Dietary methionine supplementation reduced exhaustion of circulating CD4+ T cells in C57BL/6J mice (n = 11 mice on 1.3% diet and 9 mice on 0.4% diet, two-tailed unpaired Student’s t-test). d, Dietary methionine supplementation increases the expression of microbial l-cysteine desulfhydrase (lcd) gene in faeces (n = 5 mice per group, box-and-whiskers plot, whiskers indicate minimum to maximum values, corrected using the Benjamini–Hochberg method for the false discovery rate). e, Dietary methionine supplementation increased the expression of key sulfur metabolic genes in faeces (n = 10 mice per group, from an independent experimental cohort, multiple Student’s t-tests). f, Dietary methionine supplementation inhibited tumour growth in Apcmin+/− mice (n = 11 mice on 1.3% diet and 28 mice on 0.4% diet, two-tailed unpaired Student’s t-test). g, Dietary methionine supplementation increased blood T cell fractions in Apcmin+/− mice (n = 5 mice per group, two-tailed unpaired Student’s t-test). h, Dietary methionine supplementation increased survival of Apcmin+/− mice (n = 9 mice on a 0.4% diet and 6 mice on a 1.3% diet. Log-rank test). i, Dietary methionine supplementation repressed tumour growth in immunocompetent mice but enhanced tumour growth in immunodeficient mice (n = 10 tumours per group, two-tailed unpaired Student’s t-test between 1.3% versus 0.4% only). j, Dietary methionine supplementation increased blood CD8+CD3+ T cells in Balb/c mice (n = 10 mice on a 1.3% diet and 9 mice on a 0.4% diet, two-tailed unpaired Student’s t-test). k, Dietary methionine supplementation dose not significantly affected tumour growth and response to anti-PD-1 treatment in germ-free Balb/c mice (n = 8 mice/16 tumour injections per group, two-way ANOVA; one outlier in the 1.3% + anti-PD-1 group was removed). l, The impact of dietary methionine supplementation on blood T cells in germ-free Balb/c mice (n = 8 mice per group, two-way ANOVA). Values are expressed as the mean ± s.e.m., except in h. Details of statistical tests are included in Methods. Source data
Extended Data Fig. 1
Extended Data Fig. 1. Dietary methionine restriction enhances tumor progression in immunocompetent mice.
a, MR-induced tumor growth is associated with reduced expression of apoptotic and DNA damage response genes in the ileum of Apcmin+/−mice. The expression of indicated apoptotic genes was analyzed by qPCR (For Bax, n = 6 mice on CTRL diet; 6 mice on MR diet; For Casp8 and Gadd45a, n = 4 mice on CTRL diet; 6 mice on MR diet; two-tailed unpaired Student’s t-test. Values are expressed as mean ± s.e.m.). b, MR increases the cleavage of Bax in the ileum of Apcmin+/− mice. The ileum sections from mice fed with CTRL diet and MR diet were immunoblotted with an anti-Bax antibody. The ilea from five pairs of CTRL and MR diet fed Apcmin+/− mice from one experiment were analyzed. c, Schematic diagram of dietary methionine restriction in the AOM/DSS CRC model. Regular C57BL/6 mice (B6) were fed with CTRL diet or MR diet for 3-4 weeks. They were then i.p. Injected with 10 mg/kg bwt AOM. One week later, they were treated with 2 % DSS in drinking water for 7 days, then return to regular water for the rest of the procedure. Colon tissues were dissected 14 weeks after the AOM injection to analyze the development and progression of CRC. Mouse cartoon images were drawn by using pictures from Servier Medical Art (https://smart.servier.com/wp-content/uploads/2016/10/Animals.pptx). Servier Medical Art by Servier is licensed under a Creative Commons Attribution 3.0 Unported License (https://creativecommons.org/licenses/by/3.0/). d, MR enhances tumor progression in C57BL/6 mice in an AOM/DSS CRC model. B6 mice were treated as in (c). Colon images from all experimental mice are shown. e, MR enhances orthotopically grafted CT26.CL25 tumor growth. Images of orthotopic tumors are shown. Details of statistical tests are included in the Methods. Source data
Extended Data Fig. 2
Extended Data Fig. 2. Dietary methionine restriction enhances tumor progression in immunocompetent Apcmin+/− mice by modulating anti-tumor immunity.
a, MR reduces the fraction of CD3+CD8+ T cells in the blood of Apcmin+/− mice. Representative flow cytometry plots are shown. b, MR has a trend to reduce the fraction of CD3+ T cells in intestinal tissues of Apcmin+/− mice (n = 4 mice in each group, two-tailed unpaired Student’s t-test). c, MR from age of one month increases tumor growth in the intestine of Apcmin+/−mice. One-month old Apcmin+/− mice were fed with with CTRL or MR diet for 3 months (n = 10 mice for CTRL diet, 9 mice for MR diet, two-tailed unpaired Student’s t-test). d, MR from age of one month reduces blood T cells abundance in Apcmin+/−mice. Apcmin+/−mice were fed as in (c) and the cell number of indicated cells in the blood was analyzed by FACS (n = 10 mice in each diet, two-tailed unpaired Student’s t-test). e, Correlation between colon tumor burden and blood T cell faction of Apcmin+/− mice fed with CTRL or MR diet for 3 months (n = 10 mice for CTRL diet, 9 mice for MR diet). The Pearson correlation coefficient between the tumor burden in the colon with the blood fraction of indicated T cells was analyzed in Prism. f–g, MR suppresses intestinal tumor growth in Apcmin+/− mice on an immunodeficient background. Apcmin+/− /Rag2−/− mice were fed with CTRL or MR diet for about 2 months. Their small intestinal tumor number and colon tumor burden were analyzed around 4 months of age (n = 8 mice on the CTRL diet and 9 on the MR diet, two-tailed unpaired Student’s t-test). h, Healthy survival of Apcmin+/− /Rag2−/− mice under CTRL or MR diet (n = 8 mice on the CTRL diet and 9 on the MR diet, log-rank test). Values are expressed as mean ± s.e.m., except (e and h). Details of statistical tests are included in the Methods. Source data
Extended Data Fig. 3
Extended Data Fig. 3. MR suppresses anti-tumor immunity and enhances tumor progression in syngeneic cancer models.
a, Representative flow cytometry plots of blood CD8+CD3+ T cells in tumor-bearing Balb/c mice. b, MR reduces blood CD3+ T cells in tumor-free Balb/c mice (n = 9 mice/group, two-tailed unpaired Student’s t-test). c, MR exerts distinct impacts on the transcriptomic profiles of CT26.WT tumors in Balb/c mice or NSG mice. The transcriptomes of CT26.WT tumors collected from indicated mice were analyzed by RNA-seq (n = 6 tumors in each group). d, GSEA pathway enrichment maps for MR-induced gene sets in CT26/WT tumors collected in Balb/c mice or NSG mice. Enrichment maps were generated using Cytoscape. For each node, size represents “size of gene set”, the density of color represents “Enrichment score. e, The mRNA levels of 8,233 significantly differentially expressed genes from (c) were clustered and presented by heatmaps (Cluster 1, 4031; Cluster 2, 2041; Cluster 3, 2151). f, The top five enriched canonical pathways in the three gene clusters in (e) identified by Ingenuity Pathway Analysis. g, MR fails to enhance the growth of B16.F10 mouse melanoma cells in CD8a KO mice. WT C57BL/6 control mice and CD8a KO mice were fed with CTRL or MR diets. B16.F10 mouse melanoma cells were injected and the image for final tumors are shown. h, Anti-PD-1 antibody (200 µg/injection) fails to suppress tumor growth in methionine-restricted immunocompetent mice (n = 8 tumors/group, 2-way ANOVA). i, MR reduces circulating CD3+ T cells but increases circulating Tim3+CD4+ exhausted T cells in Balb/c mice (n = 12 mice/group, 2-way ANOVA). j, MR reduces tumor CD3+ T cells in anti-PD-1 antibody treated mice (n = 4 tumors for CTRL IgG group; 4 tumors for CTRL anti-PD-1 group; 4 tumors for MR IgG group; and 5 tumors for MR anti-PD-1 group, 2-way ANOVA). Values are expressed as mean ± s.e.m. Details of statistical tests are included in the Methods. Source data
Extended Data Fig. 4
Extended Data Fig. 4. Dietary methionine restriction alters gut microbiota in different immunocompetent mice.
a, MR alters fecal bacterial composition in Apcmin+/− mice. Apcmin+/− mice were fed with a CTRL diet or a MR diet (n = 12 mice on CTRL diet and 11 mice on MR diet, two-tailed unpaired Student’s t-test). The ratio of firmicutes/Bacteroidetes was calculated. b, MR alters the fecal abundance of A. muciniphila, Odoribacter, and Bifidobacterium. c, MR alters fecal bacterial composition in B6 mice. C57BL/6J (B6) donor mice were fed with a CTRL diet or a MR diet (n = 10 mice on CTRL diet and 10 mice on MR diet, two-tailed unpaired Student’s t-test). d, MR reduces firmicutes in the small intestine of B6 mice. C57BL/6J (B6) donor mice were fed with a CTRL diet or a MR diet. Total intestinal DNA samples were analyzed for microbiome using 16S rRNA gene amplicon sequencing as described in Methods (n = 10 mice/group, two-tailed unpaired Student’s t-test). e, MR reduces bacilli while increasing actinobacteria in the small intestine of B6 mice (n = 10 mice/group). Values are expressed as mean ± s.e.m. Details of statistical tests are included in the Methods. Source data
Extended Data Fig. 5
Extended Data Fig. 5. Dietary methionine restriction promotes intestinal cancer progression and suppresses anti-tumor immunity through gut microbiota in immunocompetent mice.
a, Schematic of the fecal transplantation experiment. C57BL/6J mice were fed with either CTRL diet or a MR diet for 2 weeks. Fresh fecal solutions from these fed mice were then gavaged into antibiotic treated Apcmin+/− mice daily for one week. The recipient Apcmin+/− mice were fed with regular chow diet for the duration of the experiment, and intestinal tumors were analyzed 2-3 weeks after fecal transplantation. Mouse cartoon images were drawn by using pictures from Servier Medical Art (https://smart.servier.com/wp-content/uploads/2016/10/Animals.pptx). Servier Medical Art by Servier is licensed under a Creative Commons Attribution 3.0 Unported License (https://creativecommons.org/licenses/by/3.0/). b-c, Relative fecal abundance of total 16S rRNA gene and A. muciniphila in recipient Apcmin+/− mice during antibiotic depletion of gut microbiota and fecal transplantation. The recipient Apcmin+/− mice were treated with antibiotics (Abx) and fecal transplanted (FT) as described in Methods. Their feces were collected at indicated days to confirm the success of gut bacteria depletion and fecal transplantation by qPCR (n = 5 FT-CTRL and 7 FT-MR). d, Apcmin+/− mice transplanted with feces from MR diet fed C57BL/6J mice have reduced abundance of CD3+ T cells in the blood and small intestine. Representative flow cytometry plots are shown. e, Apcmin+/− mice transplanted with feces from MR diet-fed C57BL/6J mice have more intestinal tumors. Representative tumor images are shown. f, Fecal bacteria levels in regular and GF mice after CTRL or MR diet feeding (n = 4, 5, 4, and 4 mice/group, 2-way ANOVA). g–h, MR fails to significantly alters tumor growth and circulating T cell abundance in germ-free Balb/c mice. Germ-free Balb/c mice fed with irradiated CTRL or MR diets were subcutaneously injected with CT26.CL25 cells as described in Methods (n = 4 mice/8 tumor injections/group, two-tailed unpaired Student’s t-test). i, MR reduces body weight of germ-free Balb/c mice (n = 4 mice/group, two-tailed unpaired Student’s t-test). Values in are expressed as mean ± s.e.m. Details of statistical tests are included in the Methods. Source data
Extended Data Fig. 6
Extended Data Fig. 6. scRNA-seq analysis of CD45+ immune cells from the small intestine of diet-fed B6 donor or fecal transplanted Apcmin+/− mice.
a, Dot plot showing the expression of marker genes in different function groups of total CD45+ immune cells. Cell population annotation of CD45+ immune cells from CTRL or MR fed B6 donor mice and from Apcmin+/− mice transplanted with fecal solution from CTRL or MR B6 mice. b, Total CD45+ immune cells from the whole small intestine of indicated mice were analyzed by scRNA-seq as described in Methods. c, Heat map showing the expression of marker genes in different sub-groups of T cells. d, Sub T cell group annotation. e, Dietary methionine restriction and MR diet-trained fecal microbiota reduces the fraction of several subgroups of intestinal CD8+ T cells. f, Representative FACS plots for in vitro activation of T cells by fecal microbes from control diet or MR diet fed B6 mice. Source data
Extended Data Fig. 7
Extended Data Fig. 7. Hydrogen sulfide chemical donors rescue anti-tumor immunity in mice under dietary methionine restriction.
a, Schematic of the GYY4137 and anti-PD1 immunotherapy experiment. Balb/c or NSG mice were fed with either CTRL diet or a MR diet for 3 weeks. After s.c. injected with 2 × 10⁵ CT26.CL25 cells, mice in each group were randomly divided with 3 groups to be daily gavaged with GYY4137, and i.p. injected with 200 µg control IgG or anti-PD-1 antibody every 4 days. Allografted tumors were monitored and analyzed 2-3 weeks after inoculation. Mouse cartoon images were drawn by using pictures from Servier Medical Art (https://smart.servier.com/wp-content/uploads/2016/10/Animals.pptx). Servier Medical Art by Servier is licensed under a Creative Commons Attribution 3.0 Unported License (https://creativecommons.org/licenses/by/3.0/). b, GYY4137 supplementation rescues the expression of IFNγ in CD8+ T cells treated with fecal microbiota from MR diet fed mice. Purified mouse PBMCs were treated with fecal microbiota (FM) from CTRL diet or MR diet fed donor mice plus indicated amount of GYY4137 for 6 hours in vitro as described in Methods. The fraction of IFNγ+ CD8+ T cells were analyzed by flow cytometry (n = 4 or 2 biological replicates/sample, 2-way ANOVA). c, Glycolysis of activated human PBMCs treated with indicated conditions. Cells were treated and ECAR in each group was measured as described in Methods (n = 8 biological replicates/group, 2-way ANOVA). d, Oxygen consumption of activated human PBMCs treated with indicated conditions. Cells were treated and OCR in each group was measured as described in Methods (n = 3 biological replicates/group). Values are expressed as mean ± s.e.m. Details of statistical tests are included in the Methods. Source data
Extended Data Fig. 8
Extended Data Fig. 8. Dietary methionine restriction impairs gut microbiota-mediated H2S production from cysteine.
a, A. muciniphila produces H2S in vitro. b, Schematic of anti-PD-1 immunotherapy in mice repopulated with WT or decR mutant E. coli plus A. muciniphila. Germ free (GF) Balb/c mice were gavaged with WT or decR mutant E. coli plus A. muciniphila 5 days a week for 4 weeks. Five days after the first bacteria gavage, 2 × 10⁵ CT26.CL25 cells were s.c. injected, immediately followed with i.p. injection of 200 µg/injection anti-PD-1 antibody every 5 days. Mouse cartoon images were drawn by using pictures from Servier Medical Art (https://smart.servier.com/wp-content/uploads/2016/10/Animals.pptx). Servier Medical Art by Servier is licensed under a Creative Commons Attribution 3.0 Unported License (https://creativecommons.org/licenses/by/3.0/). c, The relative abundance of indicated bacteria in the colons and feces of mice in (b) (n = 15 mice for WT and 14 mice for decR mutant, multiple two-tailed unpaired Student’s t-test). d, Fecal H2S producing activities of mice in (b) (n = 15 mice for WT and 14 mice for decR mutant, two-tailed unpaired Student’s t-test). 400 µM of cysteine was used as a substrate. e, Dietary cysteine supplementation in MR diet increases fecal H2S production. 10 mM of cysteine was used as a substrate (n = 10 mice/group, 2-way ANOVA; one outlier in CTRL group was removed by <Q1-3.0*IQR). f, The tumor weight is negatively correlated with the abundance of circulating T cells in Balb/c mice (n = 10 mice/group). g, Dietary cysteine supplementation does not impact the growth and the anti-PD1 response of CT26.CL25 tumors in NSG mice (n = 5 mice/10 tumor injections/group, 2-way ANOVA). h, Dietary cysteine supplementation rescues MR-induced growth and resistance of B16.F10 tumors to anti-PD1 treatment in C57BL/6J mice (n = 5 mice/10 tumor injections/group, 2-way ANOVA). i, Dietary cysteine supplementation rescues MR-induced body weight loss in Balb/c mice (n = 10 mice/group, 2-way ANOVA). j–k, Dietary cysteine supplementation rescues MR-induced body weight loss in C57BL/6J and NSG mice (n = 5 mice/group, 2-way ANOVA). Values are expressed as mean ± s.e.m. Details of statistical tests are included in the Methods. Source data
Extended Data Fig. 9
Extended Data Fig. 9. Dietary methionine supplementation alters microbial sulfur metabolic genes in feces of C57BL/6J mice.
a-b, Dietary methionine supplementation alters the expression of several key microbial sulfur metabolic genes in the feces. Fecal RNAs from mice fed 1.3% or 0.4% methionine diets were subjected to metatranscriptomic analysis as described in Methods (n = 5 mice/group, all highlighted genes were significantly altered). The log ratios of the relative levels of indicated microbial gene in feces from mice fed 1.3% vs 0.4% methionine diets were presented by a color scale in a KEGG sulfur metabolism map (adapted from KEGG PATHWAY, https://www.genome.jp/entry/pathway+map00920) (a), or in an organic sulfur metabolic network (b). c, Dietary methionine supplementation dramatically increases the expression of microbial lcd gene in feces (n = 5 mice/group, Box and whiskers plot, whiskers: Min to Max). Multiple comparisons were corrected using the Benjamini-Hochberg method for the false-discovery rate. Source data

Similar articles

Cited by

References

    1. Mato JM, Martinez-Chantar ML, Lu SC. Methionine metabolism and liver disease. Annu. Rev. Nutr. 2008;28:273–293. doi: 10.1146/annurev.nutr.28.061807.155438. - DOI - PubMed
    1. Wang Z, et al. Methionine is a metabolic dependency of tumor-initiating cells. Nat. Med. 2019;25:825–837. doi: 10.1038/s41591-019-0423-5. - DOI - PubMed
    1. Xu Q, et al. HNF4α regulates sulfur amino acid metabolism and confers sensitivity to methionine restriction in liver cancer. Nat. Commun. 2020;11:3978. doi: 10.1038/s41467-020-17818-w. - DOI - PMC - PubMed
    1. Orentreich N, Matias JR, DeFelice A, Zimmerman JA. Low methionine ingestion by rats extends life span. J. Nutr. 1993;123:269–274. - PubMed
    1. Miller RA, et al. Methionine-deficient diet extends mouse lifespan, slows immune and lens aging, alters glucose, T4, IGF-I and insulin levels, and increases hepatocyte MIF levels and stress resistance. Aging Cell. 2005;4:119–125. doi: 10.1111/j.1474-9726.2005.00152.x. - DOI - PMC - PubMed

Publication types