. 2023 Aug;5(8):1319-1336.
doi: 10.1038/s42255-023-00839-2. Epub 2023 Aug 3.

The serotonin transporter sustains human brown adipose tissue thermogenesis

Affiliations

The serotonin transporter sustains human brown adipose tissue thermogenesis

Karla J Suchacki et al. Nat Metab. 2023 Aug.

Abstract

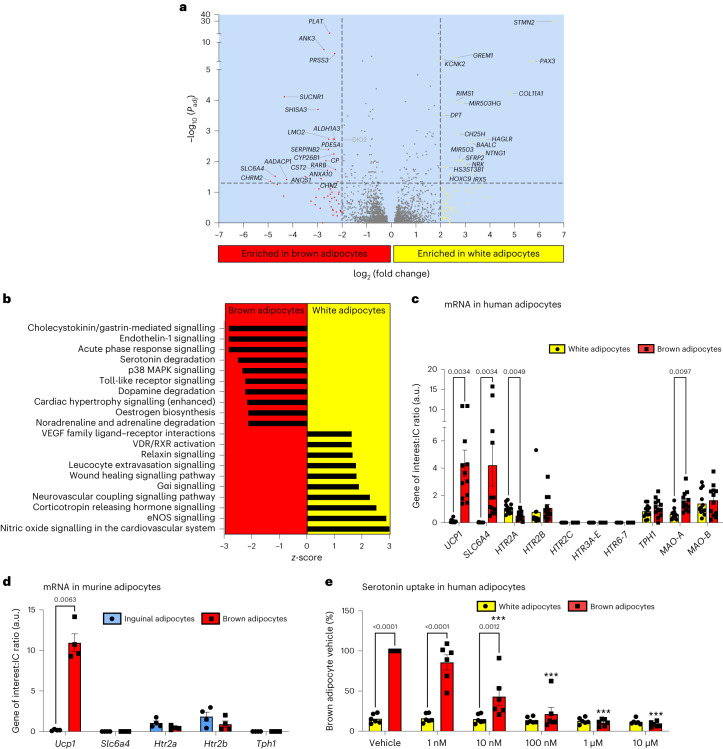
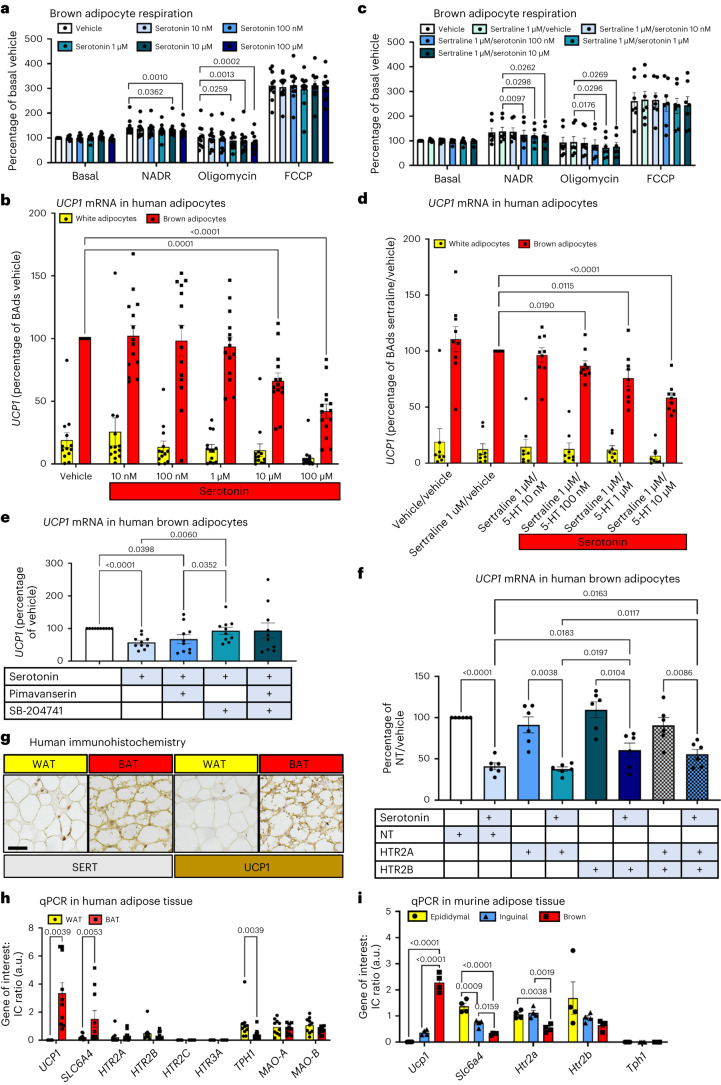
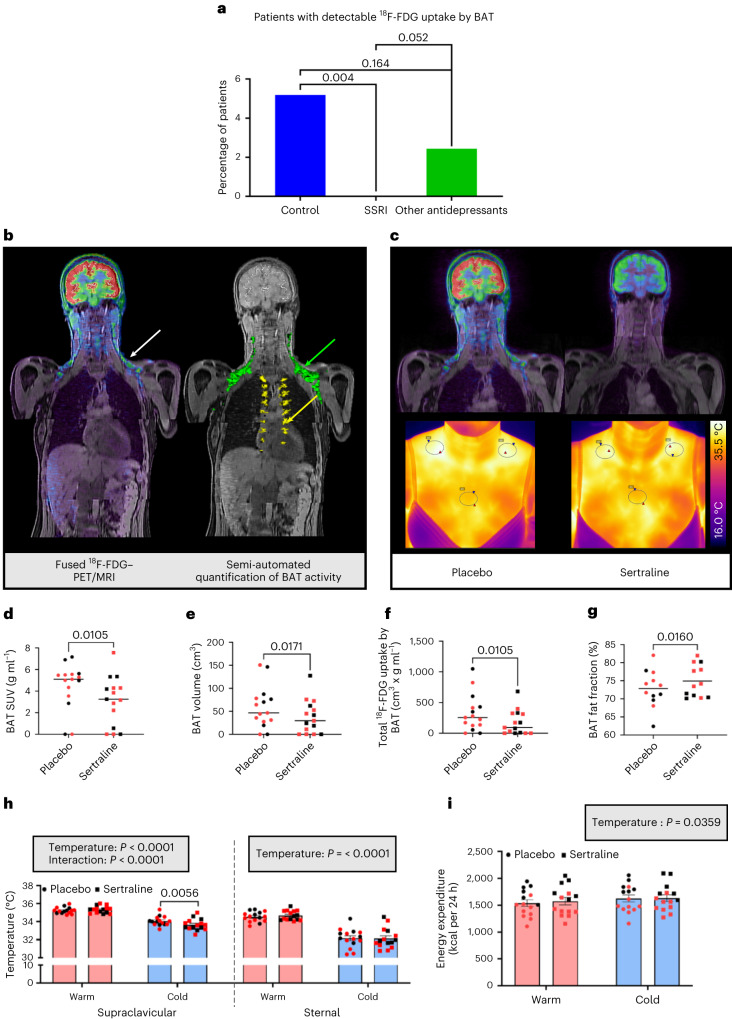
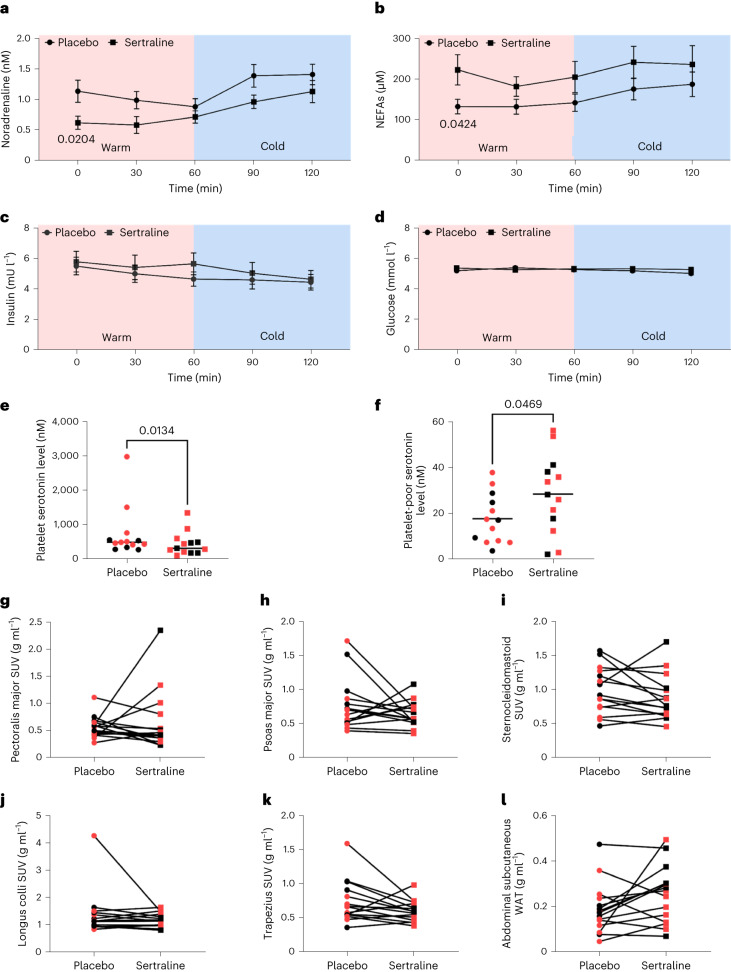
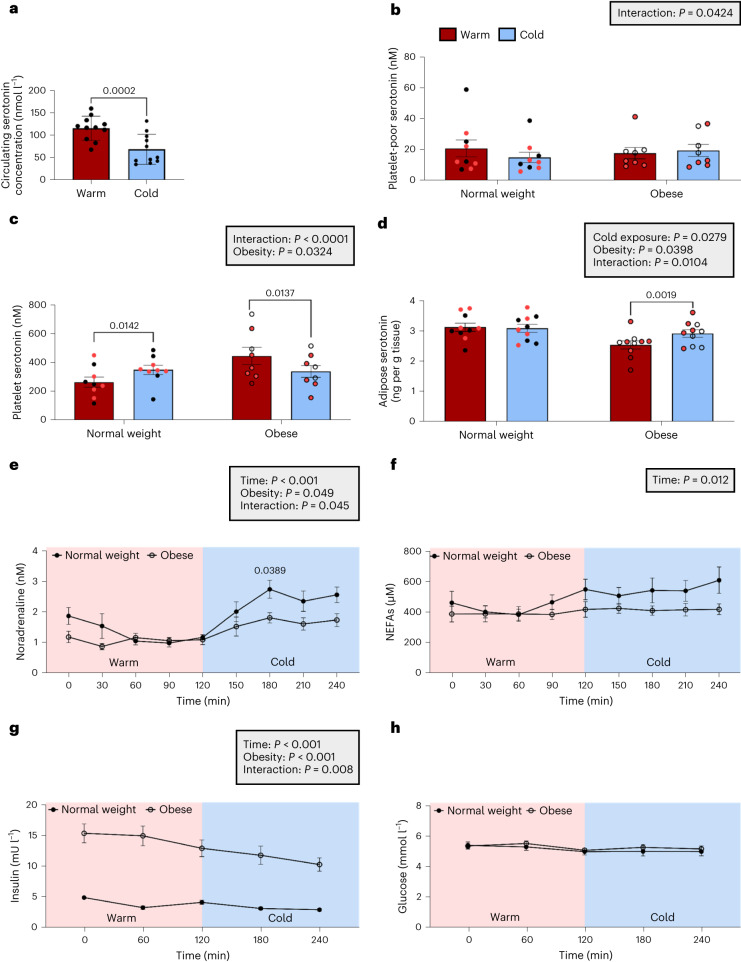
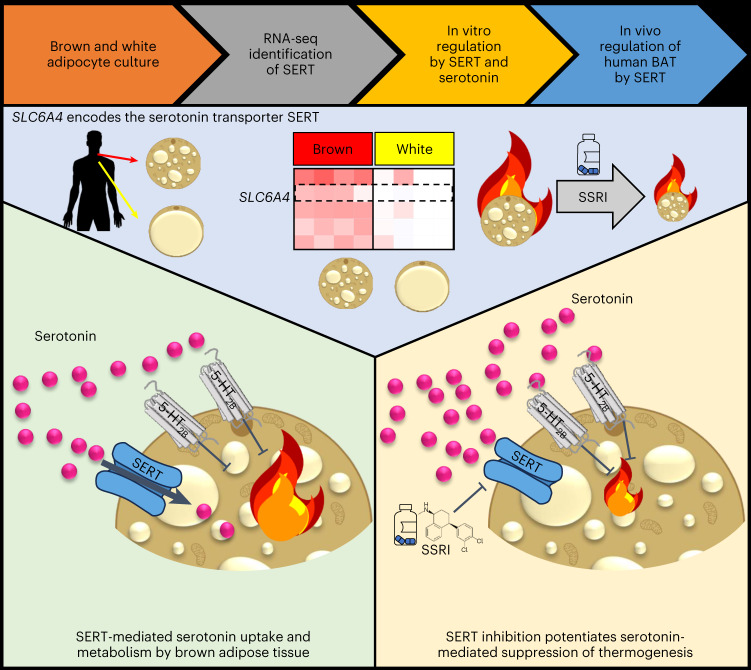
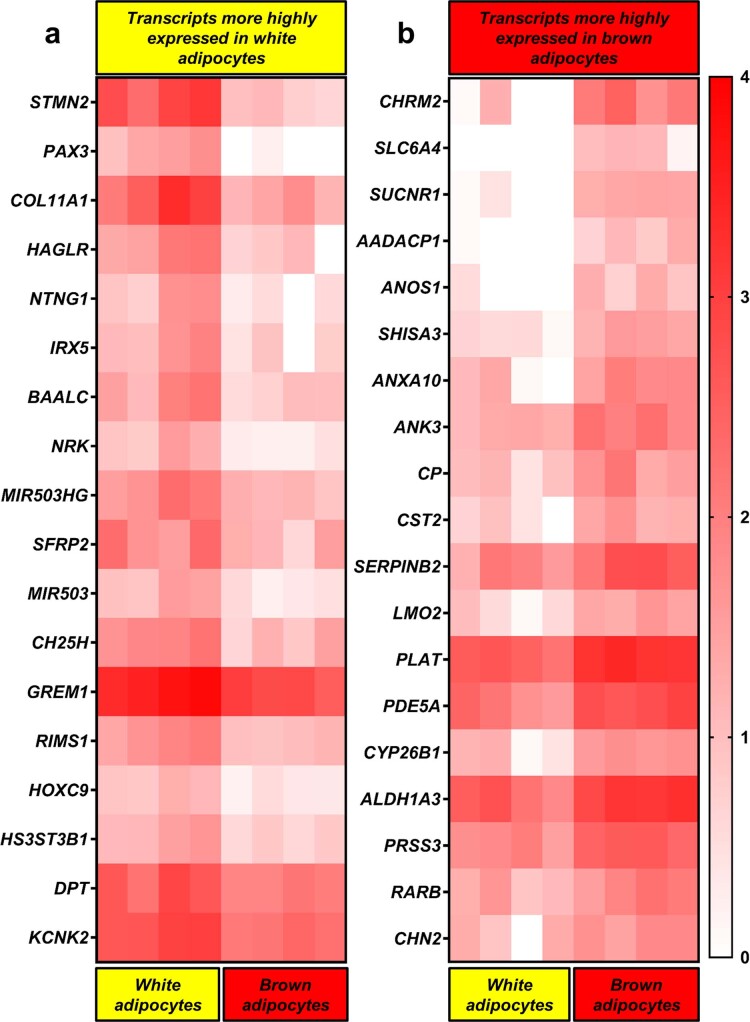
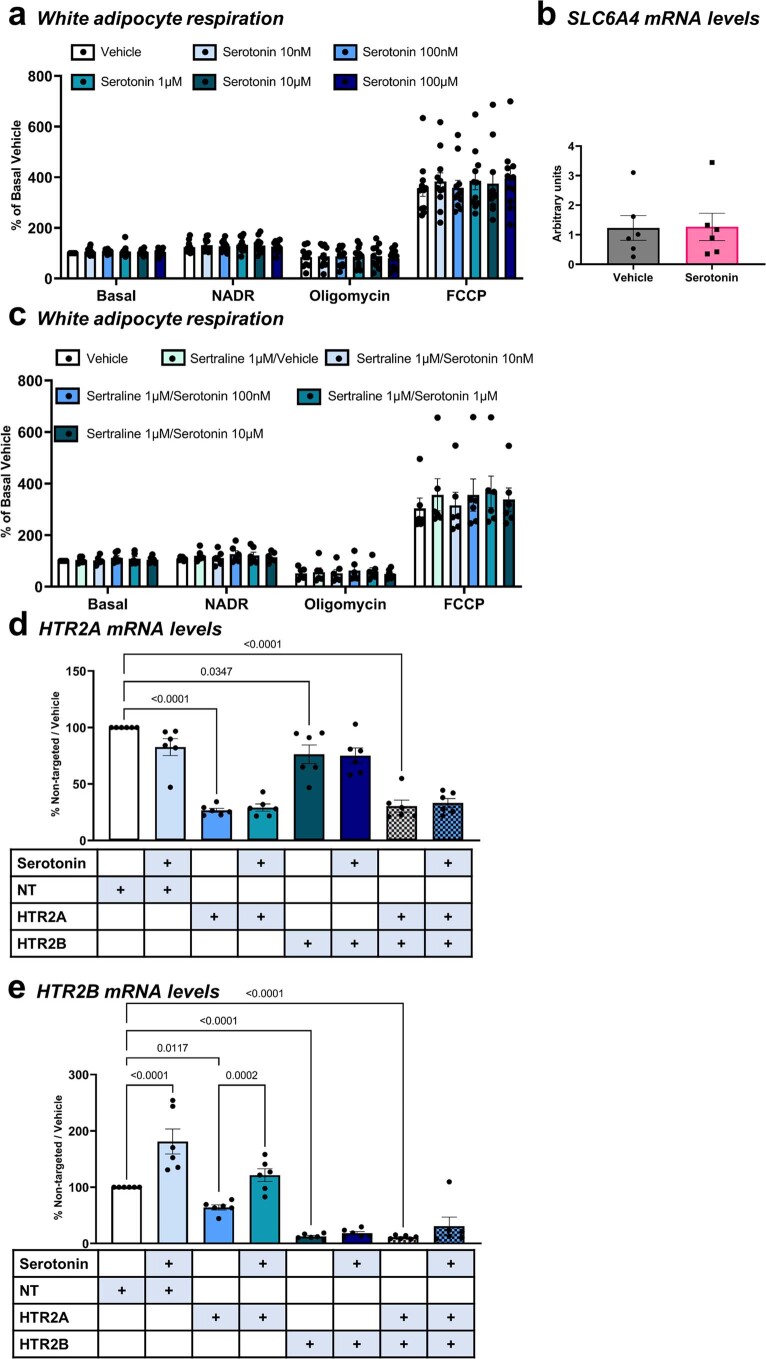
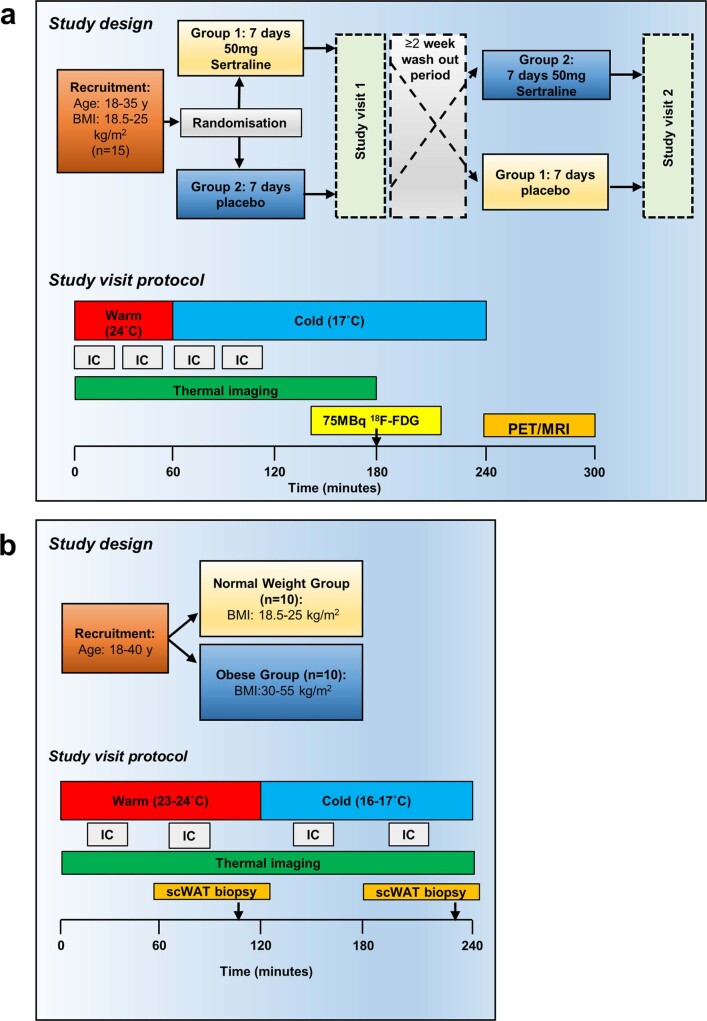
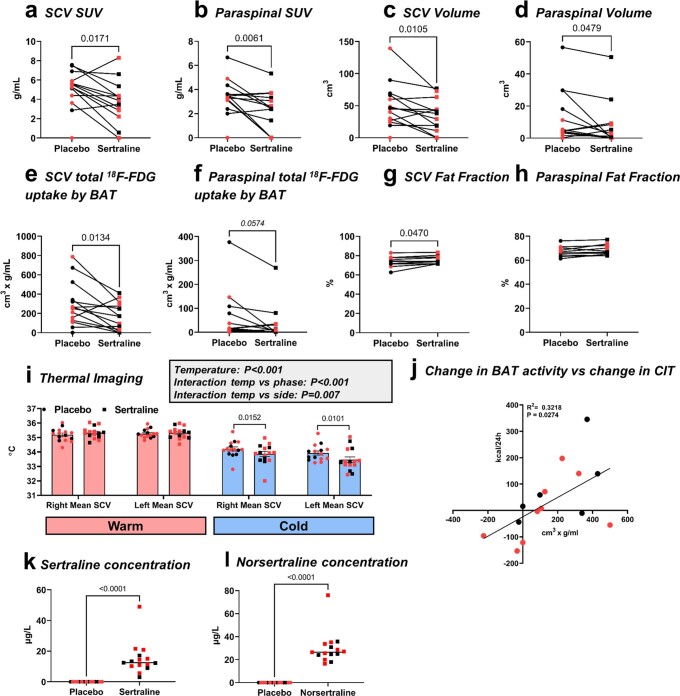
Activation of brown adipose tissue (BAT) in humans is a strategy to treat obesity and metabolic disease. Here we show that the serotonin transporter (SERT), encoded by SLC6A4, prevents serotonin-mediated suppression of human BAT function. RNA sequencing of human primary brown and white adipocytes shows that SLC6A4 is highly expressed in human, but not murine, brown adipocytes and BAT. Serotonin decreases uncoupled respiration and reduces uncoupling protein 1 via the 5-HT2B receptor. SERT inhibition by the selective serotonin reuptake inhibitor (SSRI) sertraline prevents uptake of extracellular serotonin, thereby potentiating serotonin's suppressive effect on brown adipocytes. Furthermore, we see that sertraline reduces BAT activation in healthy volunteers, and SSRI-treated patients demonstrate no 18F-fluorodeoxyglucose uptake by BAT at room temperature, unlike matched controls. Inhibition of BAT thermogenesis may contribute to SSRI-induced weight gain and metabolic dysfunction, and reducing peripheral serotonin action may be an approach to treat obesity and metabolic disease.


Conflict of interest statement

The authors declare no competing interests.

Figures

Fig. 1
Fig. 1. SERT is highly expressed in human but not murine brown adipocytes.
a,b, Transcriptional profiling of paired human white and brown adipocytes (n = 4 per group; participant data detailed in Supplementary Information). a, Volcano plot of transcripts differentially expressed between brown and white adipocytes, with genes highlighted in black text representing those significantly DEGs (log2(fold change) >2 and adjusted P values (Padj) <0.05), DIO2 is highlighted in grey owing to the log2(fold change) being 1.99. b, Top canonical pathways enriched in paired human white and brown adipocytes with z scores >2. eNOS, endothelial nitric oxide synthase; RXR, retinoid X receptor; VDR, vitamin D receptor; VEGF, vascular endothelial growth factor. c,d, qPCR of paired human white (yellow columns) and brown adipocytes (red columns; n = 12 biologically independent samples per group) (c) and paired murine inguinal/beige (blue columns) and brown adipocytes (red columns; n = 4 biologically independent animals per group) (d). e, 3H-serotonin uptake with and without increasing concentrations of the SERT inhibitor sertraline (1 nM to 10 μM) in paired human white and brown adipocytes (n = 6 biologically independent samples per group). ***P < 0.0001 for sertraline concentrations ≥10 nM versus brown adipocyte vehicle. Data are mean ± s.e.m. Data were analysed using DESeq2 (a), Ingenuity Pathway Analysis (Qiagen) (b), multiple paired t-test (Holm–Sidak) (c,d) or two-way repeated measures ANOVA with Sidak multiple comparisons (e). Significant P values are detailed in the respective panels. IC, internal control. Source data
Fig. 2
Fig. 2. Serotonin inhibits UCP1 through the 5-HT2B receptor in human brown adipocytes.
a, OCR in human brown adipocytes (n = 11 biologically independent samples) cultured in vehicle or serotonin (10 nM to 100 μM) for 24 h, presented as the percentage of basal OCR during vehicle. NADR, noradrenaline. b, UCP1 mRNA levels in paired human white (yellow columns; n = 13 biologically independent samples) and brown (red; n = 14 biologically independent samples) adipocytes incubated with vehicle or ascending serotonin concentrations. BAds, brown adipocytes. c, OCR in human brown adipocytes (n = 7 biologically independent samples) cultured in vehicle, sertraline (1 μM) or sertraline plus serotonin (10 nM to 10 μM) for 24 h, presented as the percentage of basal OCR during vehicle. d, UCP1 mRNA levels in paired human white (n = 8 biologically independent samples) and brown (n = 9 biologically independent samples) adipocytes incubated with vehicle, sertraline (1 μM) or sertraline plus serotonin (10 nM to 10 μM) for 24 h. e, UCP1 mRNA levels in primary human brown adipocytes incubated with 100 μM serotonin with or without the inverse 5-HT2A agonist pimavanserin (10 μM) or the 5-HT2B receptor antagonist SB-204741 (10 μM) (n = 10 biologically independent samples). f, UCP1 mRNA levels in primary human brown adipocytes (n = 6 biologically independent samples) incubated with either vehicle or 100 μM serotonin for 24 h following siRNA-knockdown of HTR2A, HTR2B, both or an NT control. Significant P values are shown for comparisons between the respective vehicles of each group and between the groups of serotonin-treated cells. g, Immunohistochemistry of human WAT (yellow) and BAT (red), expression of SERT (left) and UCP1 (right) in BAT indicated by brown staining. Scale bar, 40 μm. h, mRNA expression in human BAT versus WAT (n = 10 biologically independent samples). i, mRNA expression in murine BAT (red) versus inguinal (beige; blue) or epididymal WAT (yellow) (n = 4 biologically independent samples). Data are mean ± s.e.m. Data were analysed by one-way (a,c,e,f) or two-way (b,d) repeated measures ANOVA, Wilcoxon signed-rank test (h) or one-way ANOVA (i). Significant P values are detailed in the respective panels. Source data
Fig. 3
Fig. 3. SERT inhibition suppresses BAT thermogenesis in vivo in humans.
a, Retrospective analysis of 18F-FDG-PET–CT scans performed at room temperature in patients treated with SSRIs (n = 153), those prescribed other classes of antidepressants (n = 164) and matched controls (n = 270). b, Left: fused PET–MRI (18F-FDG uptake by supraclavicular BAT (white arrow)). Right: three-dimensional PET–MRI with quantification of 18F-FDG uptake by cervical/supraclavicular/axillary (green) and paraspinal (yellow) BAT. c, Coronal fused PET–MRI (upper) and thermal images (lower) of a representative participant on placebo (left) and sertraline (right) phases. In the thermal images, regions of interest (ovals) are drawn around the left and right supraclavicular (to highlight areas of BAT) and sternal (control) areas. dg, Quantification of 18F-FDG uptake by BAT (d), BAT volume (e), total 18F-FDG uptake by BAT (f) and BAT fat fraction (g) on placebo (circles) and sertraline (squares) phases in male (black) and female (red) participants (n = 15 (df) or n = 12 (g) with detectable 18F-FDG uptake on both phases). Lines depict median (df) and mean (g) values. h, Supraclavicular and sternal skin temperatures during warm exposure (pink columns) and cold exposure (blue columns) (n = 15 biologically independent participants). i, Whole-body EE measured by indirect calorimetry (n = 15 biologically independent participants). EE was higher in males (P < 0.001). Data are median (df) or mean ± s.e.m. (gi). Data were analysed by chi-squared test (a), Wilcoxon signed-rank test (df), paired t-test (g) or two-way repeated measures ANOVA (h,i). Significant P values are detailed in the respective panels. Source data
Fig. 4
Fig. 4. Sertraline does not alter hormonal responses to cold or 18F-FDG uptake by skeletal muscle.
ad, Circulating concentrations of noradrenaline (a), NEFAs (b), insulin (c) and glucose (d) (all n = 15 biologically independent participants per group) on sertraline (black squares) and placebo (black circles) phases (Extended Data Fig. 3a). e,f, Serotonin concentrations at baseline in platelets (e) and platelet-poor plasma (f) (both n = 13 per group). Lines depict the median (e) and mean (f) values. gl, 18F-FDG uptake during cold exposure was quantified in pectoralis major (g), psoas major (h), sternocleidomastoid (i), longus colli (j) and trapezius skeletal (k) muscles, in addition to abdominal subcutaneous WAT (l) (all n = 15 per group) on both placebo (circles) and sertraline (squares) phases. Male and female participants are depicted by black and red circles/squares, respectively. Data are mean ± s.e.m. and were analysed by two-way repeated measures ANOVA (ad), Wilcoxon signed-rank test (e) and paired t-test (fl). Significant P values are detailed in the respective panels. Source data
Fig. 5
Fig. 5. Obesity alters circulating and adipose serotonin concentrations during cold exposure in humans.
a, Circulating plasma serotonin concentrations during warm conditions (red columns) and mild cold exposure (16–17 °C; blue columns) in normal weight BAT-positive men (n = 11). bd, Serotonin levels were measured in platelet-poor plasma (b) (n = 17), platelets (c) (n = 17) and abdominal WAT (d) (n = 20) during warm (red columns) and cold (blue columns) conditions in normal weight (closed circles) and obese (open circles) participants. Male and female participants are depicted by black and red circles, respectively. eh, Circulating hormones/intermediates were measured in normal weight and obese participants (n = 10 biologically independent participants per group) during warm and cold exposure: circulating noradrenaline (e), NEFAs (f), insulin (g) and glucose (h). Data are mean ± s.e.m. and were analysed by paired t-test (a) and two-way-repeated measures ANOVA (bh). Insulin (g) was greater in obese participants (P < 0.0001 at all time points); otherwise, significant P values are detailed in the respective panels. Source data
Fig. 6
Fig. 6. Graphical abstract depicting the role of SERT in human BAT.
RNA-seq of human primary brown and white adipocytes identified the SERT as a top DEG in brown adipocytes. We have shown that serotonin suppresses brown adipocyte thermogenesis and decreases UCP1 expression through the 5-HT2B receptor. We have also determined that SERT functions to scavenge extracellular serotonin in human brown adipocytes, and that inhibition of SERT by SSRIs augments the suppressive effect of serotonin on BAT thermogenesis.
Extended Data Fig. 1
Extended Data Fig. 1. RNA sequencing of human primary brown and white adipocytes.
Heatmaps of differentially expressed transcripts (those with > 2 log2-fold change and adjusted P value < 0.05) in paired human (a) white and (b) brown adipocytes. Transcripts are presented from top to bottom in decreasing order of differential expression between cell types, while the colour scale ranges from red (highest expression) to white (lowest expression). Log10 values ≤ 0 are presented as 0 on the heatmap. Source data
Extended Data Fig. 2
Extended Data Fig. 2. Serotonin alters uncoupled respiration in human brown but not white adipocytes.
(a) Oxygen consumption rates (OCR) in human white adipocytes (n = 11 biologically independent samples) cultured in vehicle or serotonin (10nM-100μM) for 24 hours prior to quantifying OCR during basal conditions and following sequential addition of noradrenaline, oligomycin and carbonyl cyanide-p-trifluoromethoxyphenylhydrazone (FCCP). Data are presented as the % of basal OCR during vehicle. (b) mRNA levels of SLC6A4 in human brown adipocytes (n = 6 biologically independent samples) that were cultured in vehicle or 100 µM serotonin. (c) Oxygen consumption rates (OCR) in human white adipocytes (n = 6 biologically independent samples) cultured in vehicle, sertraline (1 μM), or sertraline plus serotonin (10nM-10μM) for 24 hours, presented as the % of basal OCR during vehicle. (d-e) mRNA levels of (d) HTR2A and (e) HTR2B in primary human brown adipocytes (n = 6 biologically independent samples) incubated with either vehicle or 100 μM serotonin for 24 hours following siRNA-knockdown of HTR2A, HTR2B, both receptors or a non-targeted (NT) control. Data are mean ± SEM and were analysed by (a, c-e) one-way repeated measures ANOVA or (b) paired t-test. For d-e, significant P values are shown for the effect of knockdown in each vehicle treated-group and for the effect of serotonin compared to their respective vehicle. Source data
Extended Data Fig. 3
Extended Data Fig. 3. In vivo study protocols.
(a) Fifteen participants (nine female, six male) aged 18-35 years with a normal BMI (18.5-25 kg/m2) were recruited to a randomised, double-blind, placebo-controlled crossover study to determine the effect of the SSRI sertraline (50 mg for 7 days) on BAT activity. At each study visit, BAT activity was quantified using 18F-fluorodeoxyglucose (18F-FDG) PET/MRI and thermal imaging while whole body energy expenditure was measured using indirect calorimetry (IC). Participants spent 1 hour in a warm room, then 3 hours in a cold room to activate BAT. After 2 hours of cold exposure, 75 MBq of 18F-FDG was injected intravenously and a PET/MRI scan performed 1 hour later. (b) To determine the effect of obesity on circulating and adipose serotonin concentrations during cold exposure, male and female participants aged 18-40 years who were either normal weight (BMI 18.5-25 kg/m2) or obese (BMI 30-55 kg/m2) were recruited to a case-control study (n = 10/ group). Participants lay supine in a warm room for 2 hours prior to transfer to a cold room for 2 hours to activate BAT. BAT activity was measured by thermal imaging and whole body energy expenditure was measured by IC. Subcutaneous abdominal white adipose tissue (scWAT) biopsies were obtained following 105 minutes in each room. Source data
Extended Data Fig. 4
Extended Data Fig. 4. Sertraline inhibits BAT activity in supraclavicular and paraspinal depots.
(a-h) 18F-FDG uptake by BAT was categorised into either supraclavicular/ cervical/ axillary (grouped as SCV) or paraspinal regions of interest on placebo (closed circles) and sertraline (closed squares) phases (a-f n = 15 and g-h n = 12). (i) Left and right supraclavicular (SCV) skin temperatures during warm (pink columns) and cold exposure (blue columns, both n = 15). Left SCV temperature was lower than right SCV during cold exposure but the effect of sertraline was similar in both SCV regions. (j) The correlation in the change in total 18F-FDG uptake by BAT (BAT activity) between placebo and sertraline phases with the change in cold-induced thermogenesis (CIT) between phases (n = 15). (k-i) Circulating (k) sertraline and (l) norsertraline drug concentrations (n = 15), lines detail the median values. Male and female subjects are depicted by black and red circles / squares respectively. Data are mean ± SEM and were analysed using (a-f, k-l) Wilcoxon signed-rank test, (g-h) paired t test, (i) two-way repeated measures ANOVA or (j) Pearson correlation. Significant P values are detailed in the respective panels. Source data

References

    1. McNeill BT, Suchacki KJ, Stimson RH. MECHANISMS IN ENDOCRINOLOGY: Human brown adipose tissue as a therapeutic target: warming up or cooling down? Eur. J. Endocrinol. 2021;184:R243–R259. doi: 10.1530/EJE-20-1439. - DOI - PMC - PubMed
    1. Cannon B, Nedergaard J. Brown adipose tissue: function and physiological significance. Physiol. Rev. 2004;84:277–359. doi: 10.1152/physrev.00015.2003. - DOI - PubMed
    1. Ouellet V, et al. Brown adipose tissue oxidative metabolism contributes to energy expenditure during acute cold exposure in humans. J. Clin. Invest. 2012;122:545–552. doi: 10.1172/JCI60433. - DOI - PMC - PubMed
    1. Porter C, et al. Human and mouse brown adipose tissue mitochondria have comparable UCP1 function. Cell Metab. 2016;24:246–255. doi: 10.1016/j.cmet.2016.07.004. - DOI - PMC - PubMed
    1. Saito M, et al. High incidence of metabolically active brown adipose tissue in healthy adult humans: effects of cold exposure and adiposity. Diabetes. 2009;58:1526–1531. doi: 10.2337/db09-0530. - DOI - PMC - PubMed

Publication types

MeSH terms