. 2024 Jun;42(6):916-926.
doi: 10.1038/s41587-023-01881-x. Epub 2023 Aug 3.

Systematic benchmarking of single-cell ATAC-sequencing protocols

Affiliations

Systematic benchmarking of single-cell ATAC-sequencing protocols

Florian V De Rop et al. Nat Biotechnol. 2024 Jun.

Abstract

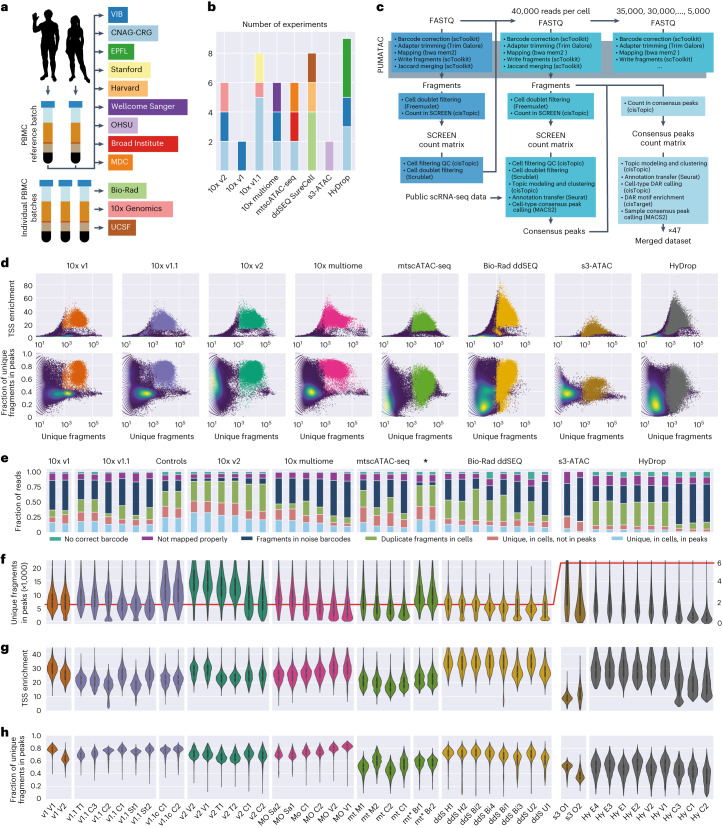
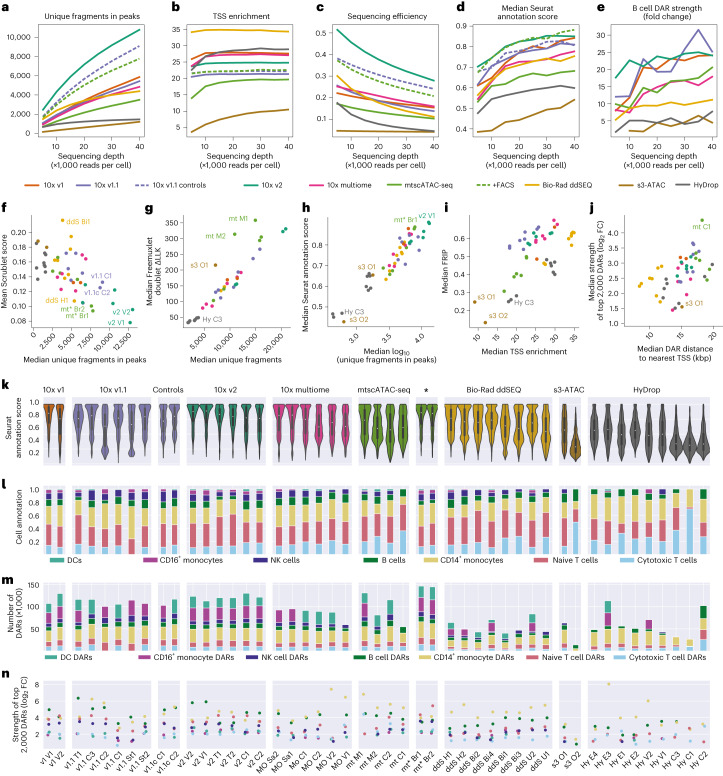
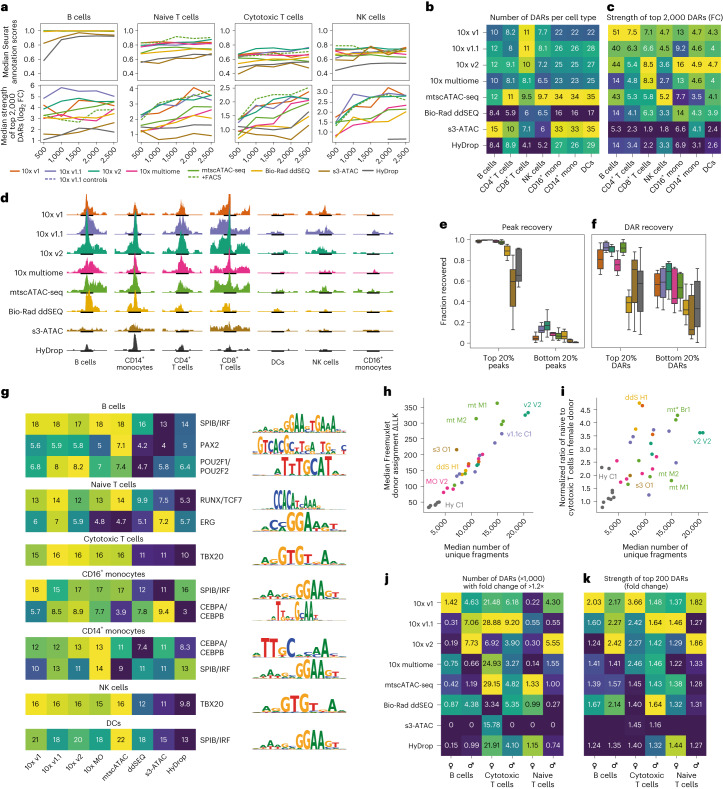
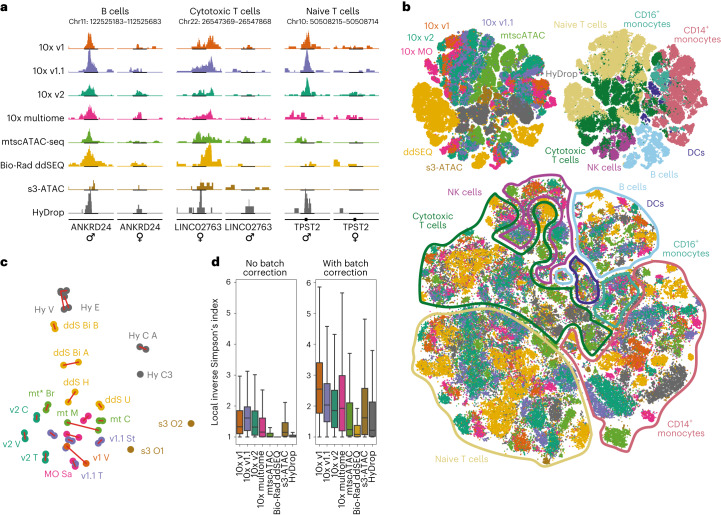
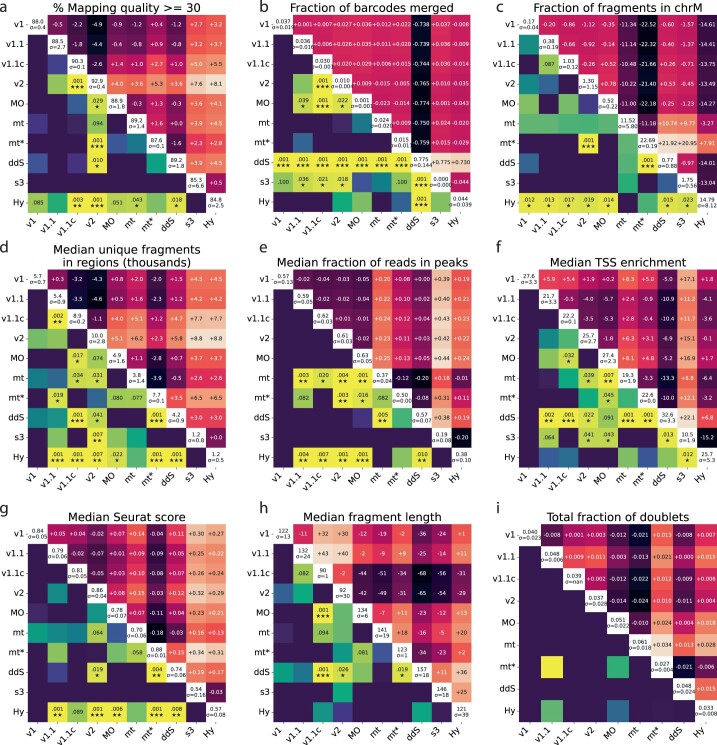
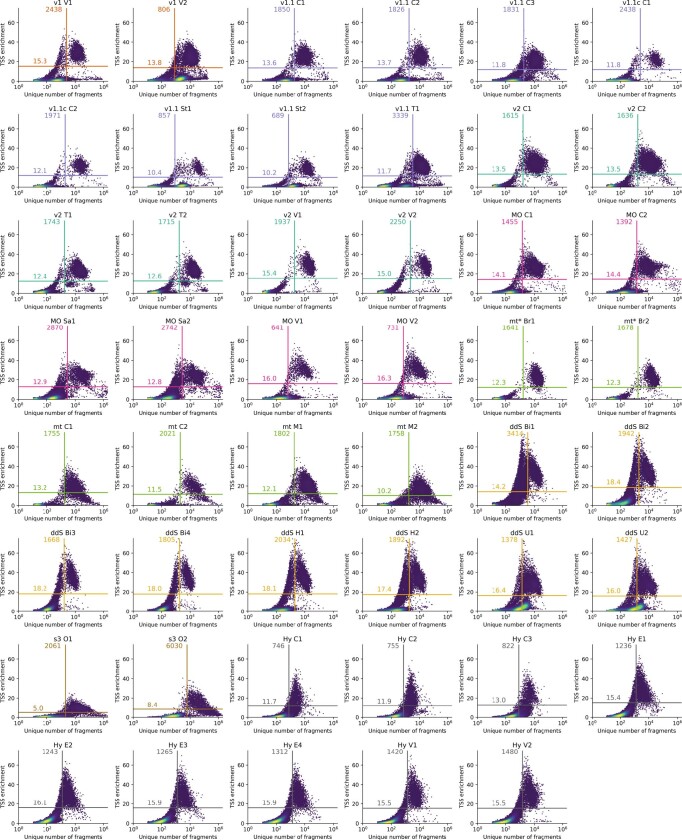
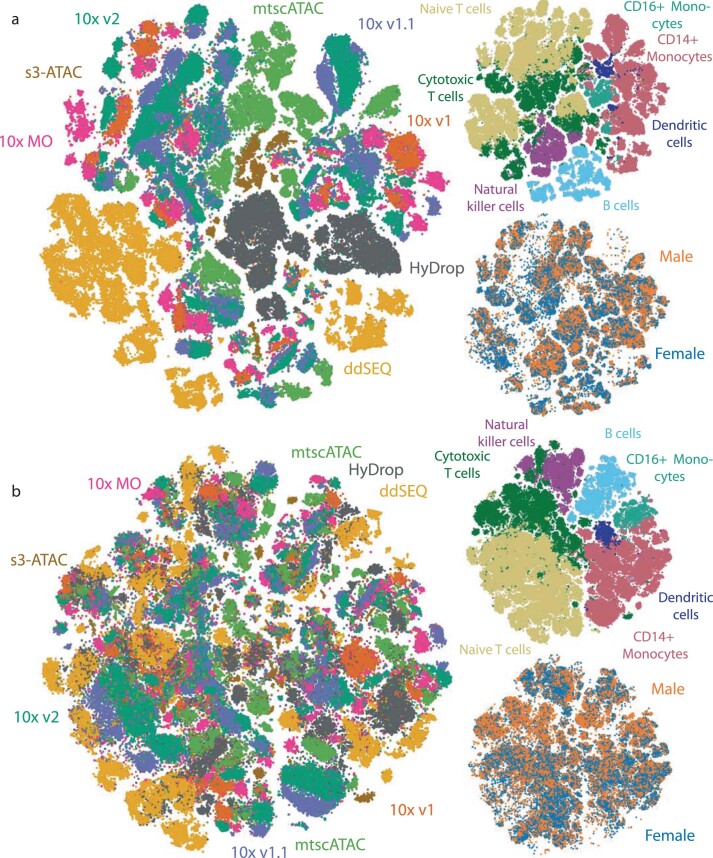
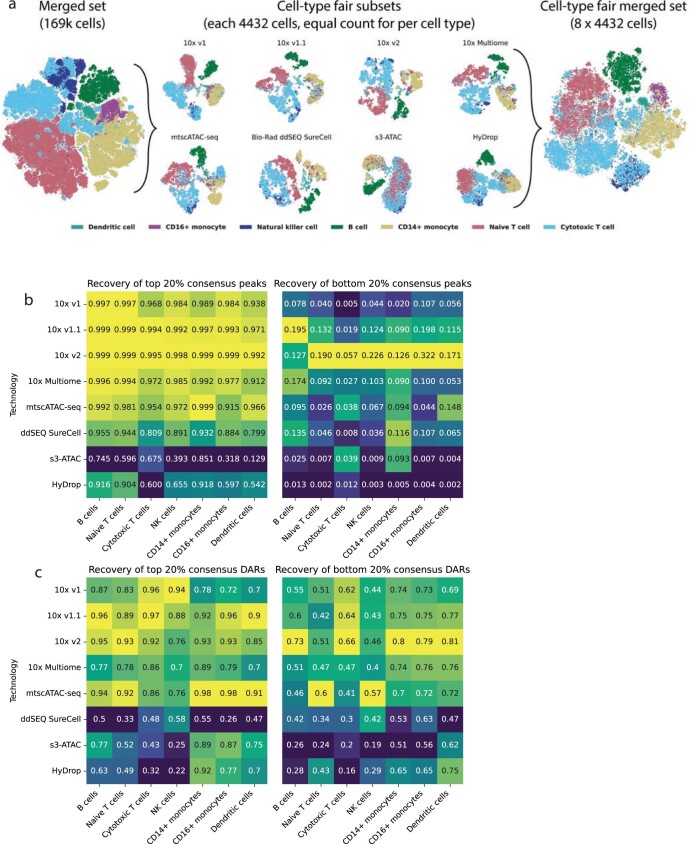
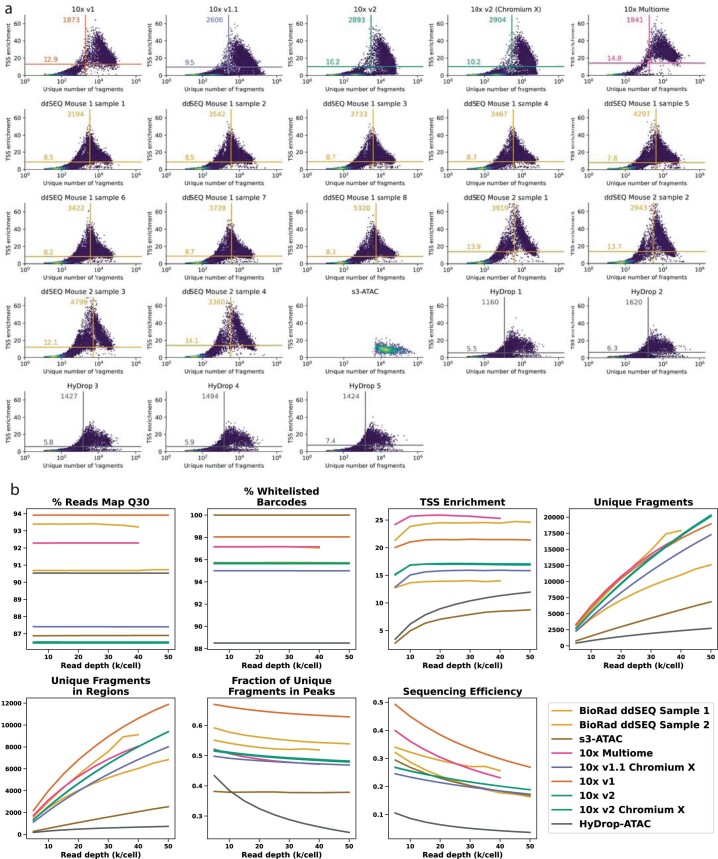
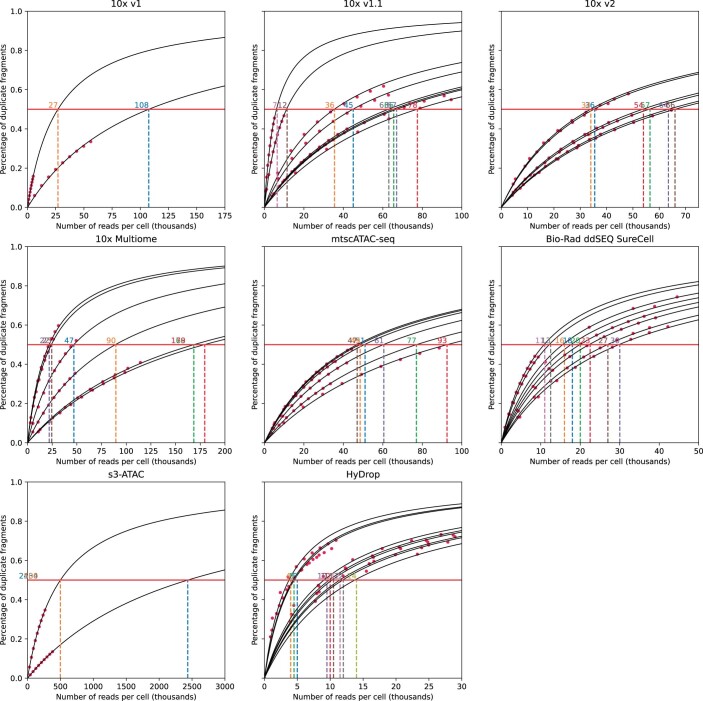
Single-cell assay for transposase-accessible chromatin by sequencing (scATAC-seq) has emerged as a powerful tool for dissecting regulatory landscapes and cellular heterogeneity. However, an exploration of systemic biases among scATAC-seq technologies has remained absent. In this study, we benchmark the performance of eight scATAC-seq methods across 47 experiments using human peripheral blood mononuclear cells (PBMCs) as a reference sample and develop PUMATAC, a universal preprocessing pipeline, to handle the various sequencing data formats. Our analyses reveal significant differences in sequencing library complexity and tagmentation specificity, which impact cell-type annotation, genotype demultiplexing, peak calling, differential region accessibility and transcription factor motif enrichment. Our findings underscore the importance of sample extraction, method selection, data processing and total cost of experiments, offering valuable guidance for future research. Finally, our data and analysis pipeline encompasses 169,000 PBMC scATAC-seq profiles and a best practices code repository for scATAC-seq data analysis, which are freely available to extend this benchmarking effort to future protocols.


Conflict of interest statement

H.H. is a cofounder and equity holder of Omniscope, a Scientific Advisory Board member of MiRXES and a consultant to Moderna. A.R. is a founder and equity holder of Celsius Therapeutics, an equity holder in Immunitas Therapeutics and, until 31 August 2020, was a Scientific Advisory Board member of Syros Pharmaceuticals, Neogene Therapeutics, Asimov and Thermo Fisher Scientific. A.R. is an employee of Genentech and has equity in Roche. O.R.-R. is an employee of Genentech. A.R. and O.R.-R. are co-inventors on patent applications filed by the Broad Institute relating to single-cell genomics. In the past 3 years, S.A.T. has received remuneration for Scientific Advisory Board Membership from Sanofi, GlaxoSmithKline, Foresite Labs and Qiagen. S.A.T. is a cofounder of and holds equity in Transition Bio. 10x Genomics has licensed intellectual property on which W.J.G. is listed as an inventor. W.J.G. holds options in 10x Genomics and is a consultant for Ultima Genomics, Guardant Health. W.J.G. is a scientific cofounder of Protillion Biosciences. J.D.B. holds patents related to ATAC-seq and SHARE-seq and is a Scientific Advisory Board member of Camp4 and seqWell. A.A. is an author on licensed patents that cover the nucleosome disruption and indexed tagmentation design. L.L. holds a patent for lineage tracing using mitochondrial genome mutations and single-cell genomics and is a consultant to Cartography Biosciences. B.D. is cofounder and shareholder of Alithea Genomics. The remaining authors declare no competing interests.

Figures

Fig. 1
Fig. 1. Overview of experimental design and low-level quality control metrics.
a, Schematic overview of the experimental design; CNAG-CRG, Centro Nacional de Análisis Genómico; EPFL, École Polytechnique Fédérale de Lausanne; OHSU, Oregon Health & Science University; MDC, Max Delbrück Center for Molecular Medicine in the Helmholtz Association; UCSF, University of California San Francisco; VIB, Vlaams Instituut voor Biotechnologie. b, Bar chart of the number of experiments performed per technology colored by institute of origin. c, Diagram of the universal PUMATAC data analysis pipeline and further downstream analyses; QC, quality control. d, Distribution of TSS enrichment, FRIP and total unique fragment counts for all barcodes across all technologies. The blue, green and yellow color scale denotes local density. Saturated colors mark barcodes identified as cells. The distributions for individual samples are shown in Extended Data Fig. 2. e, Stacked bar plot showing the fraction of reads lost across each step of data processing. ‘Unique, in cells, in peaks’ is the final fraction of sequencing reads retained in count matrices. Asterisk among technology names indicates mtscATAC-seq samples performed on PBMC that were viability FAC-sorted prior to tagmentation. fh, Distributions of unique fragments in peaks (f), TSS enrichment (g) and fraction of unique fragments in peaks (h) in filtered cell barcodes. The scale was shifted to accommodate lower fragment counts in s3-ATAC and HyDrop, indicated by a red line denoting a value of 6,000; n = 178,453 cells (before doublet filtering) examined over 47 independent experiments. Median values are indicated by central white dots, quartiles are indicated by black boxes, and minima/maxima/centers are not indicated. Source data
Fig. 2
Fig. 2. Differences in automated cell-type annotation accuracy and differential region calling between techniques.
ae, Line graphs showing the effect of sequencing depth (×1,000 reads per cell) on unique fragments in peak regions (a), TSS enrichment (b), sequencing efficiency (fraction of reads that are associated with filtered cells, not duplicated and located within a peak region; c), median Seurat label transfer score (d) and fold change enrichment of B cell DARs (e). f, Scatter plot of mean Scrublet score and median unique number of fragments in peaks across cells. g, Scatter plot of the median LLK (log likelihood) of Freemuxlet’s per cell doublet classification and median unique number of fragments across cells. h, Scatter plot of median Seurat score and median log10 of unique fragments in peaks in cells. i, Scatter plot of median FRIP and median TSS enrichment across cells in each sample. j, Scatter plot of log2 (fold change) (log2 (FC)) enrichment of the top 2,000 DARs across cell types and median distance of DARs to the nearest TSS (bp). Sample s3 O2 is omitted due to it being an outlier with a median distance of >300,000 bp; kbp, kilobase pairs. In fj, each point represents one experiment, and points are colored by technique. k, Distributions of Seurat scores across samples. l, Fraction of cell types recovered in cells from individual samples; n = 169,156 cells (after doublet filtering) examined over 47 independent experiments. Median values are indicated by central white dots, quartiles are indicated by black boxes, and minima/maxima/centers are not indicated. m, Number of DARs recovered per cell type across samples. n, log2 (fold change enrichment) of the top 2,000 DARs colored by cell type. Source data
Fig. 3
Fig. 3. Performance differences in detection of motif enrichment and sexual dimorphisms.
a, Dependency of Seurat label transfer scores and average log2 (fold change) of the top 2,000 DARs in selected cell types on the total number of cells in selected cell types. b,c, Heat map of the number of DARs (b) and heat map of the fold change enrichment (c) of the top 2,000 DARs sourced from the cell-type fair merged sets for every technique across cell types. Colors are scaled per column; mono, monocytes. d, Fragment coverage within each cell type’s strongest common DAR found in the merged set. Each cell type contains an equal number of cells across technologies. All tracks are scaled to the same absolute coverage. The 10x v1 track is slightly truncated to accommodate j. e,f, Fraction of the top 20% and bottom 20% peaks and DARs found by the merged cell-type fair set recovered in subsets from individual technologies. g, Heat map of the normalized enrichment score of cell-type-specific transcription factor motifs. Colors are scaled per row. h, Scatter plot of median Freemuxlet donor assignment log likelihood difference to second-best guess and median number of unique fragments. i, Scatter plot of the ratio of naive T cells to cytotoxic T cells in male and female subpopulations and median number of unique fragments. In h and i, each point represents one experiment, and points are colored by technique. j, Heat map of the number of sex-specific DARs. Colors are scaled per column. k, Heat map of fold change enrichment of the 200 strongest sex-specific DARs. Colors are scaled per column. Source data
Fig. 4
Fig. 4. Overview of the merged dataset.
a, Genome tracks of sex-specific DARs in B cells and cytotoxic and naive T cells showing coverage in male and female subpopulations. Coverage uses a common scale across techniques within each cell type and is cell count normalized (cell counts are equal for each sex within techniques); Chr, chromosome. b, Top, t-distributed stochastic neighbor embedding (t-SNE) projection of all 167,000 filtered cells across all 47 experiments colored by technology and cell type. Bottom, batch-corrected t-SNE using technology of origin as the batch variable. Data points were randomly shuffled before plotting. c, First two principal components of all experiments based on 15 basic quality metrics. Red links indicate same day replicate experiments. Caption denotes technique followed by center of sample origin (B for BioRad, Br for Broad, C for CNAG-CRG, E for EPFL, H for Harvard, M for MDC, O for OHSU, Sa for Sanger, St for Stanford, T for 10x Genomics, U for UCSF, and V for VIB), and finally an index (either A or B) to denote the replicate set if more than one set of replicates was performed at the same center. d, Local inverse Simpson index values before and after Harmony batch correction. Source data
Extended Data Fig. 1
Extended Data Fig. 1. Games-Howell heatmaps of several quality control metrics.
Diagonal shows mean values across samples from each technology. Upper triangle shows pairwise differences between means. Lower triangle indicates significance of expected pairwise differences. mt* indicates FAC sorting for these mtscATAC-seq samples. a, % of all reads with Phred mapping quality score >= 30. b, Fraction of barcodes being the result of a Jaccard merging event (= being a barcode multiplet). c, Fraction of fragments aligned to mitochondrial genome. Figures d-g are cell-level statistics, meaning first a median is taken within each sample’s cells, and these medians are compared between techniques. d, Median unique fragments in peaks, in cells (x1000). e, Median fraction of reads in peaks in cells. f, Median TSS enrichments of reads within cells. g, Median Seurat scores across cells. h, Median fragment length in fragments files. i, Total number of doublets (both Freemuxlet + Scrublet-identified) filtered out, expressed as a fraction of total cells before doublet filtering. Source data
Extended Data Fig. 2
Extended Data Fig. 2. Individual TSS enrichment and Unique number of fragments distributions for each sample.
Thresholds on both axes calculated using Otsu’s algorithm. Barcodes meeting both thresholds (upper right quadrant) are identified as cells in further analysis.
Extended Data Fig. 3
Extended Data Fig. 3. tSNE of full, non-downsampled data.
Datapoints were randomly shuffled before plotting. a, Non-harmony-corrected tSNE of non-downsampled data, colored by technology of origin, cell type and donor identity. b, Harmony-corrected (by technology, considering 10x v1, 1.1, 2 as a single technology) tSNE of non-downsampled data, colored by technology of origin, cell type and donor identity.
Extended Data Fig. 4
Extended Data Fig. 4. Cell-type fair subsetting and peak/DAR calculation.
a, Diagram showing cell-type fair subsetting strategy. b, Heatmap showing the fraction of cell-type-fair peaks recovered by the individual technologies’ subsets, separated by cell type. c, Heatmap showing the fraction of cell-type-fair DARs recovered by the individual technologies’ subsets, separated by cell type. Source data
Extended Data Fig. 5
Extended Data Fig. 5. 10x multiome RNA performance.
a, Knee plots of RNA component of 10x multiome samples. Minimum UMI thresholds were automatically defined using Otsu’s algorithm. b, Scatterplots of number of genes versus unique fragments in peaks detected in the same multiome cells. c, Venn diagrams showing overlap between cell barcodes identified as cells based on ATAC or RNA components.
Extended Data Fig. 6
Extended Data Fig. 6. Threshold prediction curves for Seurat label transfer scores.
a, Lineplots showing fraction of reads passing the threshold with increasing thresholds. Area under curve (AUC) values for each cell type in figure legends. b, Lineplot showing label transfer agreement between RNA and ATAC modalities of 10x Multiome samples on y axis, and Seurat scores in the ATAC cell. Source data
Extended Data Fig. 7
Extended Data Fig. 7. Effect of sequencing depth on cell type annotation and DAR calling.
For these figures, all samples were downsampled to 35k, 30k, … reads per cell, and de-novo annotated with Seurat. a, Dependency of Seurat label transfer scores on sequencing depth. b, Dependency of number of DARs detected in each cell type on sequencing depth. c, Dependency of mean fold-change enrichment of top 2000 DARs detected in each cell type on sequencing depth. Source data
Extended Data Fig. 8
Extended Data Fig. 8. Effect of number of cells on cell type annotation and DAR calling.
For these figures, all samples with at least 2,500 cells were subset to 2,500, 2,000, … random cells, and de-novo annotated with Seurat. a, Dependency of Seurat label transfer scores on total number of cells. b, Dependency of number of DARs detected in each cell type on total number of cells. c, Dependency of mean log2 fold-change enrichment of top 2,000 DARs detected in each cell type on total number of cells. Source data
Extended Data Fig. 9
Extended Data Fig. 9. Public mouse cortex data reanalysis statistics.
a, TSS enrichment and unique number of fragments distributions for public mouse datasets reanalysed using PUMATAC. b, Dependency of basic quality metrics on sequencing depth across techniques. Source data
Extended Data Fig. 10
Extended Data Fig. 10. Duplication rate in fragments files.
X-axis shows the number of reads per cell (thousands), y-axis shows the percentage of fragments in cells that are duplicates. Red dots indicate data points sampled from fragments files, black lines are a fitted Michaelis-Menten curve. Red line indicates a 50% duplicate rate. Source data

References

    1. Massoni-Badosa R, et al. Sampling time-dependent artifacts in single-cell genomics studies. Genome Biol. 2020;21:112. doi: 10.1186/s13059-020-02032-0. - DOI - PMC - PubMed
    1. Mereu E, et al. Benchmarking single-cell RNA-sequencing protocols for cell atlas projects. Nat. Biotechnol. 2020;38:747–755. doi: 10.1038/s41587-020-0469-4. - DOI - PubMed
    1. Minnoye L, et al. Chromatin accessibility profiling methods. Nat. Rev. Methods Primer. 2021;1:11. doi: 10.1038/s43586-020-00008-9. - DOI - PMC - PubMed
    1. Buenrostro JD, et al. Single-cell chromatin accessibility reveals principles of regulatory variation. Nature. 2015;523:486–490. doi: 10.1038/nature14590. - DOI - PMC - PubMed
    1. Cusanovich DA, et al. A single-cell atlas of in vivo mammalian chromatin accessibility. Cell. 2018;174:1309–1324. doi: 10.1016/j.cell.2018.06.052. - DOI - PMC - PubMed

MeSH terms