. 2023 Aug 3;30(1):63.
doi: 10.1186/s12929-023-00951-1.

Optimized allotopic expression of mitochondrial ND6 transgene restored complex I and apoptosis deficiencies caused by LHON-linked ND6 14484T > C mutation

Affiliations

Optimized allotopic expression of mitochondrial ND6 transgene restored complex I and apoptosis deficiencies caused by LHON-linked ND6 14484T > C mutation

Jing Wang et al. J Biomed Sci. .

Abstract

Background: Leber's hereditary optic neuropathy (LHON) is a maternally inherited eye disease due to mutations in mitochondrial DNA. However, there is no effective treatment for this disease. LHON-linked ND6 14484T > C (p.M64V) mutation caused complex I deficiency, diminished ATP production, increased production of reactive oxygen species (ROS), elevated apoptosis, and impaired mitophagy. Here, we investigated if the allotopic expression of human mitochondrial ND6 transgene corrected the mitochondrial dysfunctions due to LHON-associated m.14484T > C mutation.

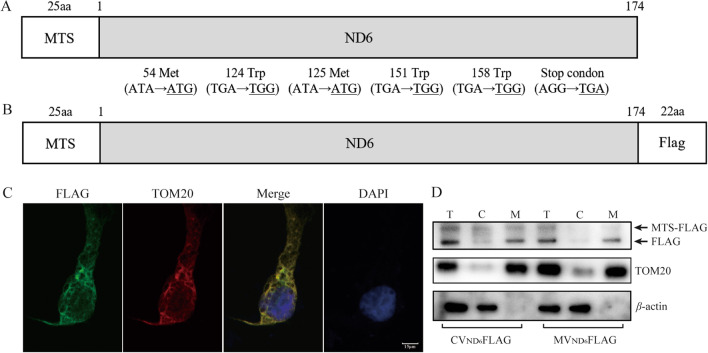
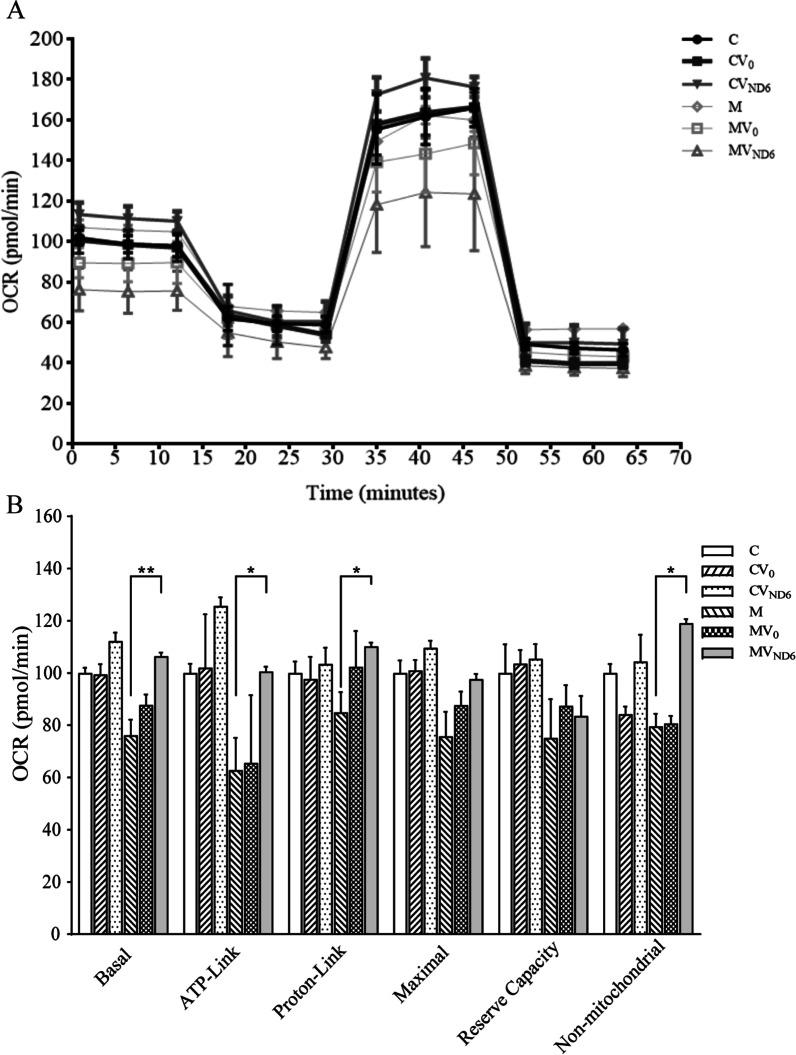
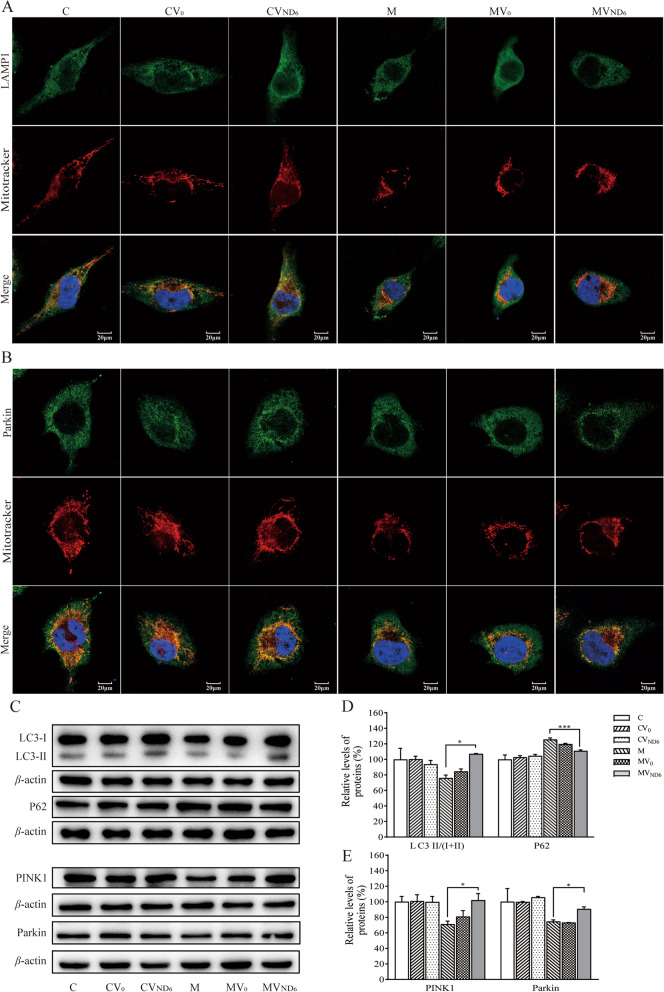
Methods: Nucleus-versions of ND6 was generated by changing 6 non-universal codons with universal codons and added to mitochondrial targeting sequence of COX8. Stable transfectants were generated by transferring human ND6 cDNA expressed in a pCDH-puro vector into mutant cybrids carrying the m.14484T > C mutation and control cybrids. The effect of allotopic expression of ND6 on oxidative phosphorylation (OXPHOS) was evaluated using Blue Native gel electrophoresis and extracellular flux analyzer. Assessment of ROS production in cell lines was performed by flow cytometry with MitoSOX Red reagent. Analyses for apoptosis and mitophagy were undertaken via flow cytometry, TUNEL and immunofluorescence assays.

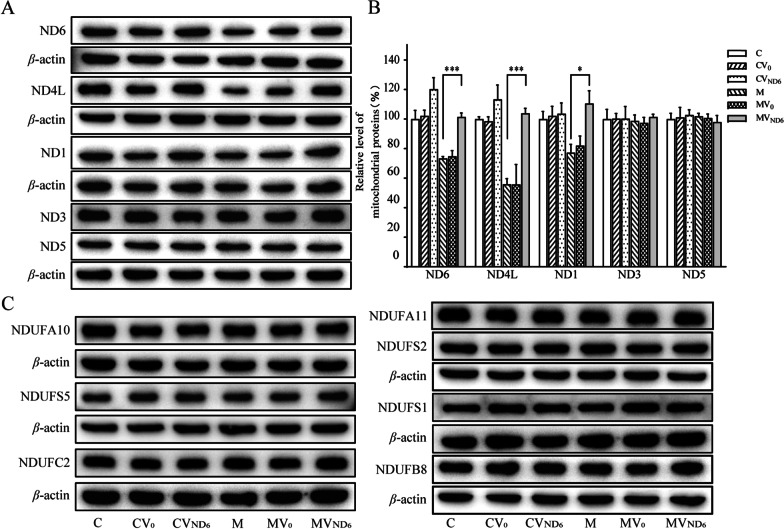
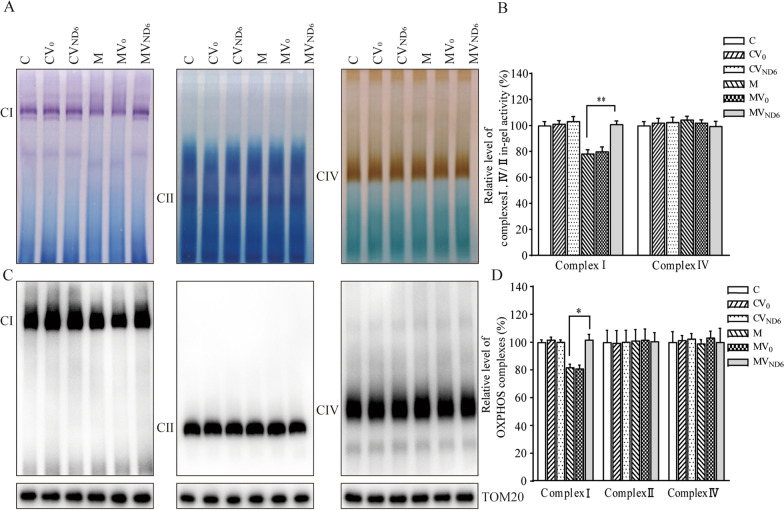
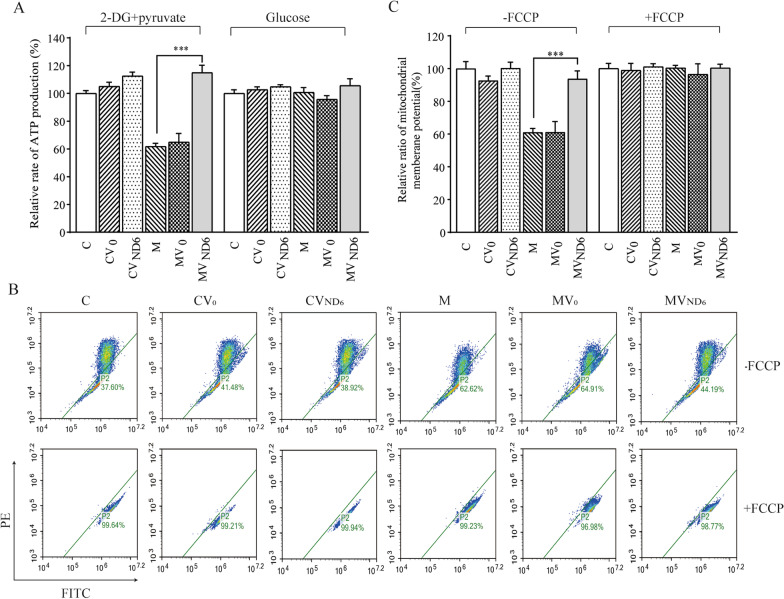
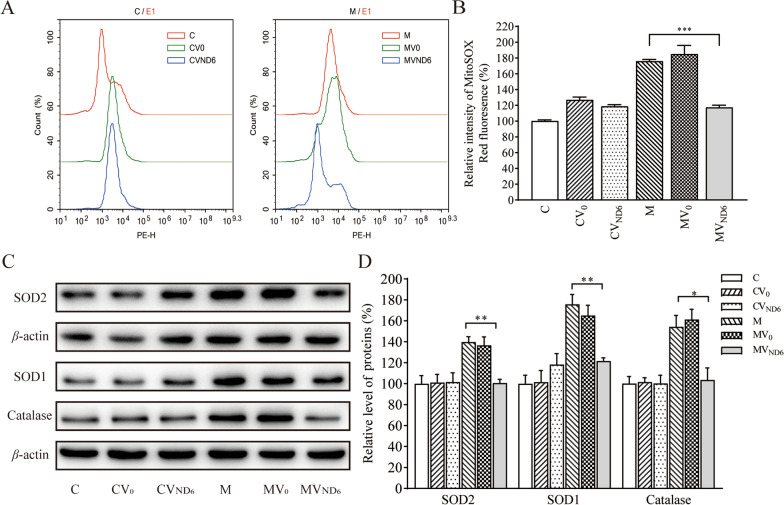
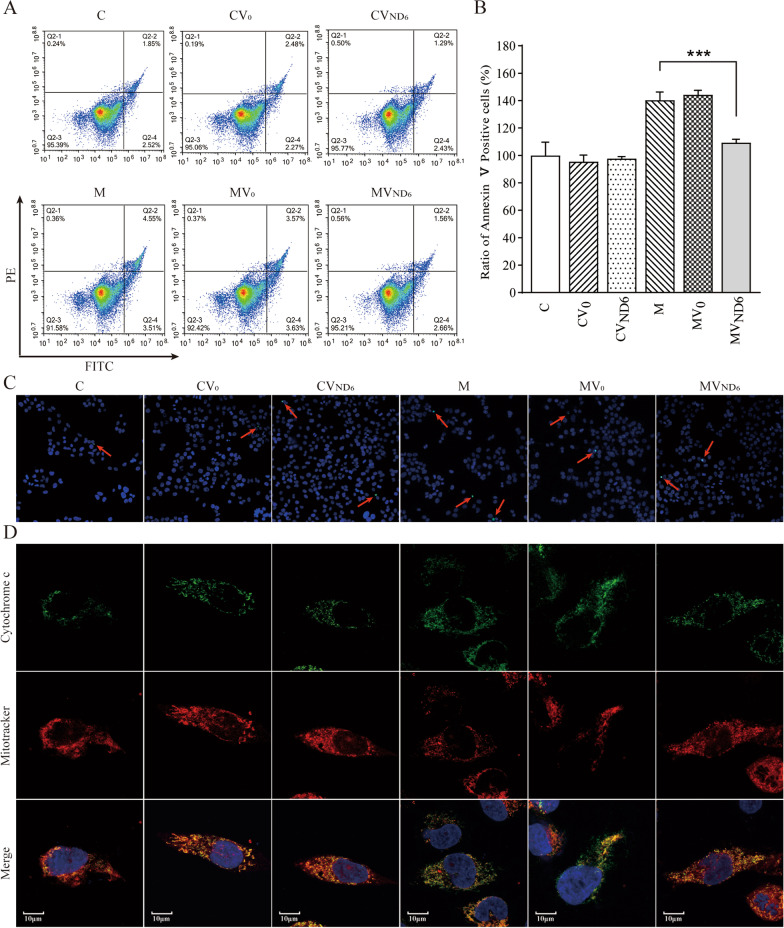
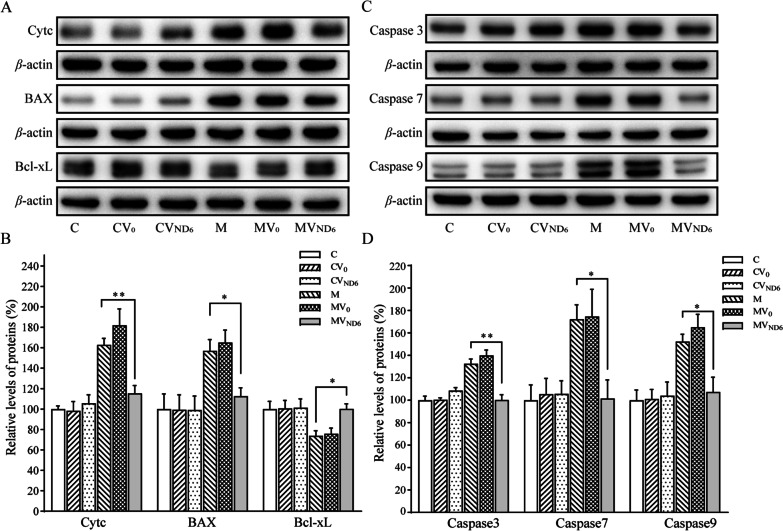
Results: The transfer of human ND6 into the cybrids carrying the m.14484T > C mutation raised the levels of ND6, ND1 and ND4L but did not change the levels of other mitochondrial proteins. The overexpression of ND6 led to 20~23% increases in the assembly and activity of complex I, and ~ 53% and ~ 33% increases in the levels of mitochondrial ATP and ΔΨm in the mutant cybrids bearing m.14484T > C mutation. Furthermore, mutant cybrids with overexpression of ND6 exhibited marked reductions in the levels of mitochondrial ROS. Strikingly, ND6 overexpression markedly inhibited the apoptosis process and restored impaired mitophagy in the cells carrying m.14484T > C mutation. However, overexpression of ND6 did not affect the ND6 level and mitochondrial functions in the wild-type cybrids, indicating that this ND6 level appeared to be the maximum threshold level to maintain the normal cell function.

Conclusion: We demonstrated that allotopic expression of nucleus-versions of ND6 restored complex I, apoptosis and mitophagy deficiencies caused by the m.14484T > C mutation. The restoration of m.14484T > C mutation-induced mitochondrial dysfunctions by overexpression of ND6 is a step toward therapeutic interventions for LHON and mitochondrial diseases.

Keywords: Allotopic expression; Apoptosis; Complex I; Leber’s hereditary optic neuropathy; Mitochondrial DNA mutation; Mitophagy.


Conflict of interest statement

All authors have no proprietary or commercial interest in any of materials discussed in this article.

Figures

Fig. 1
Fig. 1
Subcellular location of modified human ND6. A Scheme for the structure of nucleus-versions of human ND6. Six codons in mtDNA encoding ND6 were modified as universal codons. MTS of COX8 with 25  amino acids was added to initiating codon of ND6. B A carboxy terminus FLAG-tagged nucleus-versions of human ND6. C Subcellular localization of nucleus-versions human ND6 by immunofluorescence in control cybrids. FLAG-tagged ND6 (shown in green), TOM20 (nucleus-encoding mitochondrial membrane) (shown in red). Scale bars, 15 μm. D Subcellular localization of WT and MT nucleus-versions human ND6 by Western blotting with anti-FLAG, TOM20 and β-actin (cytosol). T, total cell lysate; C, cytosol; M, mitochondria
Fig. 2
Fig. 2
Analysis of complex I subunits encoded by mitochondrial and nuclear genes. A Western blot analysis of mtDNA encoding proteins. Twenty μg of total cellular proteins from various cell lines were electrophoresed through a denaturing polyacrylamide gel, electroblotted, and hybridized with ND6, ND4L, ND1, ND3 and ND5 antibodies, with β-actin as a loading control. B Quantification of ND6, ND4L, ND1, ND3 and ND5 in C, CV0, CVND6, M, MV0, and MVND6 cell lines. The calculations were based on three independent determinations in each cell line. The error bars indicate standard error of the mean (SEM). P indicates significance based on Student’s t-test of the differences between M and MVND6 cell lines. C Western blot analysis of nucleus-encoding complex I subunits. Twenty μg of total cellular proteins from various cell lines were electrophoresed through a denaturing polyacrylamide gel, electroblotted, and hybridized with NDUFA10, NDUFS5, NDUFC2, NDUFA11, NDUFS2, NDUFS1 and NDUFB8 antibodies, with β-actin as a loading control
Fig. 3
Fig. 3
Analysis of OXPHOS complexes. A In-gel activity of complexes I, II and IV. The activities of OXPHOS complexes from various cell lines after BN-PAGE were measured in the presence of specific substrates [NADH and NTB for complex I, sodium succinate, phenazine methosulfate, and NTB for complex II, DAB and cytochrome c for complex IV]. B Quantification of in-gel activities of complexes I and IV. The calculations were based on three independent determinations in each cell line. C The levels of complexes I, II and IV by BN-PAGE. Twenty micrograms of mitochondrial proteins from various cell lines were electrophoresed through a BN- gel, electroblotted and hybridized with antibodies specific for subunits of complexes I, II and IV complexes (NDUFS2 antibody for complex I, SDHB antibody for complex II, and COX5A antibody for complex IV), and with TOM20 as a loading control. D Quantification of levels of complexes I, II, and IV. The calculations were based on three independent determinations in each cell line. Graph details and symbols are explained in the legend to Fig. 2
Fig. 4
Fig. 4
Respiration assays. A An analysis of O2 consumption in the various cell lines using different inhibitors. The OCRs were first measured on 2 × 104 cells of each cell line under basal conditions and then sequentially added to oligomycin (1.0 µM), FCCP (0.5 µM), rotenone (1.0 µM), and antimycin A (1.0 µM) at the indicated times to determine the different parameters of mitochondrial functions. B Graphs show the basal OCR, ATP-linked OCR, proton leak OCR, maximal OCR, reserve capacity, and non-mitochondrial OCR among six cell lines. The non-mitochondrial OCR was determined as the OCR after rotenone/antimycin A treatment. The basal OCR was determined as the OCR before oligomycin minus the OCR after rotenone/antimycin A treatment. The ATP-linked OCR was determined as the OCR before oligomycin minus the OCR after oligomycin. The proton leak OCR was determined as the basal OCR minus the ATP-linked OCR. The maximal OCR was determined as the OCR after FCCP minus the non-mitochondrial OCR. Reserve capacity was defined as the difference between the maximal OCR after FCCP minus the basal OCR. The average values of three independent experiments for each cell line are shown. Graph details and symbols are explained in the legend to Fig. 2
Fig. 5
Fig. 5
Measurements of mitochondrial ATP levels and membrane potential. A ATP levels among six cell lines C, CV0, CVND6, M, MV0, and MVND6 were measured using a luciferin/luciferase assay. Cells were incubated with 10 mM glucose or 5 mM 2-DG plus 5-mM pyruvate to determine ATP generation under mitochondrial ATP synthesis. Average rates of total cellular and mitochondrial ATP level per cell line and are shown. Three independent experiments were made for each cell line. B and C Mitochondrial membrane potential analysis. B Represented flow cytometry images of the six cell lines C, CV0, CVND6, M, MV0, and MVND6 in the presence and absence of 10 μM of FCCP. C The relative ratios of JC-10 fluorescence intensities at excitation/emission of 490/530 nm and 490/590 nm in the absence and presence of FCCP (C). Three independent experiments were made for each cell line. Graph details and symbols are explained in the legend to Fig. 2
Fig. 6
Fig. 6
Assays for ROS production. The rates of ROS generation by mitochondria in living cells from six cell lines were analyzed by a Novocyte flow cytometer (ACEA Biosciences) using the mitochondrial superoxide indicator MitoSOX-Red (5 μM). A Flow cytometry histogram showing MitoSOX-Red fluorescence of various cell lines. B The relative ratios of intensity were calculated. The average values of three independent determinations for each cell line were shown. C Western blotting analysis of anti-oxidative enzymes SOD1, SOD2 and catalase in six cell lines with β-actin as a loading control. D Quantification of SOD1, SOD2 and catalase. Three independent experiments were made for each cell line. Graph details and symbols are explained in the legend to Fig. 2
Fig. 7
Fig. 7
Apoptosis assays. A Annexin V/PI apoptosis assay by flow cytometry. Cells were harvested and stained with Annexin V and 1 μL of propidium iodide. The percentage of Annexin V-positive cells were then assessed. B Relative Annexin V-positive cells from various cell lines. Three independent determinations were done in each cell line. C TUNEL assays of the six cell lines C, CV0, CVND6, M, MV0, and MVND6. Arrows indicate death cells. D Immunofluorescence analysis. The distributions of cytochrome c from the six cell lines were visualized by immunofluorescent labeling with cytochrome c antibody conjugated to Alex Fluor 488 (green) and Mitotracker (red) analyzed by confocal microscopy. DAPI stained nuclei were identified by their blue fluorescence
Fig. 8
Fig. 8
Analysis of apoptosis-associated proteins. A Western blotting analysis. Twenty micrograms of total cellular proteins from various cell lines were electrophoresed through a denaturing polyacrylamide gel, electroblotted, and hybridized with cytochrome c, BAX and Bcl-xL antibodies, with β-actin as a loading control. B Quantification of cytochrome c, BAX and Bcl-xL. Three independent experiments were made for each cell line. C Western blotting analysis of apoptosis-associated protein uncleaved caspases 3, caspases 7 and caspases 9 in six cell lines with β-actin as a loading control. D Quantification of uncleaved caspases 3, caspases 7 and caspases 9. Three independent experiments were made for each cell line. Graph details and symbols are explained in the legend to Fig. 2
Fig. 9
Fig. 9
Analysis of mitophagy. A and B Immunofluorescence analysis. The distributions of LAMP1 (A) and Parkin (B) from various cell lines were visualized by immunofluorescent staining with mitochondrial dye MitoTracker (red) and labeling with LAMP1 or Parkin. Scale bars: 20 µm. C Western blot analysis. Twenty micrograms of total cellular proteins from various cell lines were electrophoresed through a denaturing polyacrylamide gel, electroblotted, and hybridized with LC3, P62, PINK1, Parkin antibodies, with β-actin as a loading control, respectively. D and E Quantification of LC3 II/(I + II), P62, PINK1 and Parkin. Three independent experiments were done for each cell line. Graph details and symbols are explained in the legend to Fig. 2

References

    1. Wallace DC, Lott MT. Leber hereditary optic neuropathy: exemplar of an mtDNA disease. Handb Exp Pharmacol. 2017;240:339–376. doi: 10.1007/164_2017_2. - DOI - PubMed
    1. Yu-Wai-Man P, Griffiths PG, Chinnery PF. Mitochondrial optic neuropathies—disease mechanisms and therapeutic strategies. Prog Retin Eye Res. 2011;30:81–114. doi: 10.1016/j.preteyeres.2010.11.002. - DOI - PMC - PubMed
    1. Newman NJ. Hereditary optic neuropathies: from the mitochondria to the optic nerve. Am J Ophthalmol. 2005;140:517–523. doi: 10.1016/j.ajo.2005.03.017. - DOI - PubMed
    1. Yen MY, Wang AG, Wei YH. Leber’s hereditary optic neuropathy: a multifactorial disease. Prog Retin Eye Res. 2006;25:381–396. doi: 10.1016/j.preteyeres.2006.05.002. - DOI - PubMed
    1. Carelli V, La Morgia C, Valentino ML, Barboni P, Ross-Cisneros FN, Sadun AA. Retinal ganglion cell neurodegeneration in mitochondrial inherited disorders. Biochim Biophys Acta. 2009;1787:518–528. doi: 10.1016/j.bbabio.2009.02.024. - DOI - PubMed

MeSH terms