

Association between the distal tibiofibular syndesmosis morphology classification and ankle osteoarthritis: a retrospective study
- PMID: 37537622
- PMCID: PMC10401784
- DOI: 10.1186/s13018-023-03985-1
Association between the distal tibiofibular syndesmosis morphology classification and ankle osteoarthritis: a retrospective study
Abstract
Background: Syndesmosis injury is proposed to contribute to ankle stability and osteoarthritis (OA). However, whether distal tibiofibular syndesmosis structure is closely related to ankle OA is unclear. We hypothesized that different DTS morphology classifications would affect the biomechanics properties in ankle OA. The study aimed to determine the association between the distal tibiofibular syndesmosis (DTS) morphological classification and ankle OA.
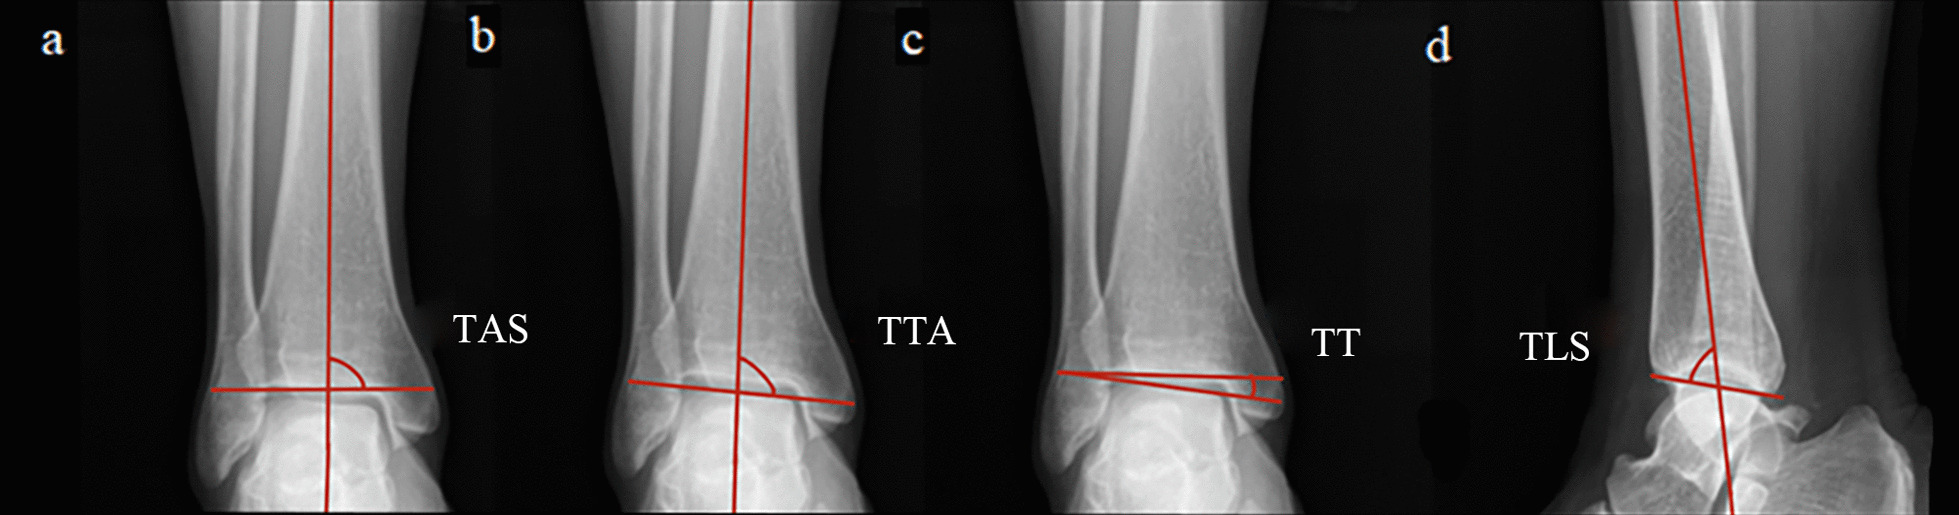
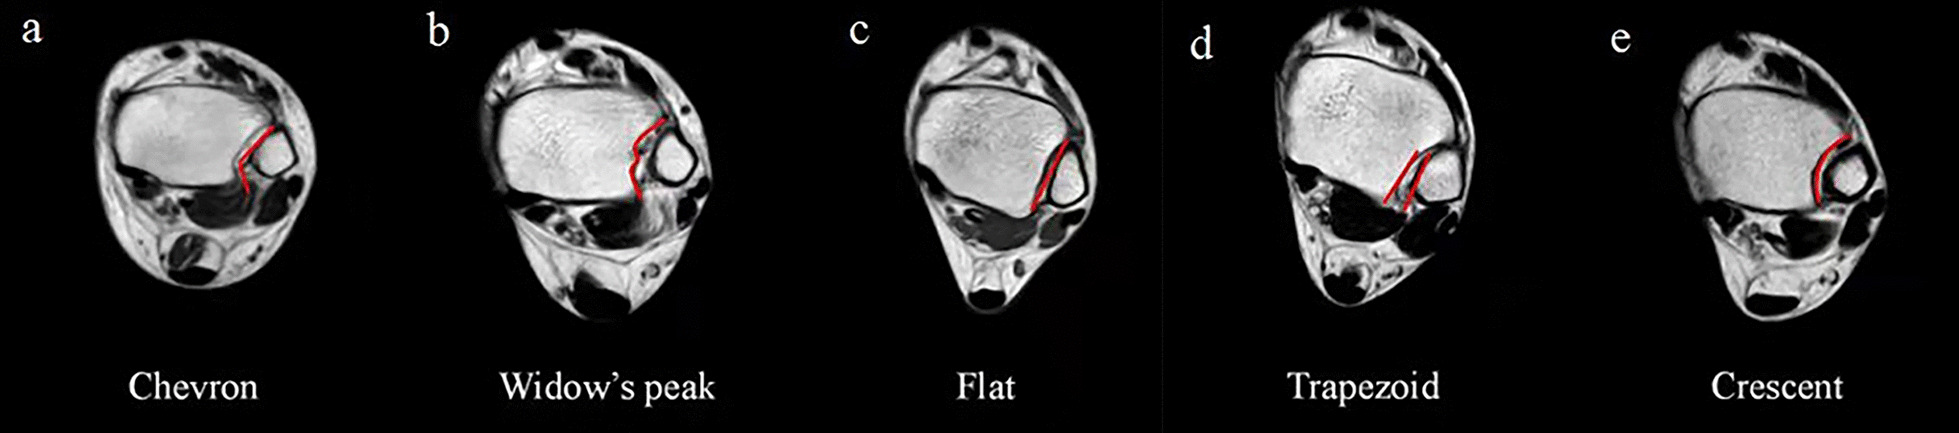
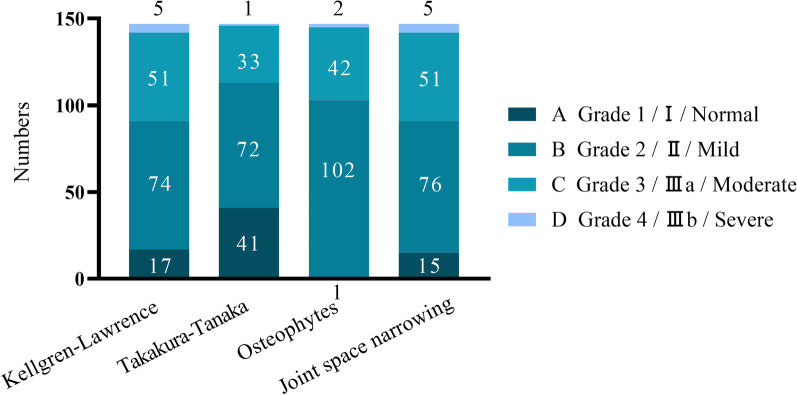
Methods: This is a retrospective study examining imaging data of 147 patients (87 males and 60 females) with ankle OA. Magnetic resonance imaging was used to access the DTS morphological classification, according to measuring various parameters. Joint space narrowing and osteophytes were measured using ankle weight-bearing radiography. The classification and parameters were analyzed to determine the relationship between the syndesmosis classification and the abnormality of ankle OA.
Results: Five morphological classifications of the DTS, including Chevron (19.6%), Widow's peak (16.2%), Flat (22.3%), Trapezoid (32.0%), and Crescent (19.6%), were shown. There were statistical differences between DTS classification and tibial angle surface angle (TAS) (P = .009) and talar tilt angle (TTA) (P = .014). The TAS (degree) of the Crescent (86.47 ± 3.21) was less than Chevron (88.75 ± 2.72) (P = .006), Widow's peak (89.26 ± 3.15) (P = .001), Flat (88.83 ± 3.62) (P = .003) and Trapezoid (88.11 ± 2.62) (P = .041), respectively. The TTA (degree) of Crescent (86.83 ± 5.30) was less than Chevron (89.28 ± 2.46) and Widow's peak (89.82 ± 3.41). The men were greater than women for TAS (P = .008) and angle (P = .003), which are consistent with osteophyte (P = .019) and the modified Kellgren-Lawrence grades (P = .041) between gender.
Conclusions: DTS morphological classification might affect the biomechanics properties in TAS and TTA in ankle OA. In clinical practice, surgeons should pay attention to the effects of DTS on ankle OA.
Level of evidence: Level III, retrospective study.
Keywords: Ankle osteoarthritis; Distal tibiofibular syndesmosis; Morphology classification.
© 2023. BioMed Central Ltd., part of Springer Nature.
Conflict of interest statement
All other co-authors declare no competing interests.
Figures


References
-
- Peyron J. The epidemiology of osteoarthritis. In: Moskowitz RW, Goldberg VM, Mankin HJ, editors. Osteoarthritis: diagnosis and treatment. Philadelphia: WB Saunders; 1984. pp. 9–27.
MeSH terms
Grants and funding
- 2022YFS0609/Supported by Sichuan Science and Technology Program
- 2021ZYD0078/Central Funds Guiding the Local Science and Technology Development General Program of Sichuan Provincial Science and Technology Department
- 2022-CXTD-08/Scientific Research Cultivation Project of The Affiliated Traditional Chinese Medicine Hospital of Southwest Medical University
- 2023MS248/General Project of Sichuan Traditional Chinese Medicine Administration Traditional Chinese Medicine Research Special Project
LinkOut - more resources
Full Text Sources
Medical
Research Materials
