. 2023 Aug 29;42(8):112879.
doi: 10.1016/j.celrep.2023.112879. Epub 2023 Aug 2.

Polyclonal lymphoid expansion drives paraneoplastic autoimmunity in neuroblastoma

Affiliations

Polyclonal lymphoid expansion drives paraneoplastic autoimmunity in neuroblastoma

Miriam I Rosenberg et al. Cell Rep. .

Abstract

Neuroblastoma is a lethal childhood solid tumor of developing peripheral nerves. Two percent of children with neuroblastoma develop opsoclonus myoclonus ataxia syndrome (OMAS), a paraneoplastic disease characterized by cerebellar and brainstem-directed autoimmunity but typically with outstanding cancer-related outcomes. We compared tumor transcriptomes and tumor-infiltrating T and B cell repertoires from 38 OMAS subjects with neuroblastoma to 26 non-OMAS-associated neuroblastomas. We found greater B and T cell infiltration in OMAS-associated tumors compared to controls and showed that both were polyclonal expansions. Tertiary lymphoid structures (TLSs) were enriched in OMAS-associated tumors. We identified significant enrichment of the major histocompatibility complex (MHC) class II allele HLA-DOB01:01 in OMAS patients. OMAS severity scores were associated with the expression of several candidate autoimmune genes. We propose a model in which polyclonal auto-reactive B lymphocytes act as antigen-presenting cells and drive TLS formation, thereby supporting both sustained polyclonal T cell-mediated anti-tumor immunity and paraneoplastic OMAS neuropathology.

Keywords: CP: Cancer; CP: Immunology; IgH; TCRB; ataxia; autoimmunity; immune profiling; myoclonus; neuroblastoma; opsoclonus; paraneoplastic; repertoires.


Conflict of interest statement

Declaration of interests The authors declare no competing interests.

Figures

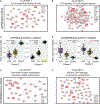
Figure 1.
Figure 1.. RNA-seq analysis highlights enhanced lymphocytic infiltration and activation in OMAS-associated neuroblastoma compared to control neuroblastoma
(A) A volcano plot comparing expression (log2 fold change) of transcripts (as dots) in OMAS-associated neuroblastoma compared to non-OMAS neuroblastoma (OMAS, n = 38; non-OMAS, n = 26). The x axis indicates enrichment of expression in OMAS. Significance of differential expression (−log P value) is given on the y axis. Adjusted p < 0.05 indicated in red. Gene names in black are given for genes with expression differences of greater than log2(2.25-fold) between groups. Gene names referred to in subsequent analyses labeled in light and dark blue and purple. (B–D) CIBERSORT analysis of gene expression values from tumor RNA-seq permit estimates of immune cell fractions in OMAS vs. control neuroblastoma tumor infiltrate, including (B) memory B cells, (C) CD8+ T cells, and (D) follicular T helper cell fractions.
Figure 2.
Figure 2.. Clustering and network analysis of differentially expressed genes between OMAS-associated neuroblastoma and control neuroblastoma
Differentially expressed genes meeting fold-change and significance thresholds were used to identify sets of coregulated genes (clusters) using coseq, and further analyzed for connectivity using GENIE3. Network diagrams were plotted using Cytoscape. Line weight indicates number of connections. Genes accounting for 20% of all connections were designated as putative hub genes (red ovals). (A–C) Gene clusters upregulated in OMAS-associated neuroblastoma relative to control neuroblastoma. (A and B) Network diagrams of two gene clusters upregulated in OMAS compared to non-OMAS samples.(C) Boxplot showing average expression profile for each patient subgroup in each upregulated cluster. Dots indicate mean values for one gene in the signature in that sample group. LR and HR comprise the non-OMAS subgroup from (A) and (B). (D–F) Gene clusters downregulated in OMAS-associated neuroblastoma relative to control neuroblastoma. (D and E) Network diagrams of two gene clusters downregulated in OMAS compared to non-OMAS samples. (F) Boxplot showing average expression profile for each patient subgroup in each downregulated cluster. Dots indicate mean values for one gene in the signature in that sample group. LR and HR comprise the non-OMAS subgroup from (D) and (E).
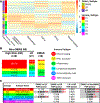
Figure 3.
Figure 3.. Cancer immune subtype classification identifies dominant immune signaling pathways in neuroblastoma patient cohort
Immune subtype classifications were applied using normalized RNA-seq (log) expression levels for each patient, as previously described. (A) Features of immune subtypes. Distinctive features of immune response correlated with each subtype C1–C6 based on meta-analysis of The Cancer Genome Atlas (TCGA) cancer dataset are indicated. (B) Distribution of immune subtypes in OMAS and control neuroblastomas in this cohort. (C) Enrichment of immune subtypes in OMAS relative to control neuroblastoma patient groups are indicated. Significant values are shaded in gray.
Figure 4.
Figure 4.. OMAS tumor-infiltrating TCR analysis reveals significant diversity and small clones with limited similarity
For (A)–(E), sample numbers are OMAS, n = 29; LR, n = 11; HR, n = 9. (A) Repertoire size. Number of TCRβ sequences in each patient repertoire, normalized for input DNA amount. (B) Shannon diversity index of OMAS-associated and non-OMAS-associated neuroblastoma TCRβ repertoires. Repertoires were subsampled to 1,382 sequences and Shannon index computed. Average over 100 iterations plotted for each patient. Median value indicated in red. (C) Gini index of inequality of OMAS-associated and non-OMAS neuroblastoma TCRβ repertoires. Average over 100 iterations plotted for each patient. Median value indicated in red. (D) Sums of clonal frequencies for top 100 clones of TCRβ repertoires. Cumulative individual frequencies of top 100 clones in each patient repertoire were summed and plotted as a single point. Median value in each patient subgroup indicated in red. (E) PCA plot of Hill values for TCR repertoires. Hill values were used to describe the diversity of the TCR repertoires. The PCA plot of all patient samples depicts two clusters according to their top two principal components. One cluster composed of OMAS samples is roughly indicated with a purple oval (cluster 1), while another cluster, composed of samples from all groups, is indicated by an orange oval (cluster 2). (F) Sequence sharing in OMAS and non-OMAS patient TCRβ repertoires. Each dot represents the fraction of sequences in the given sharing level, normalized by the number of samples in each group. The figure is in log10-log10 scale. Sample numbers for sharing level calculations: OMAS, 31; LR, 13; HR, 13.
Figure 5.
Figure 5.. IgH repertoire analysis of TILs reveals greater diversity and reduced clonality of OMAS-associated neuroblastoma BCR repertoires
For this analysis, sample numbers passing minimum repertoire size cutoff were OMAS, n = 20; HR, n = 5; LR, n = 8. (A) Repertoire size. Number of IgH sequences in each patient repertoire, normalized for input DNA amount. (B) Shannon diversity index of OMAS- and non-OMAS-associated neuroblastoma IgH repertoires. Mean index value after 100 iterations of subsampling and index calculation is plotted as one point for each patient. Red line indicates median for each patient group. (C) Clone size of OMAS- and non-OMAS-associated neuroblastoma TIL repertoires. Summed frequency of top 100 clones in each patient is given as a point. Red line indicates median value for each patient group. (D) IgH clusters enriched in OMAS. Clusters of IgH sequences with at least 85% sequence similarity and comprising at least seven OMAS patients and not more than two LR or HR patients are shown, with V family, J family junction length, and cluster index indicated.
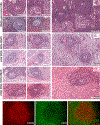
Figure 6.
Figure 6.. Lymphocyte enrichment and localization to TLSs in OMAS-associated neuroblastomas
(A–I) H&E staining of TLS and GC-like (GC-L) TLS, highlighting morphologically different features of TLS and GC-L. For (A)–(I), all images shown are at 200× magnification (scale bar, unit measure of 50 μm). (A–C) TLS in OMAS-associated neuroblastoma. (A–B′) GC-L structures in OMAS-associated neuroblastoma characterized by a core of larger lymphocytes resembling centrocytes in GCs of lymph nodes. (C) TLSs in OMAS-associated neuroblastoma are easily distinguishable from tumor cell nests (tumor). Note the overall marked density of small lymphocytes throughout the tissue in (A)–(B′), and in the lower-magnification image in (C) highlighting the extensive lymphocytic infiltrate both in the context of lymphoid structures and throughout the tumoral stroma. (D) GC-L TLS, and (D′) TLS in an LR neuroblastoma. (E and E′) TLS in another LR neuroblastoma mass, with uniformly small lymphocytes clustered within the tumor tissue. (F) Lower-magnification image of section in (D) and (D′) highlighting the context of significant lymphocytic infiltration (both as TLSs and diffuse) but less dense than in OMAS-associated neuroblastomas (compare to C). (G) GC-L TLS in HR neuroblastoma sample, characterized by a core of lymphocytes resembling centrocytes in GCs of lymph nodes, surrounded by tightly packed small lymphocytes with scarce cytoplasm and hyperchromatic (strongly hematoxylin-positive) nuclei. (G′) A TLS from the same tumor, characterized only by tightly packed small lymphocytes with scarce cytoplasm and hyperchromatic nuclei. (H and H′) Two TLSs from a different HR neuroblastoma mass at high magnification. (I) TLS from the HR neuroblastoma in (H) and (H′) at lower magnification, highlighting tumor tissue with only scattered infiltrating lymphocytes outside the TLS. (J–J″) Representative TLS in OMAS-associated neuroblastoma, containing (J) B cells (anti-CD20+; red), (J′) T cells (anti-CD3+; green). (J″) Merge of green and red channels. Images are taken at 20× magnification; scale bar, 32.2 μm.

References

    1. Ehrlich P (1908). Ueber den jetzigen Stand der Karzinomforschung.
    1. Swann JB, and Smyth MJ (2007). Immune surveillance of tumors. J. Clin. Invest. 117, 1137–1146. 10.1172/JCI31405. - DOI - PMC - PubMed
    1. McGovern VJ (1975). Spontaneous regression of melanoma. Pathology 7, 91–99. 10.3109/00313027509092702. - DOI - PubMed
    1. Dalmau J, Armangué T, Planagumà J, Radosevic M, Mannara F, Leypoldt F, Geis C, Lancaster E, Titulaer MJ, Rosenfeld MR, and Graus F (2019). An update on anti-NMDA receptor encephalitis for neurologists and psychiatrists: mechanisms and models. Lancet Neurol. 18, 1045–1057. 10.1016/S1474-4422(19)30244-3. - DOI - PubMed
    1. Shen K, Xu Y, Guan H, Zhong W, Chen M, Zhao J, Li L, and Wang M (2018). Paraneoplastic limbic encephalitis associated with lung cancer. Sci. Rep. 8, 6792. 10.1038/s41598-018-25294-y. - DOI - PMC - PubMed

Publication types