. 2023 Mar;40(2):101-115.
doi: 10.1109/msp.2022.3203867. Epub 2023 Feb 27.

High-Dimensional MR Spatiospectral Imaging by Integrating Physics-Based Modeling and Data-Driven Machine Learning: Current progress and future directions

Affiliations

High-Dimensional MR Spatiospectral Imaging by Integrating Physics-Based Modeling and Data-Driven Machine Learning: Current progress and future directions

Fan Lam et al. IEEE Signal Process Mag. 2023 Mar.

Abstract

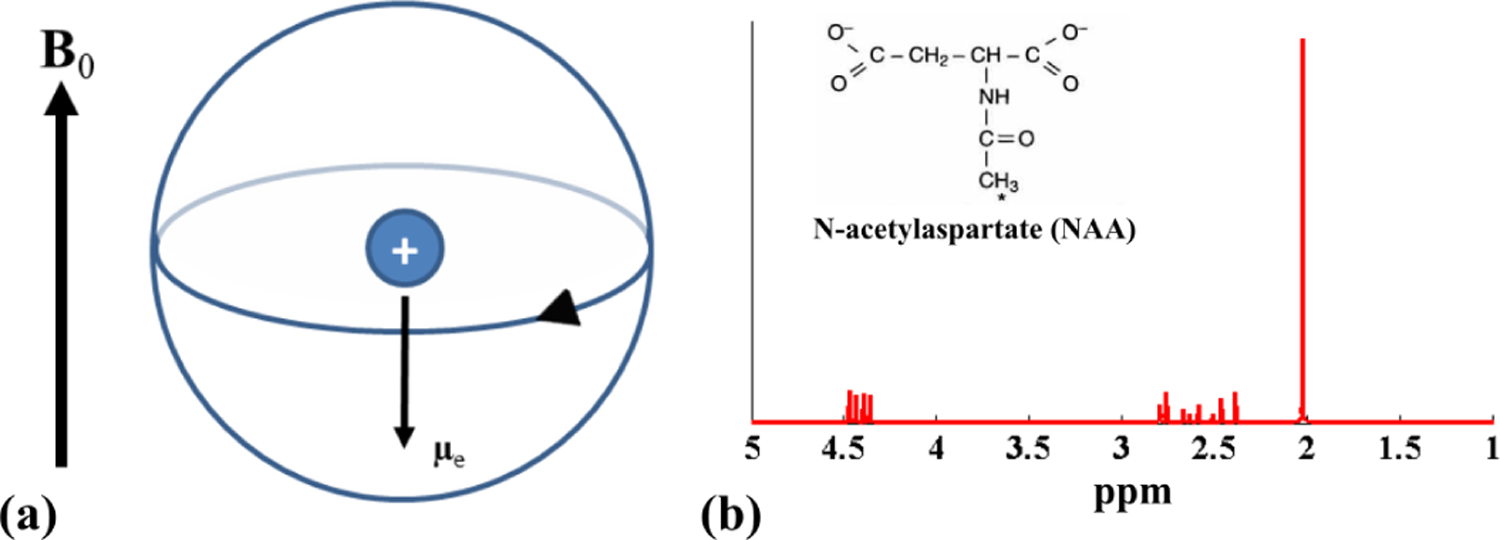
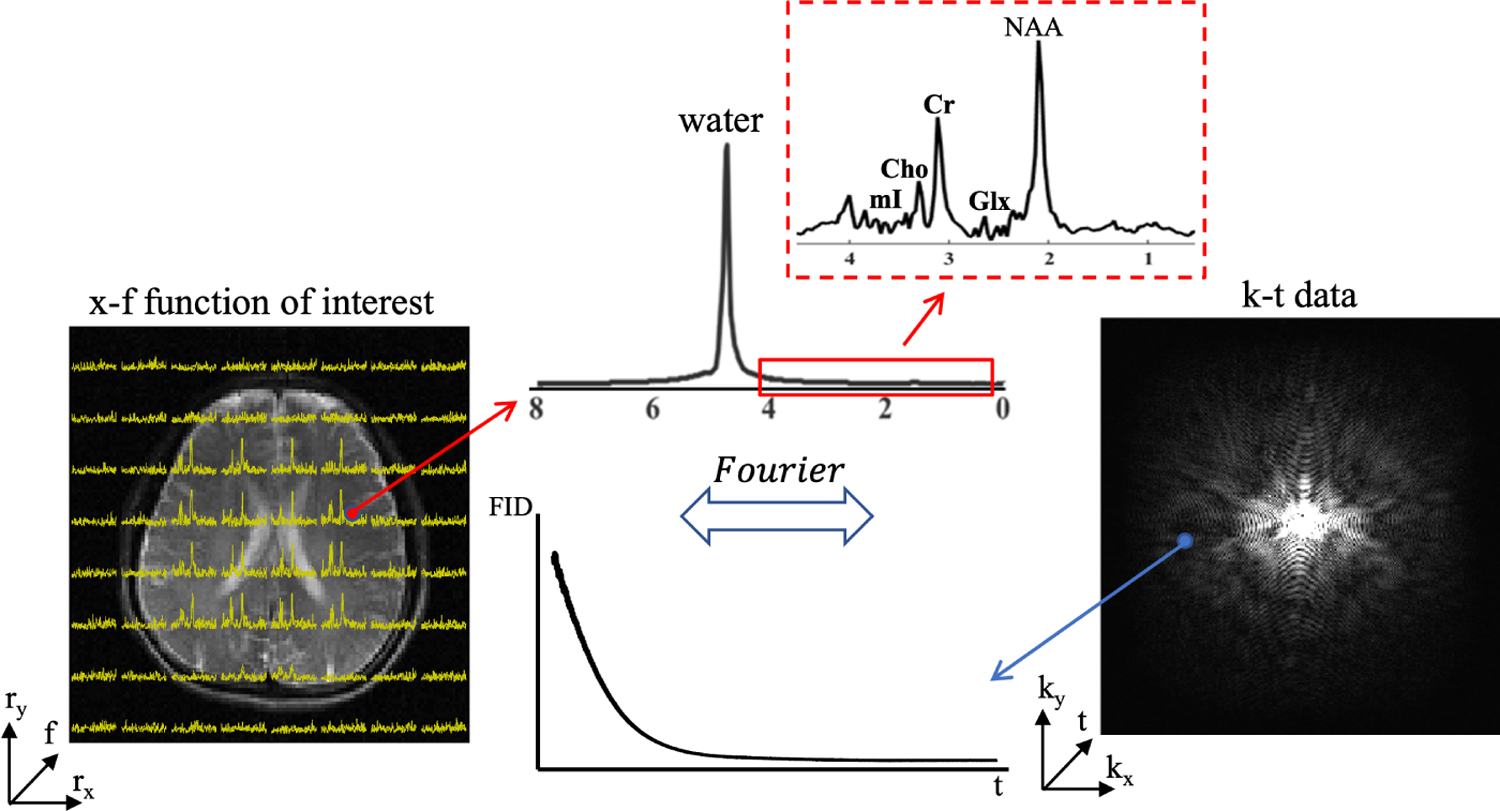
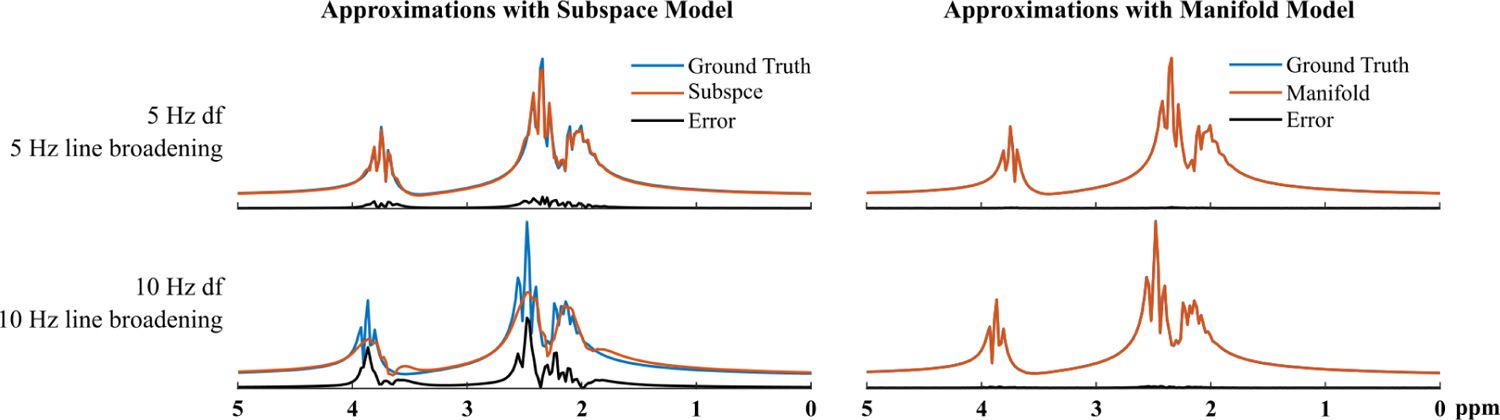
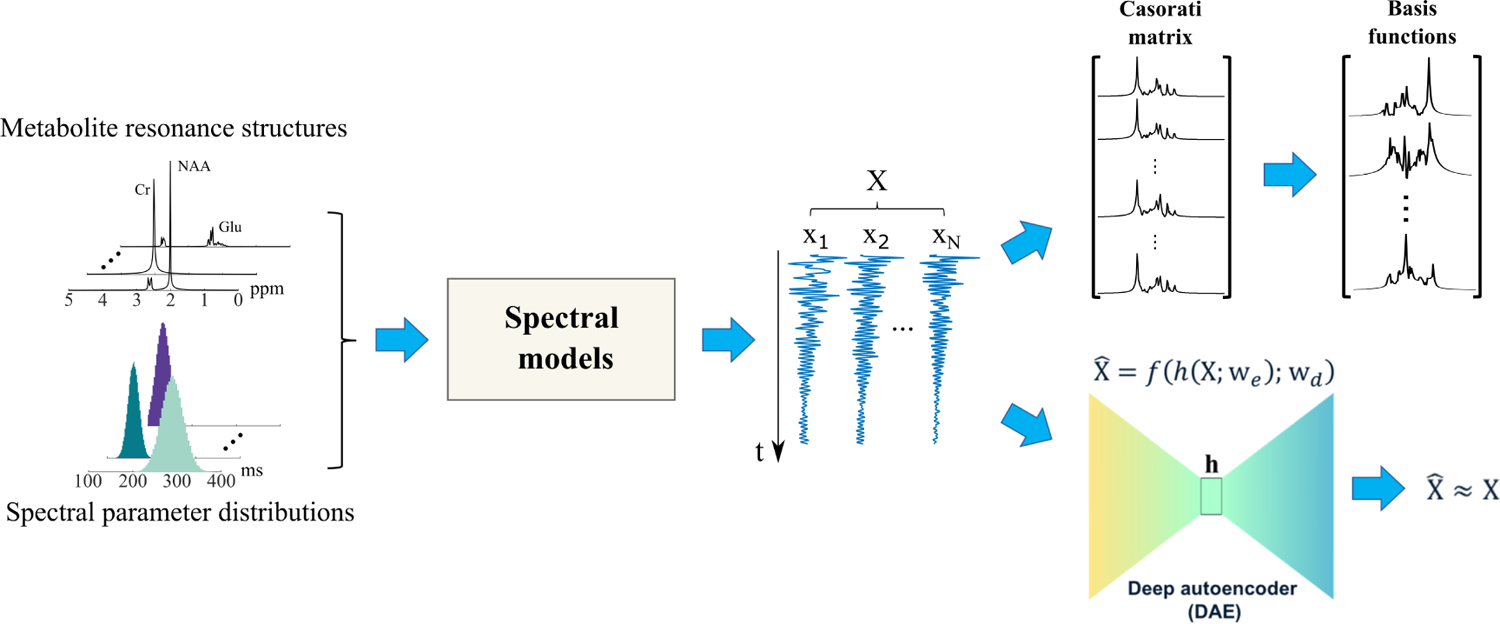
Magnetic resonance spectroscopic imaging (MRSI) offers a unique molecular window into the physiological and pathological processes in the human body. However, the applications of MRSI have been limited by a number of long-standing technical challenges due to high dimensionality and low signal-to-noise ratio (SNR). Recent technological developments integrating physics-based modeling and data-driven machine learning that exploit unique physical and mathematical properties of MRSI signals have demonstrated impressive performance in addressing these challenges for rapid, high-resolution, quantitative MRSI. This paper provides a systematic review of these progresses in the context of MRSI physics and offers perspectives on promising future directions.


Figures

Fig. 1.
Fig. 1.
Illustration of chemical shift and the resulting frequency distribution: (a) the electron orbiting around the nucleus (denoted by the arrow on the circle) can be viewed as a small current, which generates a magnetic moment μe that opposes the main magnetic field B0, thus perturbing the magnetic field felt “locally” by the nucleus and generating a small frequency shift; (b) resonance structure of the molecule NAA (from quantum mechanical simulation) as a result of the chemical shift phenomenon.
Fig. 2.
Fig. 2.
Illustration of the imaging problem with MRSI: The desired high-dimensional spatiospectral function is in (x,f) domain where we aim to recover high-resolution spectra at each voxel (left). Data are acquired in (k,t)-space where FIDs are sampled for individual k-space locations (right). This imaging problem is inherently higher dimensional than conventional MRI where only k-space is sampled. Furthermore, the signals from molecules of interest (e.g., NAA, Cr, and Cho etc) are three orders of magnitude weaker than water (plots on top of the middle column), making the problem more challenging.
Fig. 3.
Fig. 3.
Linear v.s. nonlinear low-dimensional models of spectroscopic signals: (Left) Approximation of glutamate spectra using subspaces learned from an ensemble of simulated data. The accuracy reduces as the ranges for the spectral parameters used to generate the training and testing data increase (from top to bottom rows); (Right) Approximation by the nonlinear model learned from the same data, with the same model order of 3. The color coding is specified in the figure legend.
Fig. 4.
Fig. 4.
Physical-model-driven data generation and low-dimensional representation learning for MRSI data. Both QM-simulated resonance structures of individual molecules (metabolite basis, top of left column) and spectral parameters sampled from empirical distributions (from literature values or experimental data, bottom of left column) are fed into a spectral fitting model to generate a large quantity of training data (X). These data can be either formed into a Casorati matrix from which a set of basis can be estimated (upper branch, linear subspace model) or used to train a DAE to capture a nonlinear low-dimensional manifold where high-dimensional spectroscopic signals reside.
Fig. 5.
Fig. 5.
Reconstructions (simulated data) with and without using a pre-learned subspace. The first column shows metabolite maps (Cr) from different cases (rows 1–4: gold standard, Fourier reconstruction, low-rank filtering and reconstruction using a learned subspace), and the subsequent columns show localized spectra from two voxels. Direct low-rank filtering (jointly estimating the spatial coefficients and subspace) produced significantly larger errors (black curves) than learned subspace, especially in small features with a distinct spectral pattern (green dot). Relative 2 errors were included (err) for quantitative comparison.
Fig. 6.
Fig. 6.
A set of in vivo results from reconstructions using learned subspace (Linear subspace) and nonlinear models (Nonlinear manifold). The latter produced metabolite maps with less noise contamination and better recovered tissue-dependent features (as indicated by the red arrows), as well as spectra with sharper lineshapes (third column, blue arrows). A more thorough quantitative analysis without a gold standard can be found in [29].
Fig. 7.
Fig. 7.
The dynamic MRSI problem (dynamic 2H-MRSI of a rat brain in this case): The center cube illustrates the high-dimensional image function of interest. Orange lines taken from different frequencies (f) and a single time point (T) yield various metabolite maps (top left, spatial dimension); the blue plane represents time-resolved spectra (top right, spectral-temporal dimensions) at a single voxel (r); lines from different f ‘s and a single r capture metabolic dynamics (bottom right). The low-rank-tensor-based reconstruction with learned manifold constraints produced an impressive combination of speed, resolution and SNR [48], i.e., 1.8min frame rate at a resolution of 17 × 17 × 5 matrix size over 28 × 28 × 24mm3 FOV.
Fig. 8.
Fig. 8.
A set of dynamic 2H-MRSI results from a rat brain by the standard Fourier reconstruction (Fourier), a direct low-rank tensor filtering of the noisy data (Tensor), a tensor reconstruction with learned subspaces (Subspace), and joint subspace model and manifold regularization (Subspace+Manifold) [48]. For each method, maps of three metabolites (columns 1–3), localized spectra at a particular time point (4th column) and temporal dynamics for the same voxel (5th column) are shown. The learned subspace methods produced improved metabolite maps, and lower errors for the spectra and temporal dynamics. Manifold regularization further improved the temporal fidelity. Both the Tensor and Subspace methods used the same model order (Lm=6 and Sm=30). Colors for different curves are noted in the plot.

Similar articles

Cited by

References

    1. Lauterbur PC, Kramer DM, House WV, and Chen C-N, “Zeugmatographic high resolution nuclear magnetic resonance spectroscopy: Images of chemical inhomogeneity within macroscopic objects,” J. Amer. Chem. Soc, vol. 97, pp. 6866–6868, 1975.
    1. Brown TR, Kincaid BM, and Ugurbil K, “NMR chemical shift imaging in three dimensions,” Proc. Natl. Acad. Sci, vol. 79, pp. 3523–3526, 1982. - PMC - PubMed
    1. Ross B and Michaelis T, “Clinical applications of magnetic resonance spectroscopy.” Magn. Reson. Q, vol. 10, no. 4, pp. 191–247, 1994. - PubMed
    1. de Graaf RA, In Vivo NMR Spectroscopy: Principles and Techniques. Hoboken, NJ: John Wiley & Sons, 2018.
    1. Li Y, Wang T, Zhang T, Lin Z, Li Y, Guo R, Zhao Y, Meng Z, Liu J, Yu X, Liang Z-P, and Nachev P, “Fast high-resolution metabolic imaging of acute stroke with 3D magnetic resonance spectroscopy,” Brain, vol. 143, pp. 3225–3233, 2020. - PMC - PubMed

LinkOut - more resources