

Validation of Body-Worn Sensors for Gait Analysis During a 2-min Walk Test in Children
- PMID: 37538346
- PMCID: PMC10398795
- DOI: 10.1123/jmpb.2021-0035
Validation of Body-Worn Sensors for Gait Analysis During a 2-min Walk Test in Children
Abstract
Introduction: Instrumented gait mat systems have been regarded as one of the gold standard methods for measuring spatiotemporal gait parameters. However, their portable walkways confine walking to a restricted area and limit the number of gait cycles collected. Wearable inertial sensors are a potential alternative that allow more natural walking behavior and have fewer space restrictions. The objective of this pilot study was to establish the concurrent validity of body-worn sensors against the portable walkway system in older children.
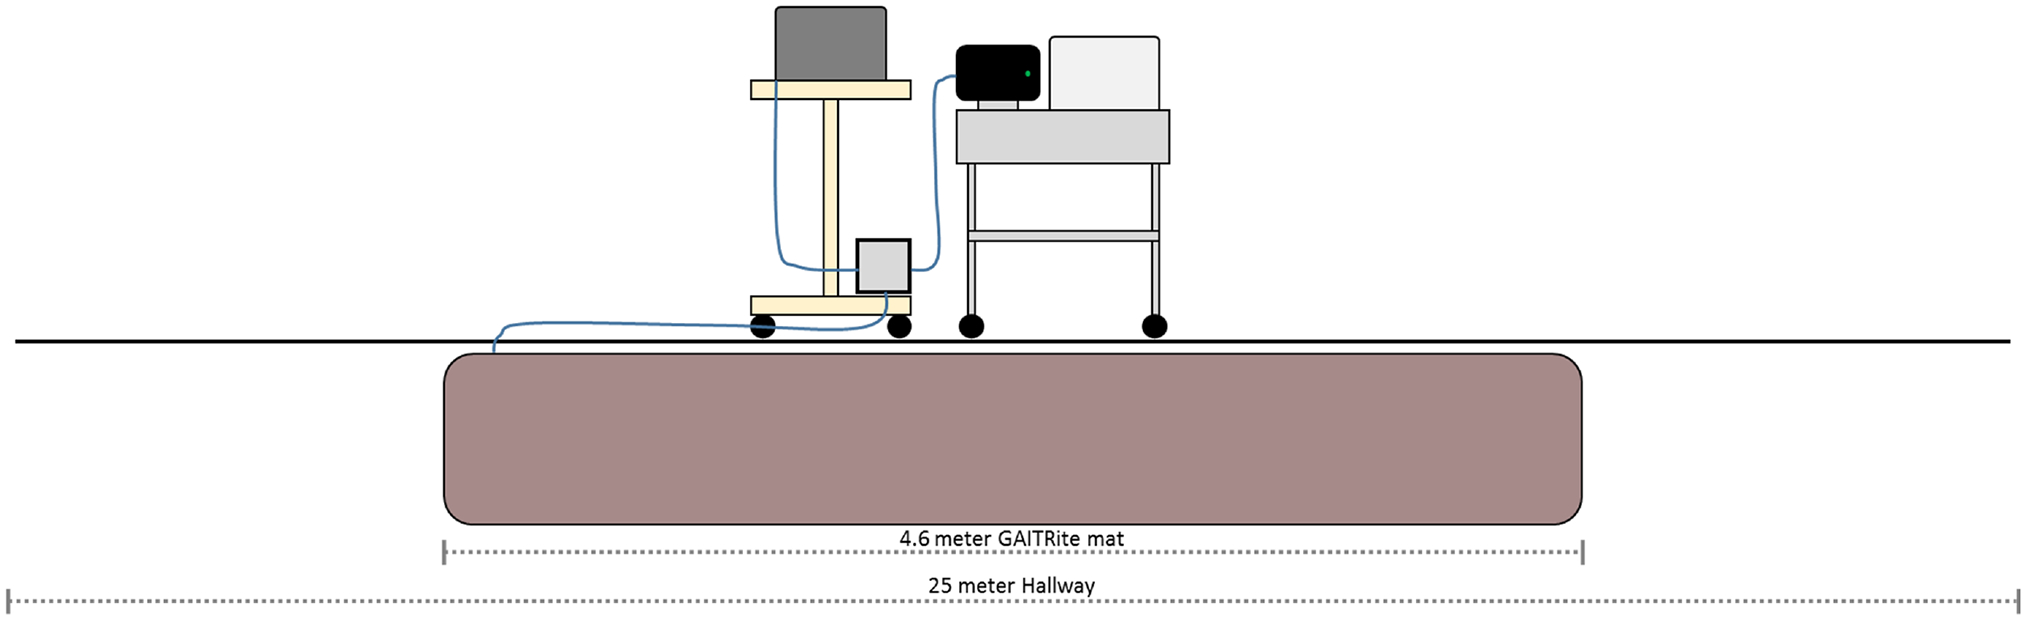
Methods: Twenty-one participants (10 males) 7-17 years old performed 2-min walk tests at a self-selected and fast pace in a 25-m-long hallway, while wearing three inertial sensors. Data collection were synchronized between devices and the portions of the walk when subjects passed on the walkway were used to compare gait speed, stride length, gait cycle duration, cadence, and double support time. Regression models and Bland-Altman analysis were completed to determine agreement between systems for the selected gait parameters.
Results: Gait speed, cadence, gait cycle duration, and stride length as measured by inertial sensors demonstrated strong agreement overall. Double support time was found to have lower validity due to a combined bias of age, height, weight, and walking pace.
Conclusion: These results support the validity of wearable inertial sensors in measuring gait speed, cadence, gait cycle duration, and stride length in children 7 years old and above during a 2-min walking test. Future studies are warranted with a broader age range to thoroughly represent the pediatric population.
Keywords: accelerometer; pediatrics; wearable technology.
Figures


Similar articles
-
Validation of shoe-worn Gait Up Physilog®5 wearable inertial sensors in adolescents.Gait Posture. 2022 Jan;91:19-25. doi: 10.1016/j.gaitpost.2021.09.203. Epub 2021 Oct 5. Gait Posture. 2022. PMID: 34628218
-
Concurrent Validity of the Zeno Walkway for Measuring Spatiotemporal Gait Parameters in Older Adults.J Geriatr Phys Ther. 2019 Jul/Sep;42(3):E42-E50. doi: 10.1519/JPT.0000000000000168. J Geriatr Phys Ther. 2019. PMID: 29286982
-
Concurrent Validity of a Commercial Wireless Trunk Triaxial Accelerometer System for Gait Analysis.J Sport Rehabil. 2019 Aug 1;28(6):jsr.2018-0295. doi: 10.1123/jsr.2018-0295. J Sport Rehabil. 2019. PMID: 30747572
-
Comparability between wearable inertial sensors and an electronic walkway for spatiotemporal and relative phase data in young children aged 6-11 years.Gait Posture. 2024 Jun;111:30-36. doi: 10.1016/j.gaitpost.2024.04.003. Epub 2024 Apr 13. Gait Posture. 2024. PMID: 38615566
-
Validity of Wearable Inertial Sensors for Gait Analysis: A Systematic Review.Diagnostics (Basel). 2024 Dec 27;15(1):36. doi: 10.3390/diagnostics15010036. Diagnostics (Basel). 2024. PMID: 39795564 Free PMC article. Review.
References
-
- Berry-Kravis E, Chin J, Hoffman A, Winston A, Stoner R, LaGorio L, Friedmann K, Hernandez M, Ory DS, Porter FD, & O”Keefe JA (2018). Long-term treatment of Nieman-Pick type c1 disease with intratehcal 2-hydroxypropy-beat-cyclodextrin. Pediatric Neurology, 80, 24–30. 10.1016/j.pediatrneurol.2017.12.014 - DOI - PMC - PubMed
-
- Bertoli M, Cereatti A, Trojaniello D, Avanzino L, Pelosin E, Del Din S, Rochester L, Ginis P, Bekkers E, Mirelman A, Hausdorff JM, & Della Croce U (2018). Estimation of spatio-temporal parameters of gait from magneto-inertial measurement units: Multicenter validation among Parkinson, mildly cognitively impaired and healthy older adults. Biomedical Engineering Online, 17(1), 58. 10.1186/s12938-018-0488-2 - DOI - PMC - PubMed
Grants and funding
LinkOut - more resources
Full Text Sources