

Identification of markers for predicting prognosis and endocrine metabolism in nasopharyngeal carcinoma by miRNA-mRNA network mining and machine learning
- PMID: 37538797
- PMCID: PMC10396331
- DOI: 10.3389/fendo.2023.1174911
Identification of markers for predicting prognosis and endocrine metabolism in nasopharyngeal carcinoma by miRNA-mRNA network mining and machine learning
Abstract
Background: Nasopharyngeal cancer (NPC) has a high incidence in Southern China and Asia, and its survival is extremely poor in advanced patients. MiRNAs play critical roles in regulating gene expression and serve as therapeutic targets in cancer. This study sought to disclose key miRNAs and target genes responsible for NPC prognosis and endocrine metabolism.
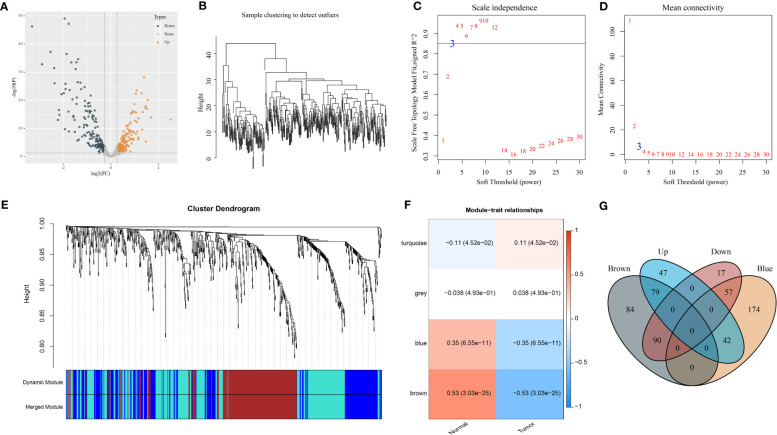
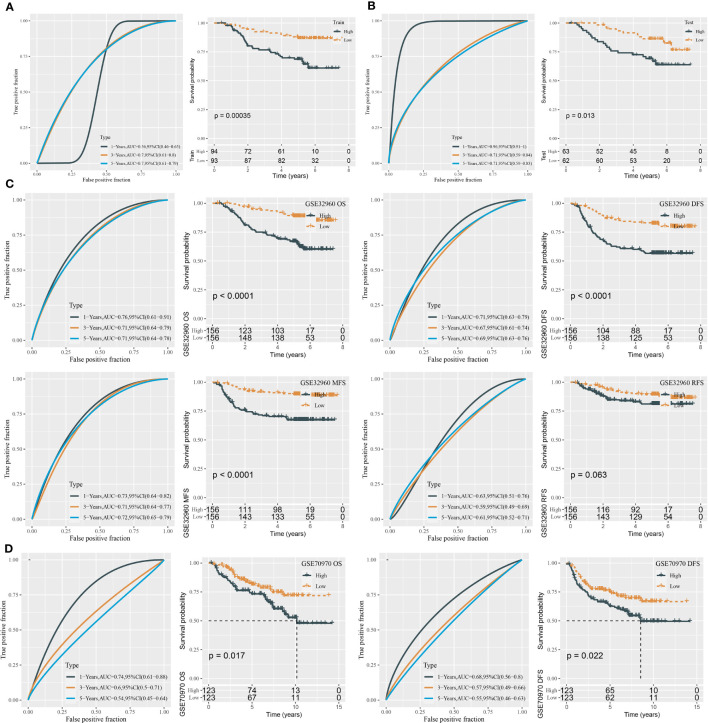
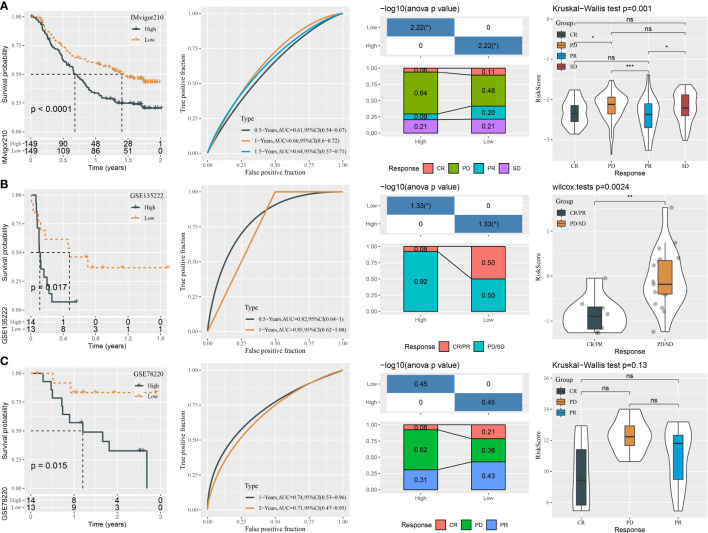
Materials and methods: Three datasets (GSE32960, GSE70970, and GSE102349) of NPC samples came from Gene Expression Omnibus (GEO). Limma and WGCNA were applied to identify key prognostic miRNAs. There were 12 types of miRNA tools implemented to study potential target genes (mRNAs) of miRNAs. Univariate Cox regression and stepAIC were introduced to construct risk models. Pearson analysis was conducted to analyze the correlation between endocrine metabolism and RiskScore. Single-sample gene set enrichment analysis (ssGSEA), MCP-counter, and ESTIMATE were performed for immune analysis. The response to immunotherapy was predicted by TIDE and SubMap analyses.
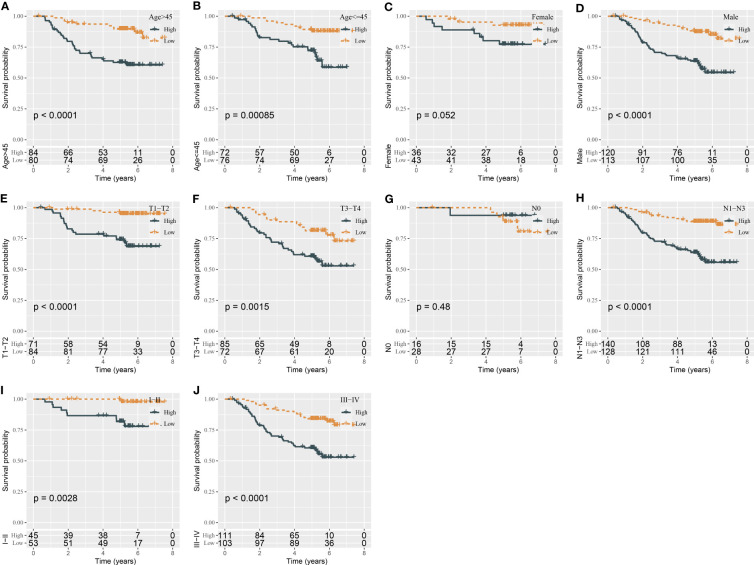
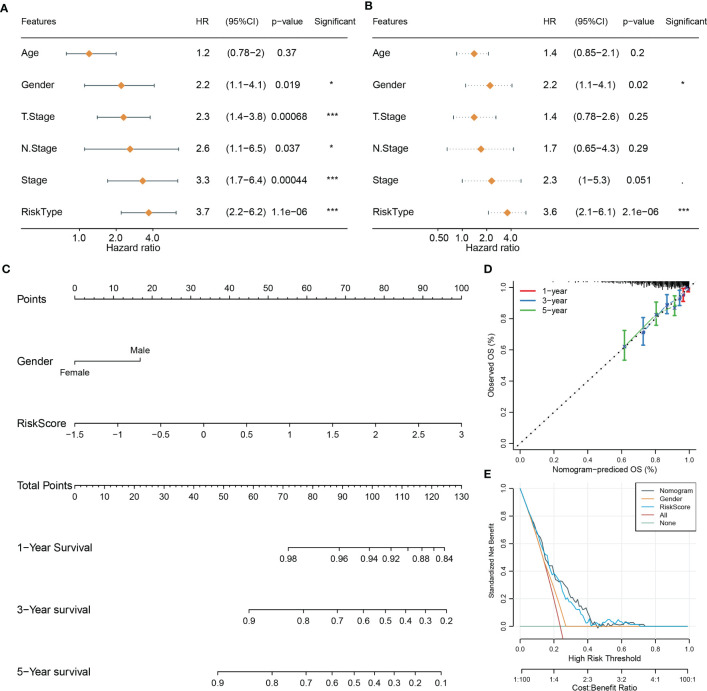
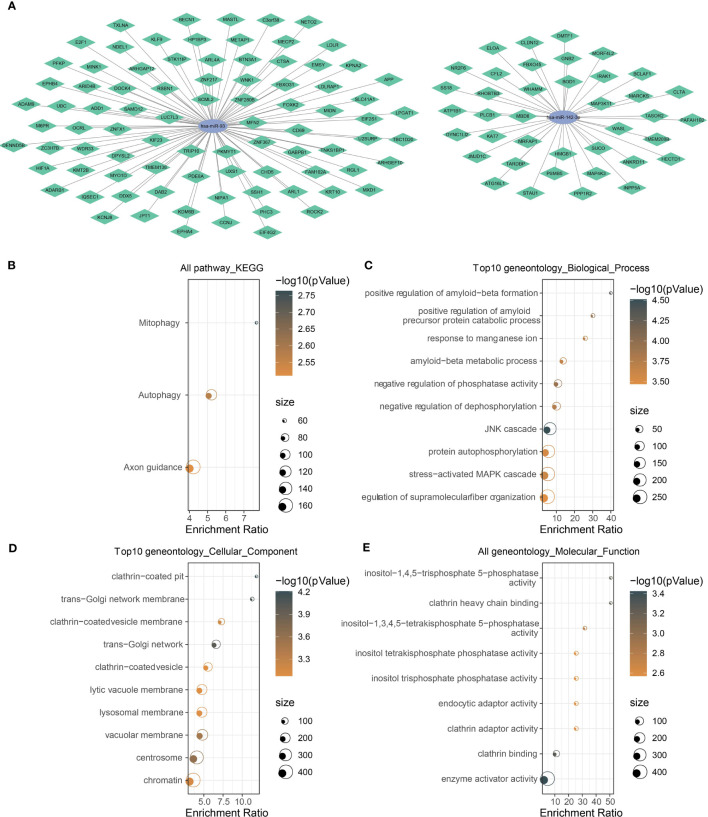
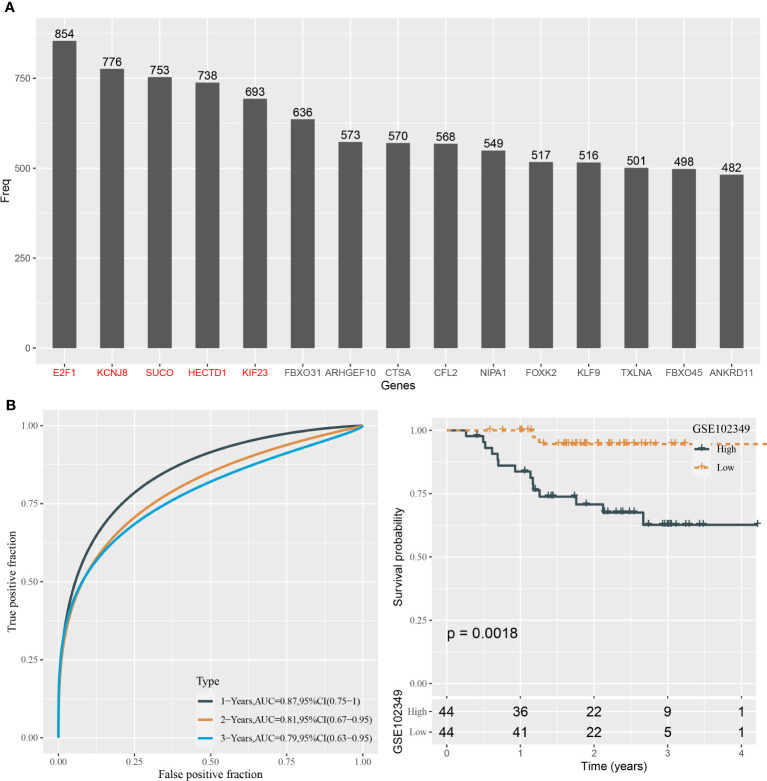
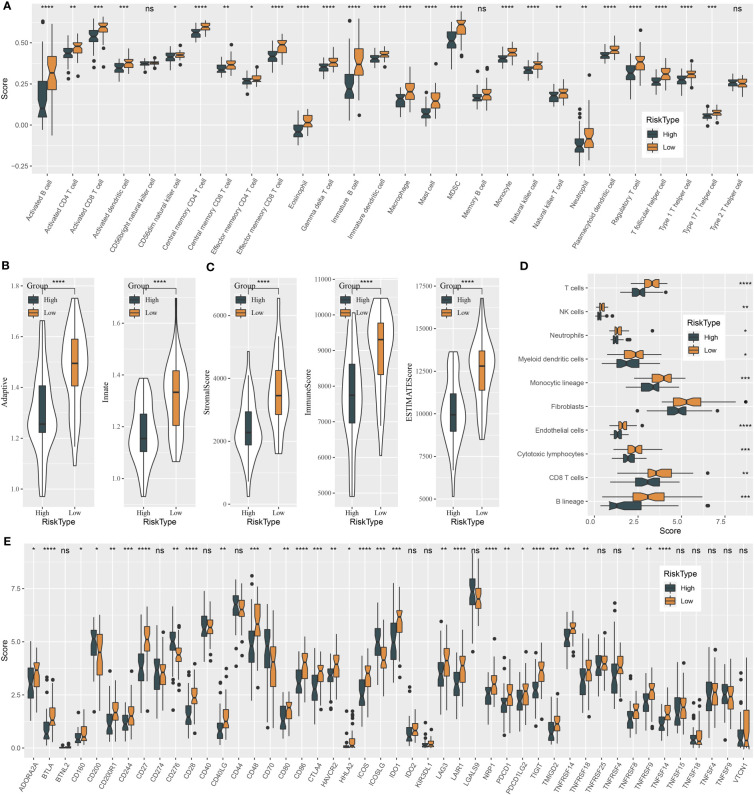
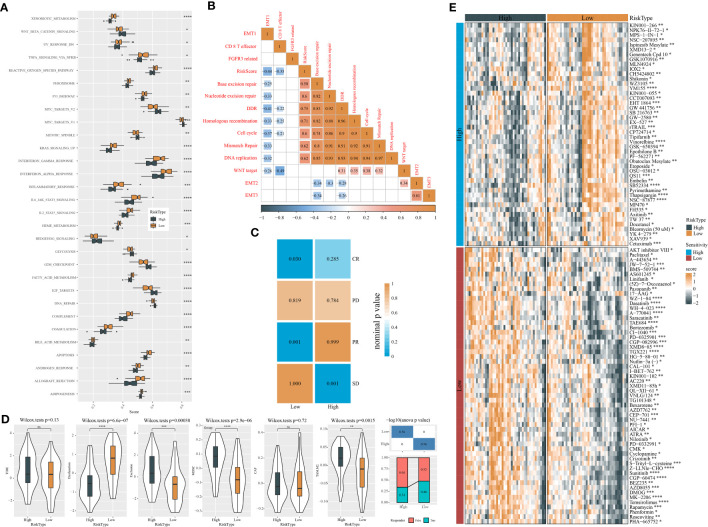
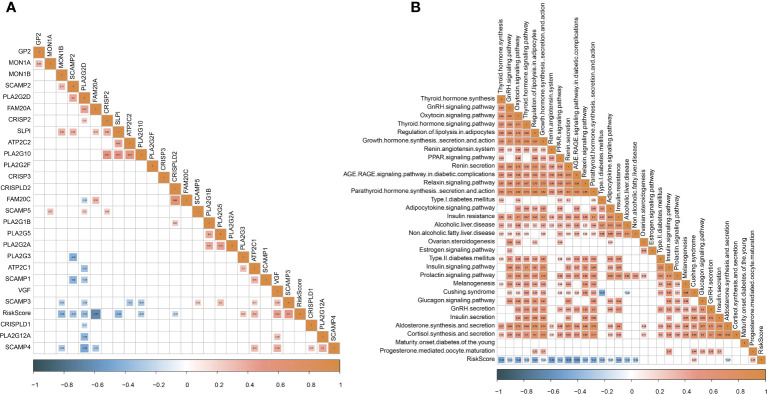
Results: Two key miRNAs (miR-142-3p and miR-93) were closely involved in NPC prognosis. The expression of the two miRNAs was dysregulated in NPC cell lines. A total of 125 potential target genes of the key miRNAs were screened, and they were enriched in autophagy and mitophagy pathways. Five target genes (E2F1, KCNJ8, SUCO, HECTD1, and KIF23) were identified to construct a prognostic model, which was used to divide patients into high group and low group. RiskScore was negatively correlated with most endocrine-related genes and pathways. The low-risk group manifested higher immune infiltration, anticancer response, more activated immune-related pathways, and higher response to immunotherapy than the high-risk group.
Conclusions: This study revealed two key miRNAs that were highly contributable to NPC prognosis. We delineated the specific links between key miRNAs and prognostic mRNAs with miRNA-mRNA networks. The effectiveness of the five-gene model in predicting NPC prognosis as well as endocrine metabolism provided a guidance for personalized immunotherapy in NPC patients.
Keywords: endocrine; immune checkpoint blockade; immunotherapy; miRNA-mRNA network; micro RNAs; nasopharyngeal cancer; risk model.
Copyright © 2023 Zhang, Li, Wang, Wang, Zhuang, Liu and Lian.
Conflict of interest statement
The authors declare that the research was conducted in the absence of any commercial or financial relationships that could be construed as a potential conflict of interest.
Figures
Similar articles
-
Identification of miRNA/mRNA-Negative Regulation Pairs in Nasopharyngeal Carcinoma.Med Sci Monit. 2016 Jun 28;22:2215-34. doi: 10.12659/msm.896047. Med Sci Monit. 2016. PMID: 27350400 Free PMC article.
-
An in silico analysis of dynamic changes in microRNA expression profiles in stepwise development of nasopharyngeal carcinoma.BMC Med Genomics. 2012 Jan 19;5:3. doi: 10.1186/1755-8794-5-3. BMC Med Genomics. 2012. PMID: 22260379 Free PMC article.
-
Construction and Analysis of lncRNA-Mediated ceRNA Network in Nasopharyngeal Carcinoma Based on Weighted Correlation Network Analysis.Biomed Res Int. 2020 Oct 10;2020:1468980. doi: 10.1155/2020/1468980. eCollection 2020. Biomed Res Int. 2020. PMID: 33102573 Free PMC article.
-
MicroRNAs serving as potential biomarkers and therapeutic targets in nasopharyngeal carcinoma: A critical review.Crit Rev Oncol Hematol. 2016 Jul;103:1-9. doi: 10.1016/j.critrevonc.2016.04.006. Epub 2016 May 11. Crit Rev Oncol Hematol. 2016. PMID: 27179594 Review.
-
MicroRNAs in nasopharyngeal carcinoma.Chin Clin Oncol. 2016 Apr;5(2):17. doi: 10.21037/cco.2016.03.09. Chin Clin Oncol. 2016. PMID: 27121877 Review.
Cited by
-
Exploring the influence of age on the causes of death in advanced nasopharyngeal carcinoma patients undergoing chemoradiotherapy using machine learning methods.Sci Rep. 2025 Jan 13;15(1):1777. doi: 10.1038/s41598-025-86178-6. Sci Rep. 2025. PMID: 39800797 Free PMC article.
-
MicroRNA-218-5p accelerates malignant behaviors of breast cancer through LRIG1.Clinics (Sao Paulo). 2023 Oct 28;78:100302. doi: 10.1016/j.clinsp.2023.100302. eCollection 2024. Clinics (Sao Paulo). 2023. PMID: 39491279 Free PMC article.
-
ADAR1-regulated miR-142-3p/RIG-I axis suppresses antitumor immunity in nasopharyngeal carcinoma.Noncoding RNA Res. 2024 Aug 15;10:116-129. doi: 10.1016/j.ncrna.2024.08.003. eCollection 2025 Feb. Noncoding RNA Res. 2024. PMID: 39351449 Free PMC article.
-
Identification and validation of anoikis-related differentially expressed genes in nasopharyngeal carcinoma.Transl Cancer Res. 2025 Jul 30;14(7):4429-4446. doi: 10.21037/tcr-2025-1263. Epub 2025 Jul 27. Transl Cancer Res. 2025. PMID: 40792128 Free PMC article.
References
Publication types
MeSH terms
Substances
LinkOut - more resources
Full Text Sources
Miscellaneous