. 2023 Apr-Jun;15(2):59-69.
doi: 10.32607/actanaturae.17857.

EGFR Suppression Inhibits the Sphere Formation of MCF7 Cells Overexpressing EGFR

Affiliations

EGFR Suppression Inhibits the Sphere Formation of MCF7 Cells Overexpressing EGFR

D D Novak et al. Acta Naturae. 2023 Apr-Jun.

Abstract

The epidermal growth factor receptor (EGFR) is an oncogenic tyrosine kinase that is involved in tumor initiation and progression, making EGFR inhibitors and monoclonal antibodies to this receptor essential for anti-tumor therapy. We have previously shown that EGFR transgene expression in the human breast adenocarcinoma cell line MCF7 (MCF7-EGFR) stimulates the 3D spheroid-like growth. The primary focus of our present work was to investigate whether EGFR inhibition could affect the assembly of spheroids or lead to the destruction of pre-existing spheroids. We compared the effects of anti-EGFR siRNA, the anti-EGFR monoclonal antibody cetuximab, and the tyrosine kinase inhibitor AG1478 on dissociated and spheroid MCF7-EGFR cells. MCF7-EGFR cells were found to have a 2.5-fold higher sensitivity towards the cytotoxic effects of cetuximab and AG1478 compared with the parental MCF7 cell line. The suppression of EGFR mRNA with siRNA was found to reduce the sphere formation, whereas treating the pre-existing spheroids had no such effect. Treatment of dissociated spheroids with cetuximab and AG1478 was also found to inhibit the MCF7-EGFR sphere formation. We suggest that EGFR expression is important, at least, during the spheroid formation stage. The transition of a MCF7wt adherent cell culture to MCF7-EGFR spheroids was accompanied by a considerable increase in N-cadherin adhesion proteins. The level of N-cadherin decreased when MCF7-EGFR cells were treated with siRNA and cetuximab. Thus, we have demonstrated that N-cadherin is involved in the EGFR-dependent formation of MCF7-EGFR spheroids. Accordingly, MCF7-EGFR spheroids can be considered a suitable model for studying aggressive hormone-positive breast tumors.

Keywords: 3D cell culture; AG1478; EGFR; MCF7; cetuximab; siRNA; spheroids.


Figures

Fig. 1
Fig. 1
Effect of anti-EGFR siRNA on the formation of MCF7-EGFR spheroids. (A) the photographs of the control and siRNA-treated MCF7-EGFR spheroids. (B) the growth dynamics of MCF7-EGFR spheroids. The dissociated spheroids were seeded into 48- well plates, treated with siRNA (100 nM), and counted in separate wells, with the number of spheroids reported per well. The control cells were treated with LF
Fig. 2
Fig. 2
Evaluation of EGFR reduction in MCF7-EGFR cells under the action of anti-EGFR siRNA. (A) the quantification of the EGFR+ cell population. The data are presented as the mean fluorescence intensity (MFI) of EGFR + cells relative to the control cells ± SD from two independent experiments. (B) the representative image of the cytometric analysis. (C, D) the changes in EGFR levels after anti-EGFR siRNA treatment. MDA-MB-231, MCF7wt were used as control cell lines. The MCF7-EGFR spheroids were dissociated and treated with Scramble siRNA, anti-EGFR siRNA (100–200 nM) for 48 h. (C) the representative images of the Western blot analysis. (D) the Western blot analysis of EGFR/actin in the cells
Fig. 3
Fig. 3
Analysis of the effect of anti-EGFR siRNA on the structure of MCF7-EGFR spheroids. The growth kinetics of MCF7-EGFR spheroids. The spheroids were seeded, treated with siRNA (100 nM), and counted in separate wells of 24-well plates with the number of spheroids per well. The control spheroids were treated with LF. The data are presented as the mean ± SD of three independent experiments
Fig. 4
Fig. 4
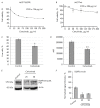
The cytotoxic activity of cetuximab against MCF7-EGFR spheroids (A) and wild-type MCF7 cells (B). The IC50 values were determined by the MTT assay. (C, D) – the estimation of the proportion of live MCF7-EGFR spheroid cells after cetuximab treatment by flow cytometry. The MCF7-EGFR cells were incubated with cetuximab (50 μg/ml) for 72 h and stained with FDA. (C) the mean % of live cells ± SD of two independent experiments. (D) MFI, the mean fluorescence intensity of live cells. The differences were significant at *p < 0.05, ** p < 0.01. (E, F) the changes in the EGFR levels after cetuximab treatment. MCF7-EGFR spheroids were dissociated and treated with cetuximab (25–0 μg/mL) for 48 h. (E) the representative images of the Western blot analysis. (G) the Western blot analysis of EGFR/actin in the cells
Fig. 5
Fig. 5
Analysis of the cetuximab effect on MCF7-EGFR spheroid formation. The spheroids were dissociated, seeded in a 48-well nonadhesive plate, treated with cetuximab (50 μg/ml), and counted in individual wells. The data are presented as the mean ± SD of three independent experiments; *p < 0.05
Fig. 6
Fig. 6
Analysis of the cetuximab effect on the structure of the MCF7-EGFR spheroids. (A) the photographs of the control and cetuximab-treated MCF7-EGFR spheroids. (B) the growth kinetics of the MCF7-EGFR spheroids cultured in a medium with and without cetuximab. The spheroids were seeded, treated with cetuximab (50 μg/ml), and counted in the individual wells of 48-well plates, and the number of spheroids per well was indicated. The data are presented as the mean value ± SD of three independent experiments; **p < 0.01. (C) The microscopic analysis of MCF7-EGFR spheroids treated with cetuximab for 72h and stained with FDA
Fig. 7
Fig. 7
The cytotoxic activity of the EGFR inhibitor AG1478 (AG) against wild-type MCF7 cells. (A) and MCF7-EGFR spheroids (B). MCF7wt cells or MCF7-EGFR spheroids were incubated with AG (10–40 μM) for 5 days. The control cells were incubated with DMSO. After the treatment, the spheroids were dissociated, stained with propidium iodide (PI), and analyzed by flow cytometry. Data presented as the mean % of PI-positive cells ± SD of two independent experiments. (C) Growth curves of the MCF7-EGFR spheroids. The distorted spheroids were seeded in 48-well plates, and after 24 h of incubation the cells were treated with AG (10 μM). The spheroids were counted in individual wells. The data are presented as the mean value ± SD of six independent experiments, with *p < 0.05, **p < 0.01, ***p < 0.001
Fig. 8
Fig. 8
The changes in cellular proteins after the anti-EGFR siRNA and cetuximab treatment. MDA-MB-231, MCF7wt were used as control cell lines. The MCF7-EGFR spheroids were dissociated and treated with Scramble siRNA, anti-EGFR siRNA (100–200 nM), or cetuximab (25–50 µg/ml) for 48 h. (A) the representative pictures of the Western blots analysis. (B) the Western blots analysis of SNAIL+SLUG/Actin in the cells
Fig. 9
Fig. 9
The changes in cellular proteins after anti-EGFR siRNA and cetuximab treatment. MDA-MB-231, MCF7wt were used as control cell lines. The MCF7-EGFR spheroids were dissociated with accutase and treated with Scramble siRNA (scr siRNA), anti-EGFR siRNA (50–200 nM), or cetuximab (25–50 μg/ml) for 48 h. (A) The representative pictures of the Western blots analysis. (B, C) the Western blots analysis of N-cadherin/Actin (B) and E-cadherin/Actin (C)

References

    1. Sporn M.B., Roberts A.B.. Nature. 1985;313(6005):745–747. - PubMed
    1. Normanno N.. Front. Biosci. 2001;6(1):d685. - PubMed
    1. Foley J., Nickerson N.K., Nam S., Allen K.T., Gilmore J.L., Nephew K.P., Riese D.J.. Semin. Cell Dev. Biol. 2010;21(9):951–960. - PMC - PubMed
    1. Hynes N.E., Lane H.A.. Nat. Rev. Cancer. 2005;5(5):341–354. - PubMed
    1. Chidharla A., Parsi M., Kasi A., StatPearls. Treasure Island (FL): StatPearls Publ. 2022

LinkOut - more resources