. 2023 Jul 11;26(8):107301.
doi: 10.1016/j.isci.2023.107301. eCollection 2023 Aug 18.

The indirect corticopontine pathway relays perioral sensory signals to the cerebellum via the mesodiencephalic junction

Affiliations

The indirect corticopontine pathway relays perioral sensory signals to the cerebellum via the mesodiencephalic junction

Reika Kubo et al. iScience. .

Abstract

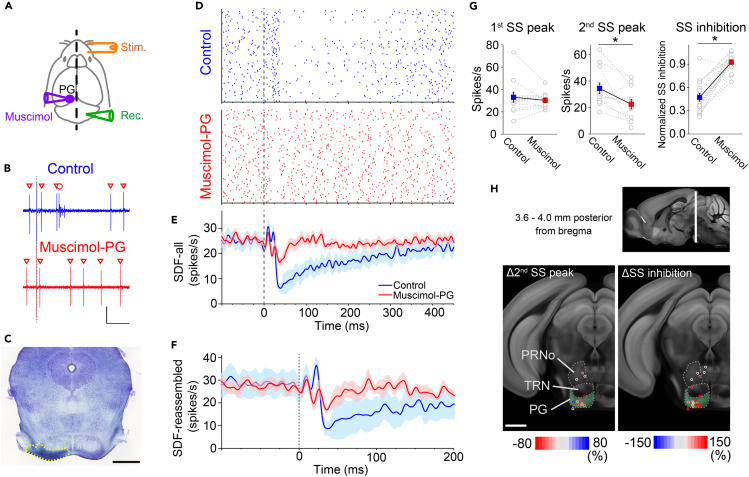
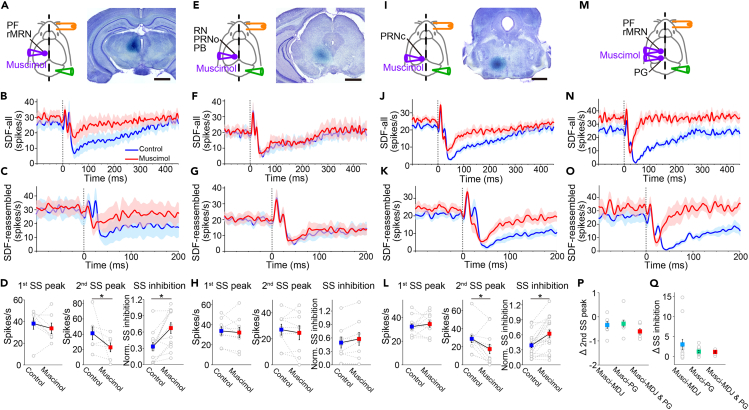
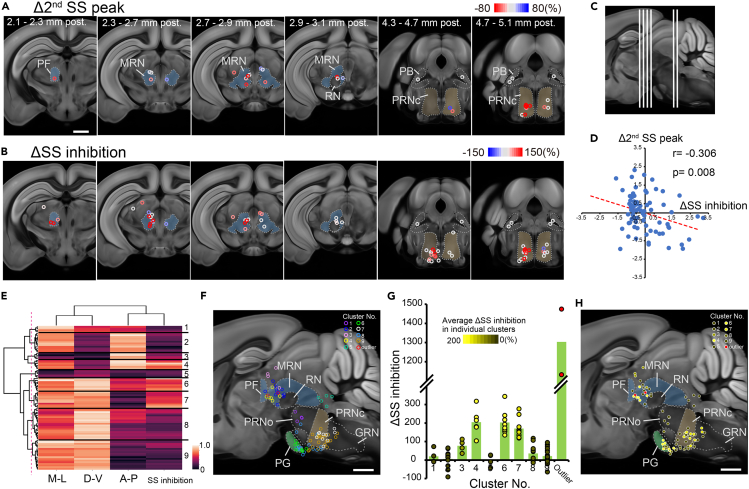
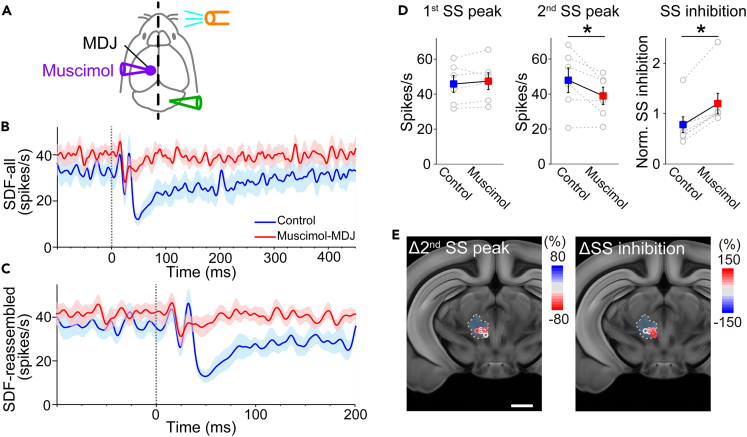
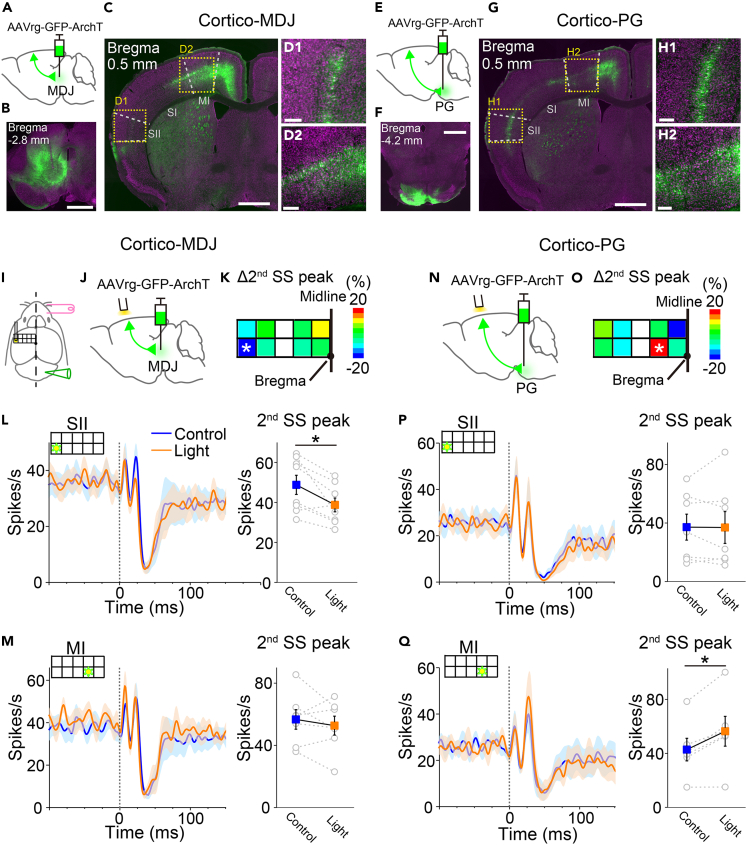
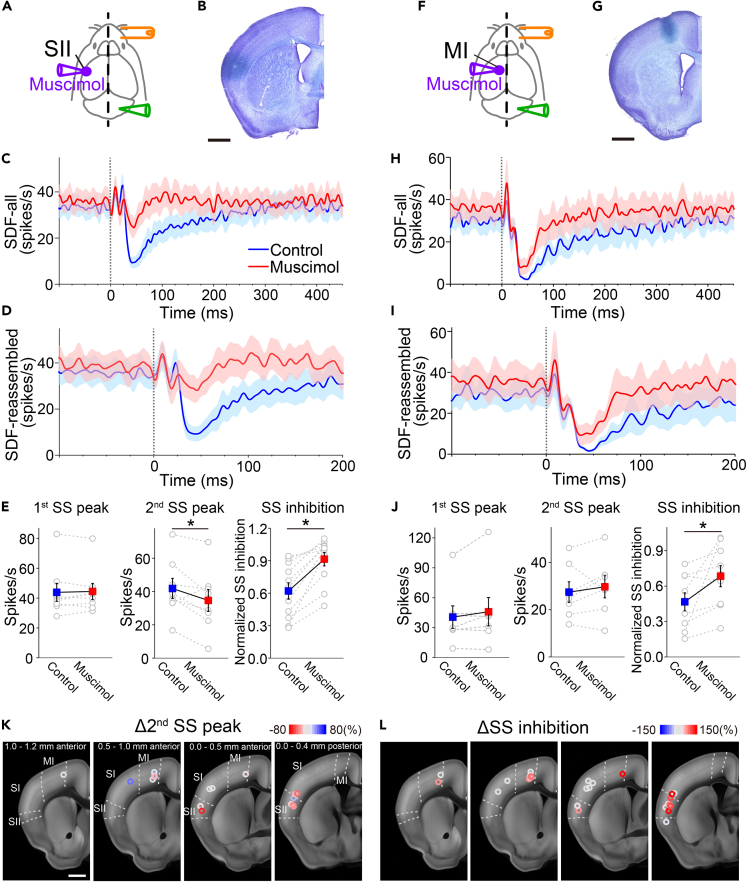
In the cerebro-cerebellar loop, outputs from the cerebral cortex are thought to be transmitted via monosynaptic corticopontine gray (PG) pathways and subsequently relayed to the cerebellum. However, it is unclear whether this pathway is used constitutively for cerebro-cerebellar transduction. We examined perioral sensory pathways by unit recording from Purkinje cells in ketamine/xylazine-anesthetized mice. Infraorbital nerve stimulations enhanced simple spikes (SSs) with short and long latencies (first and second peaks), followed by SS inhibition. The second peak and SS inhibition were suppressed by muscimol (a GABAA agonist) injections into not only the PG but also the mesodiencephalic junction (MDJ). The pathway from the secondary somatosensory area (SII) to the MDJ, but not the cortico-PG pathway, transmitted the second peak signals. SS inhibition was processed in the SII and primary motor area. Thus, the indirect cortico-PG pathway, via the MDJ, is recruited for perioral sensory transduction.

Keywords: Neuroscience; Sensory neuroscience.


Conflict of interest statement

The authors declare no competing interests.

Figures

None
Graphical abstract
Figure 1
Figure 1
Muscimol injections into the PG suppress the 2nd SS peak and SS inhibition generated by ION stimulation (A) Schemas of right ION stimulation (orange), recording from a PC in the right cerebellum (green) and the muscimol injection into the left PG (purple). (B) Representative traces of SSs in response to right ION stimulation before (blue) and after (red) muscimol injection into the left PG. SSs and the complex spike are indicated by red triangles and a red circle, respectively. The right ION is stimulated at the dotted line. (C) The muscimol injection site identified by co-injected Chicago Sky Blue into the left PG (yellow dotted line). (D) Representative raster plots of SSs from 100 trials of ION stimulation before (blue) and after (red) muscimol injection into the left PG. Dotted lines represent ION stimulus onsets. (E and F) Peri-stimulus spike density function (SDF) of SSs in response to ION stimulation before (blue) and after (red) muscimol injection into the left PG. Data are for all PCs (E; n = 12, from 12 mice) and reassembled data with clear 1st and 2nd SS peaks (see STAR Methods) (F; n = 9, from 9 mice). Lines and shaded areas indicate mean and SEM, respectively. (G) Changes in 1st SS peak (left), 2nd SS peak (middle) and normalized SS inhibition (right) caused by muscimol injection into the PG. The 1st and 2nd SS peaks are summarized from reassembled data with clear peaks (F), and normalized SS inhibition is summarized from all data (E). Averaged data for control (blue) and muscimol-injected (red) mice are presented as mean ± SEM. Muscimol injections into the PG significantly suppressed the 2nd SS peak and SS inhibition, but not the 1st SS peak (paired t-test or Wilcoxon signed-rank test, ∗p < 0.05). (H) Summary of centers of muscimol injection sites in the coronal plane. Injection sites were aligned to the Allen Mouse Common Coordinate Framework (CCFv3).,,, (upper) The position of lower panel images is indicated by the white line. (lower) Pseudocolor codes for Δ 2nd SS peaks (left) and ΔSS inhibition (right) were calculated as described in STAR Methods. It should be noted that the color code is inverted between the Δ 2nd SS peak and ΔSS inhibition. Scale bars: 1 mV, 50 ms (B) and 1 mm (C, H). See also Figures S1, S3–S6, and Table S1.
Figure 2
Figure 2
Muscimol injection into the MDJ or PRNc suppresses the 2nd SS peak and SS inhibition generated by ION stimulation (A, E, I) (Left) Schemas for ION stimulation (orange), PC recording (green) and muscimol injection (purple) into the left MDJ (A, PF and rostral MRN (rMRN)), RN, PRNo and parabrachial nucleus (PB) (E), or PRNc (I). (Right) Muscimol injection sites. (B, F, J) Peri-stimulus SDFs of SSs in response to right ION stimulation before (blue) and after (red) muscimol injection into the left MDJ (B), RN, PRNo and PB (F), or PRNc (J). Data for all recorded PCs are presented (MDJ (B; n = 13, from 13 mice), RN, PRNo and PB (F; n = 9, from 9 mice), and PRNc (J; n = 21, from 21 mice)). Lines and shaded areas indicate mean and SEM, respectively. (C, G, K) Similar to B, F, J, but data for PCs with clear 1st and 2nd SS peaks are presented (MDJ (C; n = 7, from 7 mice), RN, PRNo and PB (G; n = 9, from 9 mice), and PRNc (K; n = 12, from 12 mice)). (D, H, L) Changes in 1st SS peak (left), 2nd SS peak (middle) and normalized SS inhibition (right) by muscimol injections into the MDJ (D), RN, PRNo and PB (H), or PRNc (L). Paired t-test or Wilcoxon signed-rank test, ∗p < 0.05. Averaged data for control (blue) and muscimol-injected (red) mice are presented as mean ± SEM. (M) Schemas for ION stimulation (orange), PC recording (green) and muscimol injection (purple) into the left MDJ and PG. (N) Peri-stimulus SDFs of SSs in response to right ION stimulation before (blue) and after (red) muscimol injection into the left MDJ and PG. Data for all recorded PCs are presented (n = 9, from 9 mice). (O) Data for PCs with clear 1st and 2nd SS peaks are presented (n = 6, from 6 mice). (P and Q) Changes in Δ 2nd SS peak (P, MDJ; n = 7, PG; n = 9, MDJ & PG; n = 6, p = 0.2708, one-way ANOVA) and ΔSS inhibition (Q, MDJ; n = 13, PG; n = 18, MDJ & PG; n = 9, p = 0.1503) by muscimol injections. Scale bars: 1 mm (A, E, I). See also Figures S1, S3–S7, and Table S1.
Figure 3
Figure 3
Distribution of muscimol injection sites in the MDJ, pons and medulla (A and B) Effects on the 2nd SS peak (A; n = 46, from 46 mice) and SS inhibition (B; n = 78, from 78 mice) at individual muscimol injection sites in the coronal plane at 2.1–2.3 mm, 2.3–2.7 mm, 2.7–2.9 mm, 2.9–3.1 mm, 4.3–4.7 mm and 4.7–5.1 mm caudal to the bregma (left to right panels). Injection sites were aligned to the Allen Mouse Common Coordinate Framework (CCFv3). Pseudocolor coding is as in Figure 1H. (C) Sites of images in A and B are sequentially shown rostrocaudally. (D) Relationship of standardized data between ΔSS inhibitions and Δ 2nd SS peaks. Correlation coefficient was calculated from PCs with both 2nd SS peak and SS inhibition data in Table S1 (n = 76). No. 3 in Table S1 was omitted from this analysis because it was an outlier. R = −0.306, p = 0.008; Spearman’s rank order test. (E) Dendrogram and heatmap of hierarchical clustering. The 3D coordinates (antero-posterior, dorso-ventral and medio-lateral) of the Allen Mouse Common Coordinate Framework (CCFv3) and ΔSS inhibition of individual injection sites were used as data for hierarchical clustering. Nine identified cluster numbers are presented on the right side of the graph. All data of the ION stimulation in Table S1, except injections into the right-side brain, were used. No. 3 and No. 6 injection sites in Table S1 are omitted from this analysis because they were outliers (red circles in F and H). (F) Summary of centers of muscimol injection sites color coded by cluster# shown in E in the sagittal plane (n = 89, from 89 mice). (G) Average (green bars) and individual data (circles) of ΔSS inhibition in 9 clusters. Individual data are color-coded (inset) according to average ΔSS inhibition in each cluster (values indicated by green bars). Two outliers (red circles) are presented on the right side. (H) Distributions of effective (4, 6 and 7) and ineffective (1, 2, 3, 5, 8 and 9) clusters. The color-coding is as in G. Three distinct effective clusters are in the MDJ (cluster 4), PG (cluster 6) and PRNc (cluster 7). Scale bars: 1 mm (A, F, H). See also Figures S3–S7, and Table S1.
Figure 4
Figure 4
Muscimol injection into the MDJ suppresses the 2nd SS peak and SS inhibition evoked by air puff stimulation (A) Schema for air puff stimulation (orange), muscimol injection (purple) and recording (green) sites. (B and C) Peri-stimulus SDFs of SSs evoked by right perioral stimulation (20 ms, 0.34 MPa) before (blue) and after (red) the muscimol injection. Data from all PCs (B; n = 7, from 7 mice) and PCs with clear 1st and 2nd SS peaks (C; n = 6, from 6 mice) are presented. Lines and shaded areas indicate mean and SEM, respectively. (D) Changes in the 1st SS peak (left), 2nd SS peak (middle) and SS inhibition (right) caused by muscimol injection into the MDJ. The 1st and 2nd SS peaks are summarized from reassembled data with clear peaks (C), and SS inhibition is summarized from all data (B). Averaged data for control (blue) and muscimol-injected (red) cells are presented as mean ± SEM. Muscimol injections into the MDJ significantly suppressed the 2nd SS peak and SS inhibition, but not the 1st SS peak (paired t-test, ∗p < 0.05). (E) Summary of centers of muscimol injection sites in the coronal plane. Injection sites were aligned to the Allen Mouse Common Coordinate Framework (CCFv3). Scale bar: 1 mm. See also Figure S6 and Table S1.
Figure 5
Figure 5
The 2nd SS peak is suppressed by optogenetic inactivation of the SII–MDJ, but not the cortico–PG pathway (A and E) Schemas of injections of AAVrg-CamKII-ArchT-GFP, permitting retrograde expression of ArchT-GFP in projection neurons, into the MDJ (A) and the PG (E). (B and F) Fluorescent images of Nissl bodies (magenta) and GFP signals at AAV injection sites (green) in the MDJ (B) and PG (F). Scale bars; 1 mm. (C, D, G, H) Fluorescent images of Nissl bodies and GFP-labeled cortico–MDJ (C and D) and cortico–PG (G and H) neurons in the cerebral cortex at 0.5 mm rostral to the Bregma. Regions surrounded by dotted yellow lines in C and G are magnified in D and H, respectively. Scale bars; 1 mm (C and G) and 20 μm (D and H). (I) Schema of ION stimulation (pink), SS recording (green) and optogenetic inactivation of cortical neurons. Yellow light (575 nm, 160 mW/mm2) was applied through a plastic optical fiber (0.4 mm diameter) that was placed in one of the grid columns. (J and N) Schemas of optical inactivation and AAV injection into the MDJ (J) and PG (N). (K and O) Pseudocolor coding of the average Δ 2nd SS peaks by light administration (see STAR Methods) onto cortico–MDJ (K) and cortico–PG (O) neurons. The grids marked with an asterisk indicate where the peak SS frequency with light illumination was significantly lower (K) or higher (O) than that without illumination (paired t-test, ∗p < 0.05). Number of trials used for calculating SDF for individual grids in individual PCs is 50. Number of PCs for individual grids are 5–8 (from 3 to 6 mice). (L, M, P, Q) (Left) Peri-stimulus SDFs of SSs in response to right ION stimulation with (orange) or without (blue) 575 nm light illumination onto cortico–MDJ neurons in the SII (L; n = 8, from 6 mice) and MI (M; n = 7, from 6 mice) or cortico–PG neurons in the SII (P; n = 7, from 4 mice) and the MI (Q; n = 6, from 5 mice). Lines and shaded areas indicate mean and SEM, respectively. (Right) Changes in the 2nd SS peak induced by light illumination (paired t-test, ∗p < 0.05). Averaged data are presented as mean ± SEM. See also Figures S1–S3 and S6.
Figure 6
Figure 6
SS inhibition is relayed at both the SII and MI (A and F) Schemas of ION stimulation (orange), recording (green) and muscimol injections (purple) into the left SI/SII (A) and MI (F). (B and G) Muscimol injection sites in the SII (B) and MI (G). (C and H) Peri-stimulus SDFs of SSs in response to right ION stimulation before (blue) and after (red) muscimol injections into the left SII (C) and MI (H). Data for all PCs (SII (C; n = 11, from 11 mice) and MI (H; n = 9, from 9 mice)) are presented. Lines and shaded areas indicate mean and SEM, respectively. (D and I) Similar to C, H, but data for PCs with clear 1st and 2nd SS peaks (SII (D; n = 8, from 8 mice) and MI (I; n = 7, from 7 mice)) are presented. (E and J) Changes in 1st SS peak (left), 2nd SS peak (middle) and normalized SS inhibition (right) produced by muscimol injections into the SII (E) and MI (J). The 1st and 2nd SS peaks are derived from reassembled data with clear peaks (D, I), and SS inhibitions are derived from all data (C, H). Paired t-test or Wilcoxon signed-rank test, ∗p < 0.05. Averaged data are presented as mean ± SEM. (K and L) Summary of centers of muscimol injection sites for Δ 2nd SS peaks (K) and ΔSS inhibition (L) in the cerebral cortex. Injection sites were aligned to the Allen Mouse Common Coordinate Framework (CCFv3). Pseudocolor coding is as in Figure 1H. Scale bars: 1 mm (B, G, K). See also Figures S1 and S3–S6.

Similar articles

References

    1. Allen G.I., Tsukahara N. Cerebrocerebellar communication systems. Physiol. Rev. 1974;54:957–1006. doi: 10.1152/physrev.1974.54.4.957. - DOI - PubMed
    1. Ito M. FT Press; 2012. The Cerebellum.
    1. Schmahmann J.D. Dysmetria of thought: clinical consequences of cerebellar dysfunction on cognition and affect. Trends Cognit. Sci. 1998;2:362–371. doi: 10.1016/s1364-6613(98)01218-2. - DOI - PubMed
    1. Henschke J.U., Pakan J.M. Disynaptic cerebrocerebellar pathways originating from multiple functionally distinct cortical areas. Elife. 2020;9 doi: 10.7554/eLife.59148. - DOI - PMC - PubMed
    1. Leergaard T.B., Bjaalie J.G. Topography of the complete corticopontine projection: from experiments to principal Maps. Front. Neurosci. 2007;1:211–223. doi: 10.3389/neuro.01.1.1.016.2007. - DOI - PMC - PubMed

LinkOut - more resources