. 2023 Jun;2(6):572-586.
doi: 10.1038/s44161-023-00281-3. Epub 2023 Jun 8.

Blockade of IL-6 signaling alleviates atherosclerosis in Tet2-deficient clonal hematopoiesis

Affiliations

Blockade of IL-6 signaling alleviates atherosclerosis in Tet2-deficient clonal hematopoiesis

Wenli Liu et al. Nat Cardiovasc Res. 2023 Jun.

Abstract

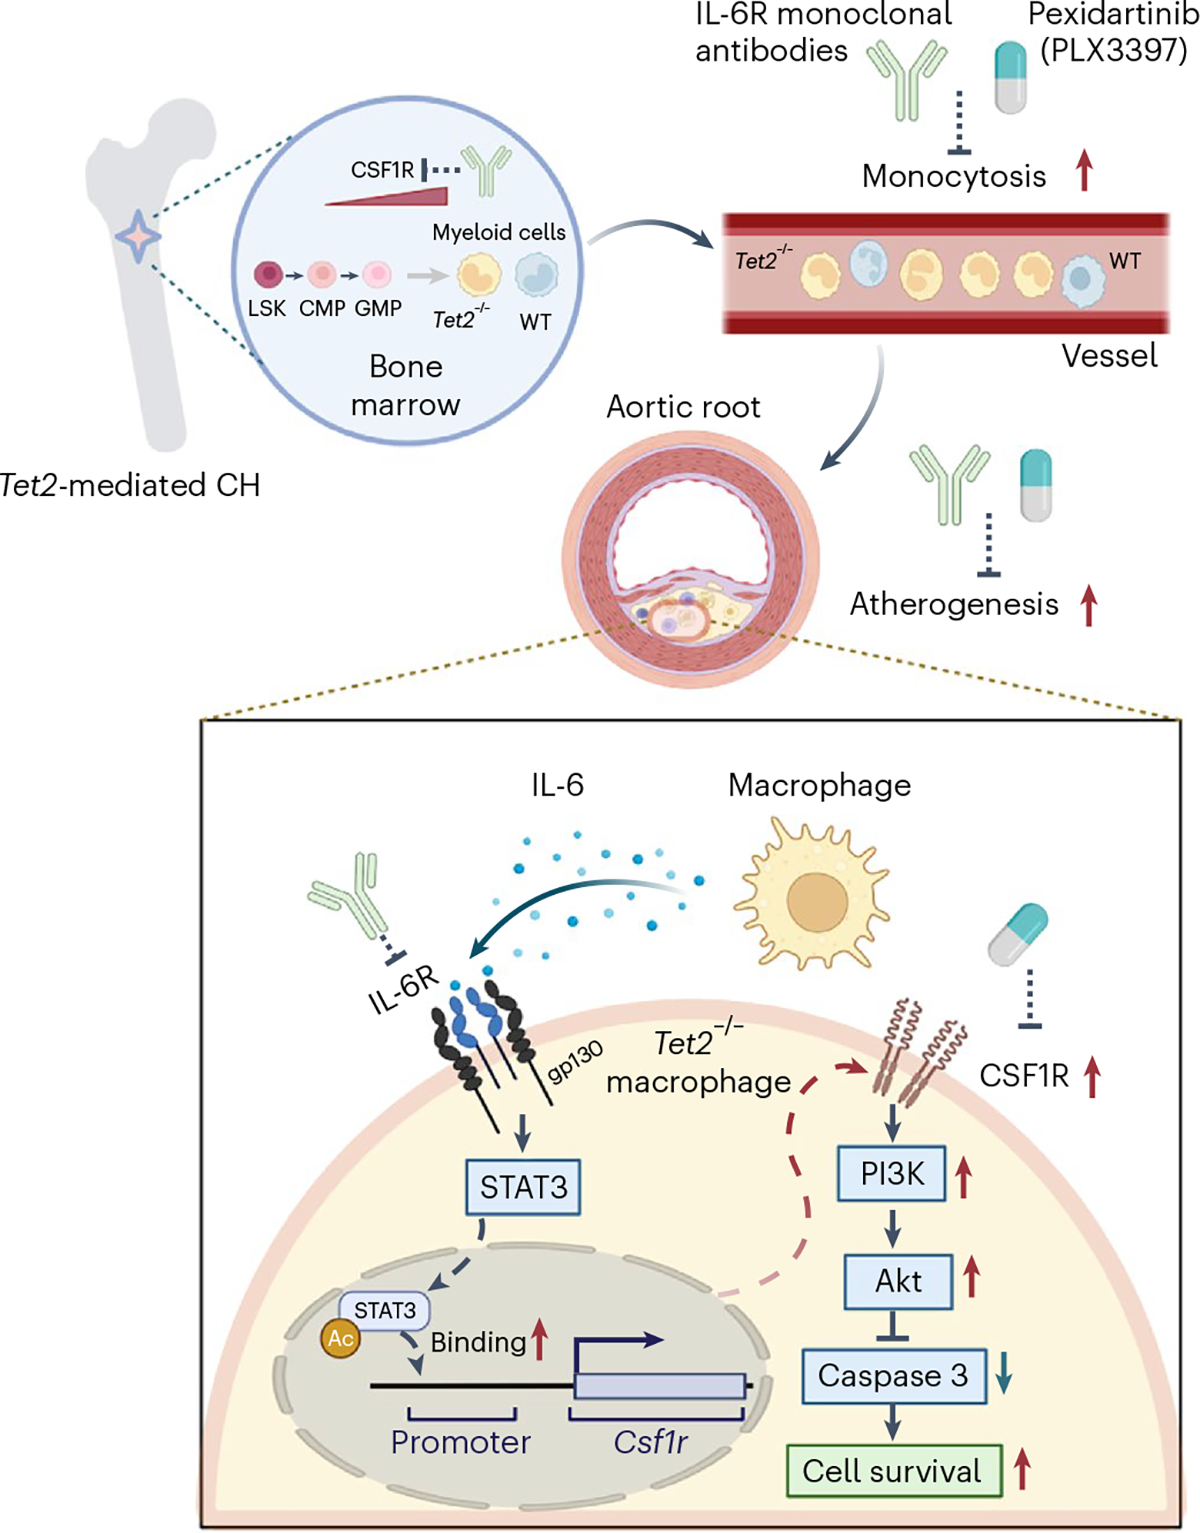
Clonal hematopoiesis (CH) increases the risk of atherosclerotic cardiovascular disease possibly due to increased plaque inflammation. Human studies suggest that limitation of interleukin-6 (IL-6) signaling could be beneficial in people with large CH clones, particularly in TET2 CH. Here we show that IL-6 receptor antibody treatment reverses the atherosclerosis promoted by Tet2 CH, with reduction of monocytosis, lesional macrophage burden and macrophage colony-stimulating factor 1 receptor (CSF1R) expression. IL-6 induces expression of Csf1r in Tet2-deficient macrophages through enhanced STAT3 binding to its promoter. In mouse and human Tet2-deficient macrophages, IL-6 increases CSF1R expression and enhances macrophage survival. Treatment with the CSF1R inhibitor PLX3397 reversed accelerated atherosclerosis in Tet2 CH mice. Our study demonstrates the causality of IL-6 signaling in Tet2 CH accelerated atherosclerosis, identifies IL-6-induced CSF1R expression as a critical mechanism and supports blockade of IL-6 signaling as a potential therapy for CH-driven cardiovascular disease.


Conflict of interest statement

Competing interests A.R.T. is a consultant for Amgen, CSL Behring, AstraZeneca and Foresite Laboratories, and is on the scientific advisory board of Staten Biotechnology, Fortico Biotech and Beren Therapeutics. P.L. is an unpaid consultant to, or involved in clinical trials for Amgen, AstraZeneca, Baim Institute, Beren Therapeutics, Esperion Therapeutics, Genentech, Kancera, Kowa Pharmaceuticals, MedImmune, Merck, Moderna, Novo Nordisk, Novartis, Pfizer and Sanofi Regeneron. P.L. is a member of the scientific advisory board for Amgen, Caristo Diagnostics, Cartesian Therapeutics, CSL Behring, DalCor Pharmaceuticals, Dewpoint Therapeutics, Elucid Bioimaging, Kancera, Kowa Pharmaceuticals, Olatec Therapeutics, MedImmune, Novartis, PlaqueTec, TenSixteen Bio, Soley Thereapeutics and XBiotech. His laboratory has received research funding in the last 2 years from Novartis, Novo Nordisk and Genentech. P.L. is on the board of directors of XBiotech. He has a financial interest in XBiotech, a company developing therapeutic human antibodies, in TenSixteen Bio, a company targeting somatic mosaicism and CHIP to discover and develop new therapeutics to treat age-related diseases, and in Soley Therapeutics, a biotechnology company that is combining artificial intelligence with molecular and cellular response detection to discover and develop new drugs, currently focusing on cancer therapeutics. His interests were reviewed and are managed by Brigham and Women’s Hospital and Mass General Brigham in accordance with their conflict-of-interest policies. The other authors declare no competing interests.

Figures

Extended Data Fig. 1 |
a. Ldlr/ male mice were transplanted with WT or Tet2KO male mice bone marrow; after 6 weeks reconstitution, WT→Ldlr/ (n = 9) and Tet2KO→Ldlr/ (n = 10) mice were fed a western diet for 12 weeks. Bar graph shows total lesion area in the aortic root. Two-tailed unpaired t-test. b-c. WT and Tet2KO macrophage were pretreated with or without IL-1β (100 μg/ml) blocking antibodies for 1 hr, then treated with LPS (20 ng/ml) for 4 hours followed by nigericin (5 μg/ml) for another 30 mins. Secreted IL-1β and IL-6 were determined by ELISA. n = 5 independent experiments. One-way ANOVA followed by Tukey’s multiple-comparison test. d. Bone marrow derived macrophages were pre-incubated with IL-6R blocking antibodies (100 μg/ml) for 1 hour and then challenged with or without IL-6 (25 ng/ml). qPCR was used to measure the mRNA level of Socs3 expression. n = 3 independent experiments. One-way ANOVA followed by Tukey’s multiple-comparison test. e-g. Peripheral blood white blood cells counts, RBC counts and platelet counts after 12 weeks western diet. n = 15 mice per group. One-way ANOVA followed by Tukey’s multiple-comparison test. h-l. Body weight, plasma cholesterol and triglycerides, liver/body weight ratio, spleen/body weight ratio after 12 weeks western diet. m. Immunoblot of isolated splenic monocytes and neutrophil Caspase1, cleaved IL-1β and β-actin after 12 weeks western diet. n = 6 mice per group. One-way ANOVA followed by Tukey’s multiple-comparison test or two-tailed unpaired t-test. n. Immunofluorescence staining of macrophage (anti-Mac2, Green), TREM2 (Red) in aortic roots and quantification of TREM2+Mac2+ cells as the percentage of total Mac2+ cells per lesion area in aortic root cross-sections. Scale Bar, 50μm. n = 15 mice per group. One-way ANOVA followed by Tukey’s multiple-comparison test. o. Immunofluorescence staining of macrophage (anti-Mac2, Green), IL-1β expression (Red) in aortic roots and quantification of IL-1β mean fluorescence intensity per lesion area in aortic root cross-sections. Scale Bar, 50μm. n = 15 mice per group. One-way ANOVA followed by Tukey’s multiple-comparison test. p. Quantification of CSF1R expression in monocytes of Ctrl and Tet2+/− mice. n = 5 mice in ctrl group. n = 6 mice in Tet2 +/− group. Two-tailed unpaired t-test. All the Data are Mean ± SEM.
Extended Data Fig. 2 |
a. Gating strategy for LSK cells and Hematopoietic progenitor cells (HPC, the first row), LSK (Sca1+c-Kit+) subpopulation (middle row) and HPC (Sca1c-Kit+) subpopulation (the third row). For the LSK subpopulation, CD150+CD48, CD150CD48, CD150CD48+ LSK fractions are long term HSC (LT-HSC), short term HSC (ST-HSC) and multipotent progenitors (MPP) respectively. For the HPC subpopulation, the cells are defined as common myeloid progenitors (LinSca1c-Kit+CD34+CD16/32int; CMP), granulocyte and macrophage progenitors (LinSca1c-Kit+CD34+CD16/32hi, GMP). b. Hematopoietic stem and progenitor cells in BM. n = 12 mice per group. One-way ANOVA followed by Tukey’s multiple-comparison test. c-h. CSF1R expression on stem and progenitor cells as determined by flow cytometry shown as mean fluorescence intensity and percentage of positive cells. n = 12 mice per group. One-way ANOVA followed by Tukey’s multiple-comparison test. All the Data are Mean ± SEM.
Extended Data Fig. 3 |
a. Immunoblot and quantification of p-STAT3/STAT3 with or without IL-6 (25 ng/ml). n = 3 independent experiments. Two-tailed unpaired t-test. b. BMDMs were pretreated with trichostatin A (TSA, 100 nM) or DMSO for 1 hour and then incubated with IL-6 (25 ng/ml) for 2 hours. The level of nuclear STAT3 acetylation was determined by western blot. n = 3 independent experiments. One-way ANOVA followed by Tukey’s multiple-comparison test. c. BMDMs were incubated with IL-6 (25 ng/ml) for indicated time. Methylation levels of the STAT3 binding site in the Csf1r promoter region of macrophages were analyzed. n = 3 independent experiments. Two-tailed unpaired t-test. d. Immunoblot and quantification of DNMT1, DNMT3A and DNMT3B expression in BMDMs with or without IL-6 (25 ng/ml) treatment for 4 hours. n = 5 independent experiments. One-way ANOVA followed by Tukey’s multiple-comparison test. e. BMDMs were pretreated with 5-Azacytidine (5-aza, 1 μM) or DMSO for 1 hour and then incubated with or without IL-6 (25 ng/ml) for 8 hours. mRNA level of Csf1r was tested by qPCR. n = 4 independent experiments. One-way ANOVA followed by Tukey’s multiple-comparison test. f. BMDMs were pretreated with 5-aza (1 μM) or DMSO for 1 hour and then incubated with IL-6 (25 ng/ml) for 4 hours. STAT3 binds to the Csf1r promoter area was revealed by ChIP-qPCR assay. Shown is percentage of input. n = 4 independent experiments. One-way ANOVA followed by Tukey’s multiple-comparison test. g. BMDMs were pretreated with TSA (100 nM) or DMSO for 1 hour and then incubated with (25 ng/ml) for 4 hours. Methylation levels of the STAT3 binding site in the Csf1r promoter region of macrophages. n = 5 independent experiments. One-way ANOVA followed by Tukey’s multiple-comparison test. All the Data are Mean ± SEM.
Extended Data Fig. 4 |
Extended Data Fig. 4 |. Immunoblot of CSF1R and cleaved Caspase 3 in macrophage with or without IL-6 (25 ng/ml) treatment for 48 hours.
Bar graph shows the quantification of immunoblots. n = 5 mice per group. One-way ANOVA followed by Tukey’s multiple-comparison test. All the Data are Mean ± SEM.
Extended Data Fig. 5 |
Extended Data Fig. 5 |. Ctrl and Tet2CH mice were fed a western diet for 7 weeks followed by another 5 weeks with or without PLX3397 (200 mg/kg) formulated WD feeding.
a. Food intake per day per mouse during 5 weeks PLX3397 WD feeding period. n = 3 independent cages per group. One-way ANOVA followed by Tukey’s multiple-comparison test. b. Plasma cholesterol levels. n = 11 mice in Ctrl+Control group, n = 12 mice in Tet2CH+Control group, n = 13 mice in Ctrl+PLX3397 group, n = 13 mice in Tet2CH + PLX3397 group. One-way ANOVA followed by Tukey’s multiple-comparison test. c-f. Body weight, liver/body weight ratio, spleen/body weight ratio and peripheral blood white blood cells counts, RBC counts and platelet counts after 12 weeks western diet. n = 11 mice in Ctrl+Control group, n = 12 mice in Tet2CH+Control group, n = 13 mice in Ctrl+PLX3397 group, n = 13 mice in Tet2CH + PLX3397 group. One-way ANOVA followed by Tukey’s multiple-comparison test. g. Control and Tet2KO BMDMs were treated with or without oxidized LDL (oxLDL, 50 μg/ml), acetylated LDL (acLDL, 50 μg/ml) or cholesterol crystal (CHO-C,100 μg/ml) overnight and then challenged with LPS (20 ng/ml) for 4 hours with fresh media. Secreted IL-6 level was quantified by ELISA. n = 4 independent experiments. Two-tailed unpaired t-test. All the Data are Mean ± SEM.
Extended Data Fig. 6 |
a. Flow cytometric analysis of cell surface molecular expression on human embryonic stem cell-derived TET2 deficient macrophages and its isogenic control in day 24. n = 3 independent experiments. Two-tailed unpaired t-test. b. Strategy for gating and confirmation of induced pluripotent stem cell (iPSC) with TET2 haploinsufficiency (TET+/) and isogenic control for the progenitors (CD34+) and lineage-committed (CD34 + CD45+) cells differentiation on Day1. c. Control and TET2+/ iPSCs were treated with or without hIL-6 (25 ng/ml) for 48 hours. CSF1R expression was analyzed by flow cytometry. n = 3 independent experiments. One-way ANOVA followed by Tukey’s multiple-comparison test. d. Flow cytometric analysis of cell surface molecular expression on iPSC derived TET+/ and isogenic control macrophage after 24 days of differentiation. n = 3 independent experiments. Two-tailed unpaired t-test. e. Control and TET2+/ iPSC-derived macrophages were treated with or without hIL-6 (25 ng/ml) for 48 hours. CSF1R expression was quantified by flow cytometry. n = 3 independent experiments. One-way ANOVA followed by Tukey’s multiple-comparison test. f. Immunoblot and quantification of CSF1R and cleaved Caspase 3 in control and TET2+/ iPSC-derived macrophages with or without hIL-6 (25 ng/ml) treatment for 48 hours. n = 3 independent experiments. One-way ANOVA followed by Tukey’s multiple-comparison test. g. TET2+/ and its isogenc control iPSCs were treated with or without oxidized LDL (oxLDL, 50 μg/ml), acetylated LDL (acLDL, 50 μg/ml) or cholesterol crystal (CHO-C,100 μg/ml) overnight and then challenged with LPS (20 ng/ml) for 4 hours with fresh media. Secreted IL-6 level was quantified by ELISA. n = 4 independent experiments. Two-tailed unpaired t-test. All the Data are Mean ± SEM.
Extended Data Fig. 7 |
Extended Data Fig. 7 |. A schematic summary of the main findings.
The schema illustrating proposed mechanisms underlying the benefit of IL-6R or CSF1R inhibition in Tet2 CH-accelerated atherosclerosis.
Fig. 1 |
Fig. 1 |. Increased monocytosis in Tet2 CH mice is seen with reversal by IL-6R antibody administration.
a, Ldlr−/− male mice were transplanted with WT or Tet2 knockout male mice bone marrow. After 6 weeks of bone marrow reconstitution, WT Ldlr−/− (n = 9) and Tet2 knockout Ldlr/ (n = 10) mice were fed a WD for 12 weeks. The aortic root sections stained for IL-6 (red) and macrophage marker (anti-Mac2, green) are shown. Scale bar, 50 μm. Two-tailed, unpaired t-test. MFI, mean fluorescence intensity. b, Experimental design and timeline. c, CD45.2+ white blood cells as a percentage of total CD45+ white blood cells, evaluated using flow cytometry. n = 15 mice per group. One-way analysis of variance (ANOVA) followed by Tukey test for multiple comparisons. d, Enzyme-linked immunosorbent assay (ELISA) measurement of plasma SAA. Ctrl + IgG, n = 15; Tet2 CH + IgG, n = 15; Ctrl + anti-IL-6R, n = 13; Tet2 CH + anti-IL-6R, n = 14. One-way ANOVA followed by Tukey test for multiple comparisons. eg, Circulating Ly6Chi, Ly6Clo and total monocytes (e), neutrophils (f), and CD45.2 or CD45.1 Ly6Chi, Ly6Clo and total monocyte (g) were quantified as the percentage of total CD45+ white blood cells using flow cytometry. n = 15 mice per group. One-way ANOVA followed by Tukey test for multiple comparisons. h, Flow cytometry analysis of aortic CD11b+ cells and macrophages shown as a percentage of CD45+ aortic cells (brachiocephalic artery and descending aorta). Each point contains combined, digested aortic cells from n = 2 or n = 3 mice. One-way ANOVA followed by Tukey test for multiple comparisons. BV421, Brilliant Violet 421 stain. All data are the mean ± s.e.m.
Fig. 2 |
Fig. 2 |. IL-6R antagonism ameliorates atherosclerosis in Tet2 CH mice.
a, Hematoxylin and eosin (H&E) staining and quantification of total lesion area in the aortic root. Scale bar, 200 μm. Except for the Ctrl + Control group (n = 14 mice), the other three groups had n = 15 mice per group. One-way ANOVA followed by Tukey test for multiple comparisons. b, Immunofluorescence staining of macrophages (anti-Mac2, green) in aortic roots and quantification of Mac2+ area per section. Scale bar, 250 μm. Except for the Ctrl + Control group (n = 14 mice), the other three groups had n = 15 mice per group. One-way ANOVA followed by Tukey test for multiple comparisons. c, Immunofluorescence staining of tdTomato+ macrophages (anti-red fluorescent protein, red) and quantification as the percentage of total Mac2 area (anti-Mac2, green) with or without IL-6R antibody treatment in Tet2 CH mice. Scale bar, 250 μm. n = 13 mice in the Tet2 CH + Ctrl group, n = 15 mice in the Tet2 CH + anti-IL-6R group. Two-tailed unpaired t-test. d, Aortic root sections were stained with Masson’s trichrome stain for the fibrous cap (red, outlined by the dashed lines). The bar graph shows the quantification. Scale bar, 100 μm. Except for the Ctrl + Control group (n = 13 mice), the other three groups had n = 15 mice per group. One-way ANOVA followed by Tukey test for multiple comparisons. e, H&E staining and quantification of the necrotic core area in the aortic root. Necrotic core regions are indicated by the dashed lines. Scale bar, 100 μm. Except for the Ctrl + Control group (n = 14 mice), the other three groups had n = 15 mice per group. One-way ANOVA followed by Tukey test for multiple comparisons. f, Immunofluorescence staining of macrophage (anti-Mac2, green) CSF1R expression (red) in aortic roots and quantification of macrophage CSF1R MFI in aortic root cross-sections. Scale bar, 50 μm. Ctrl + Control and Tet2 CH + Control, n = 12 mice per group. Ctrl + anti-IL-6R and Tet2 CH + anti-IL-6R, n = 13 per group. One-way ANOVA followed by Tukey test for multiple comparisons. g, The CSF1R expression in monocytes from the bone marrow was assessed using flow cytometry and immunoblotting. n = 6 mice per group. One-way ANOVA followed by Tukey test for multiple comparisons. h, Immunofluorescence staining of macrophages (anti-Mac2, green) proliferation (anti-Ki67, red) in aortic roots and quantification of Ki67+Mac2+ cells per section. Scale bar, 50 μm. Except for the Ctrl + Control group (n = 13 mice), the other three groups had n = 15 mice per group. One-way ANOVA followed by Tukey test for multiple comparisons. i, Immunofluorescence staining of cleaved caspase 3 (anti-cleaved caspase 3, red) and macrophage (anti-Mac2, green) in the aortic roots and quantification of cleaved caspase 3+/Mac2+ cells per section. Scale bar, 50 μm. Except for the Ctrl + Control group (n = 14 mice), the other three groups had n = 15 mice per group. One-way ANOVA followed by Tukey test for multiple comparisons. All data are the mean ± s.e.m.
Fig. 3 |
Fig. 3 |. IL-6 increases CSF1R expression and apoptosis resistance in Tet2-deficient macrophages.
a, BMDMs were treated with IL-6 (25 ng ml−1) with or without IL-6R antibody (100 μg ml−1) for 48 h; CSF1R expression was assessed by immunoblot. n = 5 independent experiments. One-way ANOVA followed by Tukey test for multiple comparisons. b, mRNA level of Csf1r in BMDMs with or without IL-6 (25 ng ml−1) treatment. n = 5 independent experiments. One-way ANOVA followed by Tukey test for multiple comparisons. c, STAT3 binds to the Csf1r promoter area, as shown by ChIP assay after IL-6 (25 ng ml−1) treatment, shown as the percentage of input. n = 3 independent experiments. Two-tailed, unpaired t-test. d, BMDMs were treated with IL-6 (25 ng ml−1) for 2 h and the levels of nuclear STAT3 acetylation and total STAT3 were determined by immunoblot. Lamin A/C is the nuclear protein marker. n = 8 independent experiments. One-way ANOVA followed by Tukey test for multiple comparisons. e, BMDMs were pretreated with TSA (100 nM) or dimethyl sulfoxide (DMSO) for 1 h and then incubated with IL-6 (25 ng ml−1) for 2 h. STAT3 binds to the Csf1r promoter area as shown by the ChIP–qPCR assay, shown as the percentage of the input. n = 4 independent experiments. One-way ANOVA followed by Tukey test for multiple comparisons. f, Ctrl and Tet2 knockout macrophages were pretreated with TSA (100 nM) or DMSO for 1 h and then incubated with or without IL-6 (25 ng ml−1) for 8 h. Csf1r mRNA was quantified by qPCR. n = 4 independent experiments. One-way ANOVA followed by Tukey test for multiple comparisons. g, Quantification of annexin V+ macrophages by flow cytometry with or without IL-6 (25 ng ml−1) in serum-free medium for 48 h. n = 6 independent experiments. One-way ANOVA followed by Tukey test for multiple comparisons. h, Immunoblot of cleaved caspase 3 in macrophages with or without IL-6 (25 ng ml−1) in serum-free medium for 48 h. The bar graph shows the quantification of the immunoblots. n = 6 independent experiments. One-way ANOVA followed by Tukey test for multiple comparisons. i, Immunoblot of p-PI3K, PI3K, p-Akt, Akt and β-actin with or without 30-min treatment with IL-6 (25 ng ml−1). n = 5 independent experiments. One-way ANOVA followed by Tukey test for multiple comparisons. j, Macrophages were treated with or without IL-6 (25 ng ml−1) or the CSF1R inhibitor PLX3397 (1 μM) for 48 h in serum-free medium; the bar graph shows annexin V+ macrophages as a percentage of total macrophages as assessed using flow cytometry. n = 5 independent experiments. One-way ANOVA followed by Tukey test for multiple comparisons. k, Macrophages were pretreated with or without PLX3397 (1 μM) for 1 h followed by another 30 min with or without IL-6 (25 ng ml−1) treatment. Expression of p-PI3K, PI3K, p-Akt, Akt and β-actin was analyzed by immunoblot. n = 5 independent experiments. One-way ANOVA followed by Tukey test for multiple comparisons. All data are the mean ± s.e.m.
Fig. 4 |
Fig. 4 |. Accelerated atherosclerosis in Tet2 CH mice is reversed by PLX3397.
a, Experimental design and timeline. Ctrl and Tet2 CH mice were fed a WD for 7 weeks followed by another 5 weeks with or without PLX3397 (200 mg kg−1) formulated WD feeding. b, Circulating Ly6Chi and Ly6Clo, total monocyte and neutrophils were quantified as the percentage of total CD45+ white blood cells using flow cytometry. n = 11 mice in the Ctrl + Control group, n = 12 mice in the Tet2 CH + Control group, n = 13 mice in the Ctrl + PLX3397 group and n = 13 mice in the Tet2 CH + PLX3397 group. One-way ANOVA followed by Tukey test for multiple comparisons. c, CD45.2+ white blood cells as a percentage of total CD45+ white blood cells in the blood, evaluated using flow cytometry. n = 11 mice in the Ctrl + Control group, n = 12 mice in the Tet2 CH + Control group, n = 13 mice in the Ctrl + PLX3397 group and n = 13 mice in the Tet2 CH + PLX3397 group. One-way ANOVA followed by Tukey test for multiple comparisons. d, H&E staining and quantification of the total lesion area in the aortic root. Scale bar, 200 μm. n = 11 mice in the Ctrl + Control group, n = 12 mice in the Tet2 CH + Control group, n = 13 mice in the Ctrl + PLX3397 group and n = 13 mice in the Tet2 CH + PLX3397 group. One-way ANOVA followed by Tukey test for multiple comparisons. e, Immunofluorescence staining of macrophages (anti-Mac2, green) in the aortic roots and quantification of Mac2+ area per section. Scale bar, 250 μm. n = 11 mice in the Ctrl + Control group, n = 12 mice in the Tet2 CH + Control group, n = 13 mice in the Ctrl + PLX3397 group and n = 13 mice in the Tet2 CH + PLX3397 group. One-way ANOVA followed by Tukey test for multiple comparisons. All data are the mean ± s.e.m.
Fig. 5 |
Fig. 5 |. Human ESC-derived TET2-deficient macrophages show increased CSF1R expression and resistance to apoptosis after IL-6 treatment.
a, Schematic summary of the human ESC line phenotypic marker from progenitors to macrophages. b, Gating strategy and verification of CD34+ control and TET2−/− progenitors or lineage-committed CD34+CD45+ cells. c,d, Control and TET2−/− human ESC CD34+ progenitors (c) or CD34+/CD45+ cells (d) were treated with or without human IL-6 (25 ng ml−1) for 48 h. Representative histograms showing CSF1R expression, with statistics showing the CSF1R MFI. n = 3 independent experiments. One-way ANOVA followed by Tukey test for multiple comparisons. e, Gating strategy and verification of control and TET2−/− human ESC-derived macrophages. f, Control and TET2−/− human ESC-derived macrophages were treated with or without human IL-6 (25 ng ml−1). Representative histogram showing CSF1R expression as quantified using flow cytometry. n = 3 independent experiments. One-way ANOVA followed by Tukey test for multiple comparisons. g, Control and TET2−/− human ESC-derived macrophages were treated with human IL-6 (25 ng ml−1) for 8 h; Csf1r mRNA levels were determined using qPCR. n = 3 independent experiments. One-way ANOVA followed by Tukey test for multiple comparisons. h, Control and TET2−/− human ESC-derived macrophages were treated with or without human IL-6 (25 ng ml−1). CSF1R expression was assessed using immunoblotting. C, control; T, TET2−/−. n = 3 independent experiments. One-way ANOVA followed by Tukey test for multiple comparisons. i, Control and TET2−/− human ESC-derived macrophages were treated with or without oxidized LDL (50 μg ml−1), acetylated LDL (50 μg ml−1) or cholesterol crystals (100 μg ml−1) overnight and then challenged with LPS (20 ng ml−1) for 4 h with fresh medium. The secreted IL-6 level was quantified using ELISA. n = 6 independent experiments. Two-tailed, unpaired t-test. j, Annexin V+ human ESC-derived macrophage percentage of total macrophages as assessed using flow cytometry and immunoblotting of cleaved caspase 3 treated with or without human IL-6 (25 ng ml−1) for 48 h. n = 3 independent experiments. One-way ANOVA followed by Tukey test for multiple comparisons. k, Immunoblot and quantification of p-PI3K, PI3K, p-Akt, Akt and β-actin. n = 3 independent experiments. One-way ANOVA followed by Tukey test for multiple comparisons. l, Human TET2 CH (n = 6) and Control (n = 8) peripheral blood mononuclear cell (PBMC) CSF1R RNA was quantified in CD16+ monocytes using scRNA-seq. Two-tailed, unpaired t-test. All data are the mean ± s.e.m.

Comment in

References

    1. Genovese G et al. Clonal hematopoiesis and blood-cancer risk inferred from blood DNA sequence. N. Engl. J. Med. 371, 2477–2487 (2014). - PMC - PubMed
    1. Busque L et al. Recurrent somatic TET2 mutations in normal elderly individuals with clonal hematopoiesis. Nat. Genet. 44, 1179–1181 (2012). - PMC - PubMed
    1. Steensma DP et al. Clonal hematopoiesis of indeterminate potential and its distinction from myelodysplastic syndromes. Blood 126, 9–16 (2015). - PMC - PubMed
    1. Jaiswal S et al. Clonal hematopoiesis and risk of atherosclerotic cardiovascular disease. N. Engl. J. Med. 377, 111–121 (2017). - PMC - PubMed
    1. Tall AR & Fuster JJ Clonal hematopoiesis in cardiovascular disease and therapeutic implications. Nat. Cardiovasc. Res. 1, 116–124 (2022). - PMC - PubMed

LinkOut - more resources