. 2023 Feb 1;8(1):190-211.
doi: 10.1002/lol2.10248.

Five state factors control progressive stages of freshwater salinization syndrome

Affiliations

Five state factors control progressive stages of freshwater salinization syndrome

Sujay S Kaushal et al. Limnol Oceanogr Lett. .

Abstract

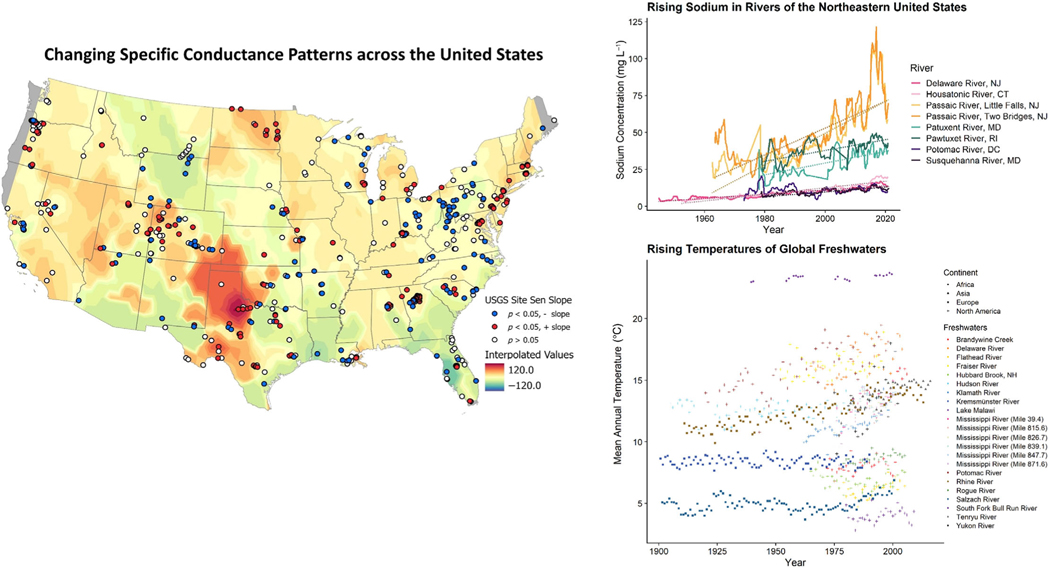
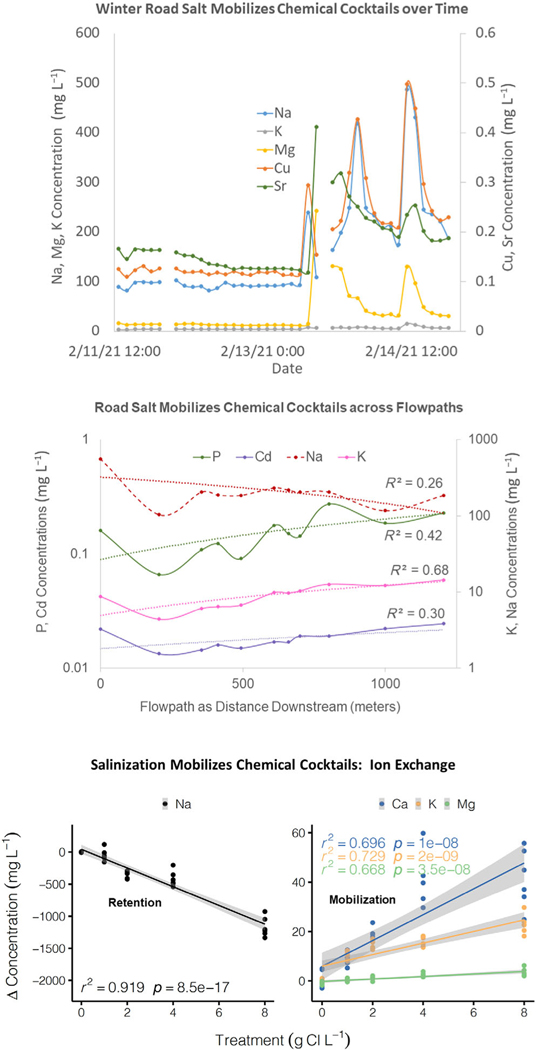
Factors driving freshwater salinization syndrome (FSS) influence the severity of impacts and chances for recovery. We hypothesize that spread of FSS across ecosystems is a function of interactions among five state factors: human activities, geology, flowpaths, climate, and time. (1) Human activities drive pulsed or chronic inputs of salt ions and mobilization of chemical contaminants. (2) Geology drives rates of erosion, weathering, ion exchange, and acidification-alkalinization. (3) Flowpaths drive salinization and contaminant mobilization along hydrologic cycles. (4) Climate drives rising water temperatures, salt stress, and evaporative concentration of ions and saltwater intrusion. (5) Time influences consequences, thresholds, and potentials for ecosystem recovery. We hypothesize that state factors advance FSS in distinct stages, which eventually contribute to failures in systems-level functions (supporting drinking water, crops, biodiversity, infrastructure, etc.). We present future research directions for protecting freshwaters at risk based on five state factors and stages from diagnosis to prognosis to cure.


Figures

Fig. 1.
Fig. 1.
(Left panel) Interpolated values of change in specific conductance (microsiemens per centimeter at 25°C) across streams of the continental United States. Although there are increasing trends, for some sites, specific conductance has decreased or remained unchanged suggesting regional variability. Sen’s slope analyses were performed on data from inland USGS sites with a minimum of a 10-yr span of mean specific conductance recordings. Only sites containing data after 2000 were included. Sites with statistically significant slopes were used to perform ordinary kriging interpolation. Interpolated values were calculated from a spherical semivariogram model (nugget = 0.182, partial sill = 94.8, range = 1.92) in ArcGIS Pro. Warmer colors indicate increasing specific conductance patterns, whereas cooler colors indicate decreasing specific conductance patterns. Areas outside the data extent are represented by gray. The black-outlined dots represent USGS sites. Details on similar analyses can be found in Kaushal et al. (2018b). (Top right panel) Increasing sodium concentrations in rivers of the Northeastern United States; all data are from USGS stream gauge sites. There is not always a continuous increase in Na+ concentrations over time and the increase in Na+ can sometimes be more apparent at sites, which have higher salinity. Details on similar analyses at sites can be found in Kaushal et al. (2013, 2018b). (Bottom right panel) Increasing temperature trends in global freshwaters. All data are from previously published papers including Kaushal et al. (2010), and references are in Supporting Information.
Fig. 2.
Fig. 2.
Major state factors influencing the formation rates and progression of FSS. Superscript numbers correspond to literature references found in Supporting Information.
Fig. 3.
Fig. 3.
Common causes and consequences of FSS are often connected. Superscript numbers correspond to literature references found in Supporting Information.
Fig. 4.
Fig. 4.
FSS mobilizes chemical cocktails across space and time in Campus Creek, a small urban stream in College Park, Maryland. Campus Creek has undergone a type of stream restoration known as regenerative stormwater conveyance, which dramatically enhances floodplain reconnection through the creation of a series of step pools. (Top panel) In Campus Creek, there are peaks in ion concentrations during a winter road salt event illustrating the importance of mobilization of multiple elements over time in response to deicer applications and winter climate. (Middle panel) Along the longitudinal flowpath of Campus Creek, Na concentrations decline during winter after a road salt event, as other elemental concentrations increase (all slopes are significantly different than zero); this suggests the importance of ion exchange and/or shifts in sources along the flowpath. (Bottom panel) Laboratory salinization experiments with sediments from Campus Creek demonstrates the importance of Na retention as NaCl is added at increasing concentrations (using experimental methods similar to Haq et al. 2018 and Kaushal et al. 2019); other elements are mobilized and released from sediments of Campus Creek due to ion exchange and geochemical processes.
Fig. 5.
Fig. 5.
(Panel a) There can be a progression of FSS through distinct stages that can be diagnosed with water quality and other data. Based on state factors, diverse consequences of FSS can evolve across stages characterized by shifts in ion mobility, ion exchange capacity of soils, biological toxicity, persistence and transformation in the environment, etc. (Panel b) Specific conductance data recorded at high temporal resolution in four lotic systems of the mid-Atlantic U.S. Data collected from automated specific conductance records in the Anacostia, Capacon, and Potomac Rivers and Difficult Run from 2016 to 2021. The Capacon River is a minimally disturbed reference site and the Anacostia and Potomac Rivers and Difficult Run are affected by urbanization, agriculture, and other impacted land uses. In situ readings were recorded every 5 or 15 min at each site. (Panel c) The percentage of time each of the four waterways spent above three key thresholds over the 5-yr period depicted above. Thresholds for conductivity are derived from U.S. and Australian federal water quality management agencies and the United Nations Food and Agricultural Organization.

References

    1. Aber JD, Nadelhoffer KJ, Steudler P, and Melillo JM. 1989. Nitrogen saturation in northern forest ecosystems. Bioscience 39: 378–386. doi:10.2307/1311067 - DOI
    1. Ardon M, Morse JL, Colman BP, and Bernhardt ES. 2013. Drought-induced saltwater incursion leads to increased wetland nitrogen export. Glob. Change Biol 19: 2976–2985. doi:10.1111/gcb.12287 - DOI - PubMed
    1. Badr L, Boardman G, and Bigger J. 2012. Review of water use in U.S. thermoelectric power plants. J. Energy Eng 138: 246–257. doi:10.1061/(ASCE)EY.1943-7897.0000076 - DOI
    1. Barlow PM, and Reichard EG. 2010. Saltwater intrusion in coastal regions of North America. Hydrgeol. J 18: 247–260. doi:10.1007/s10040-009-0514-3 - DOI
    1. Benettin P, Rinaldo A, and Botter G. 2013. Kinematics of age mixing in advection-dispersion models. Water Resour. Res 49: 8539–8551. doi:10.1002/2013WR014708 - DOI