. 2024 Mar;56(3):1715-1737.
doi: 10.3758/s13428-023-02117-1. Epub 2023 Aug 1.

Solving the many-variables problem in MICE with principal component regression

Affiliations

Solving the many-variables problem in MICE with principal component regression

Edoardo Costantini et al. Behav Res Methods. 2024 Mar.

Abstract

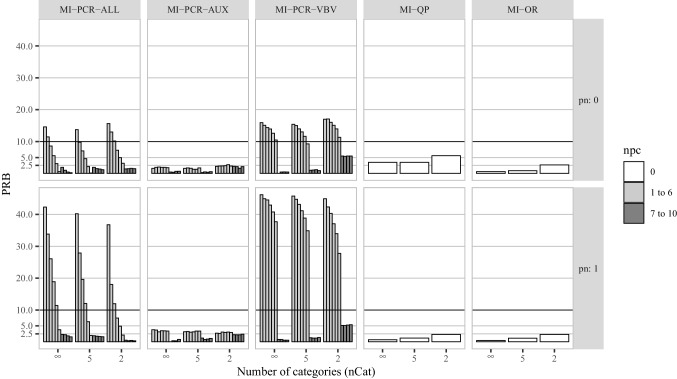
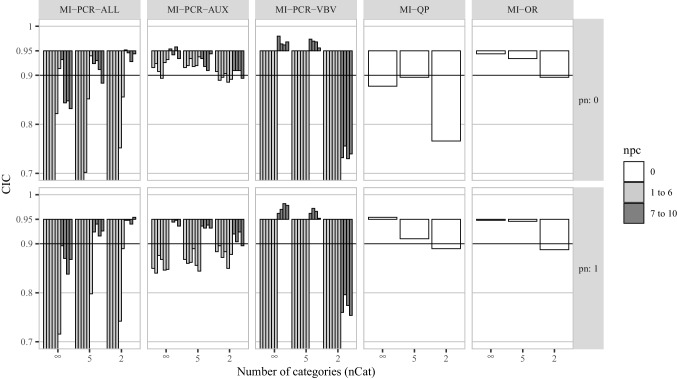
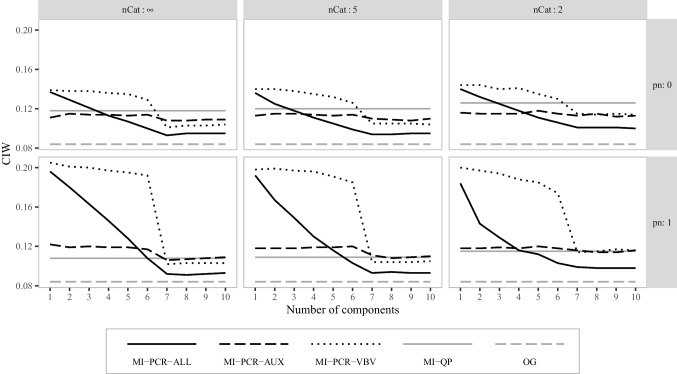
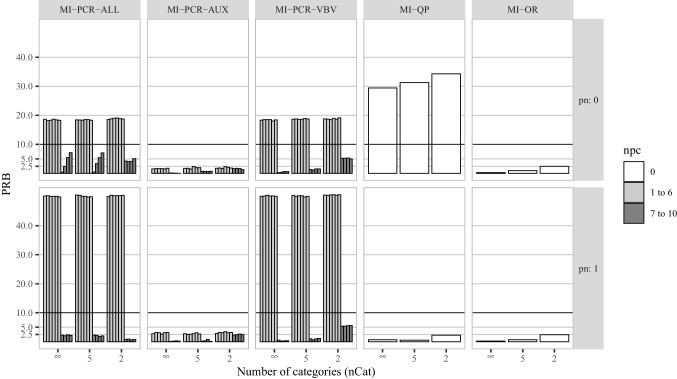
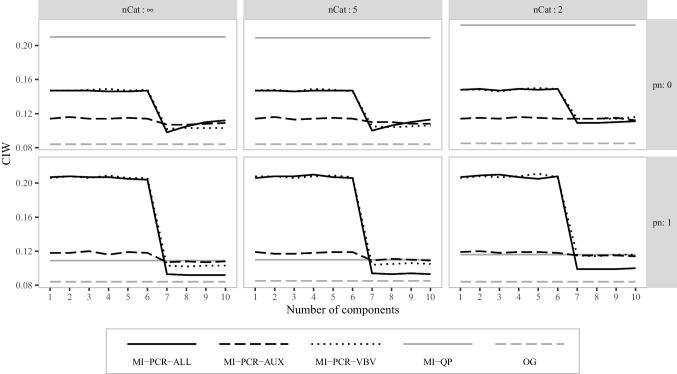
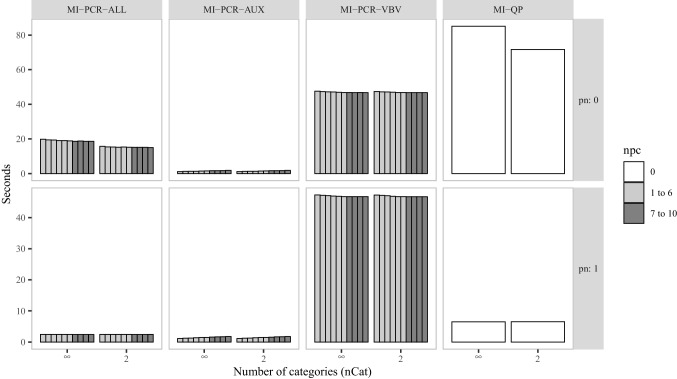
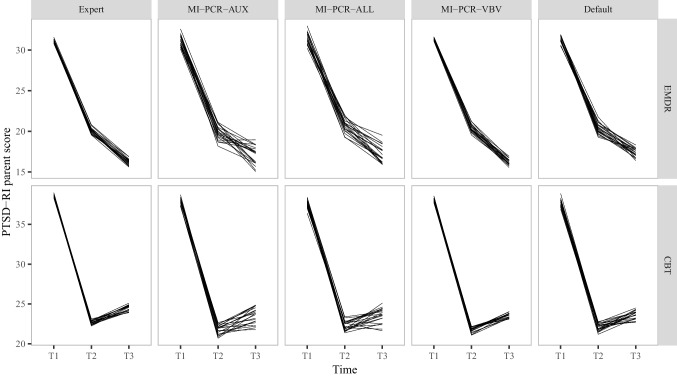
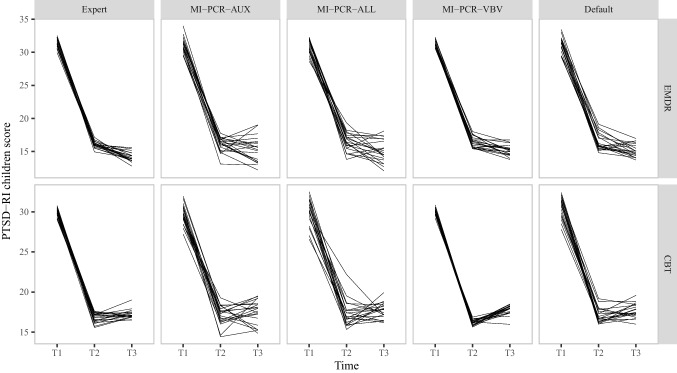
Multiple Imputation (MI) is one of the most popular approaches to addressing missing values in questionnaires and surveys. MI with multivariate imputation by chained equations (MICE) allows flexible imputation of many types of data. In MICE, for each variable under imputation, the imputer needs to specify which variables should act as predictors in the imputation model. The selection of these predictors is a difficult, but fundamental, step in the MI procedure, especially when there are many variables in a data set. In this project, we explore the use of principal component regression (PCR) as a univariate imputation method in the MICE algorithm to automatically address the many-variables problem that arises when imputing large social science data. We compare different implementations of PCR-based MICE with a correlation-thresholding strategy through two Monte Carlo simulation studies and a case study. We find the use of PCR on a variable-by-variable basis to perform best and that it can perform closely to expertly designed imputation procedures.

Keywords: High-dimensional data; Missing data; Multiple imputation; Principal component regression.


Figures

Fig. 1
Fig. 1
Percent relative bias for the correlation between x1 and x2 in simulation study 1. pn is the proportion of noise variables in A. npc is the number of PCs used by a given imputation method. The X-axis of each histogram distinguishes three levels of coarsening for the potential auxiliary variables (nCat=(,5,2)). For each MI-PCR method, we reported a different vertical bar for each PRB obtained using a different number of PCs (from 1 to 10, from left to right)
Fig. 2
Fig. 2
Confidence interval coverage for the correlation between x1 and x2 in simulation study 1. pn is the proportion of noise variables in A. npc is the number of PCs used by a given imputation method. The X-axis of each histogram distinguishes three levels of coarsening for the potential auxiliary variables (nCat=(,5,2)). For each MI-PCR method, we reported a different vertical bar for each CIC obtained using a different number of PCs (from 1 to 10, from left to right)
Fig. 3
Fig. 3
Average confidence interval width for the correlation between x1 and x2 in simulation study 1. nCat is the number of categories for the items in matrices M and A. pn is the proportion of noise variables in A
Fig. 4
Fig. 4
Percent relative bias for the correlation between x1 and x2 in simulation study 2. pn is the proportion of noise variables in A. npc is the number of PCs used by a given imputation method. The X-axis of each histogram distinguishes three levels of coarsening for the potential auxiliary variables (nCat=(,5,2)). For each MI-PCR method, we reported a different vertical bar for each PRB obtained using a different number of PCs (from 1 to 10, from left to right)
Fig. 5
Fig. 5
Confidence interval coverage for the correlation between x1 and x2 in simulation study 2. pn is the proportion of noise variables in A. npc is the number of PCs used by a given imputation method. The X-axis of each histogram distinguishes three levels of coarsening for the potential auxiliary variables (nCat=(,5,2)). For each MI-PCR method, we reported a different vertical bar for each CIC obtained using a different number of PCs (from 1 to 10, from left to right)
Fig. 6
Fig. 6
Average confidence interval width for the correlation between x1 and x2 in simulation study 2. nCat is the number of categories for the items in M and A. pn is the proportion of noise variables in A
Fig. 7
Fig. 7
Average imputation time in simulation study 2. nCat is the number of categories for the items in M and A. pn is the proportion of noise variables in A
Fig. 8
Fig. 8
Mean levels of PTSD-RI parent score after imputation. The multiple lines plotted for each method represent results obtained with 20 different seeds
Fig. 9
Fig. 9
Mean levels of PTSD-RI children score after imputation. The multiple lines plotted for each method represent results obtained with 20 different seeds

References

    1. Bair, E., Hastie, T., Paul, D., & Tibshirani, R. (2006). Prediction by supervised principal components. Journal of the American Statistical Association,101(473), 119–137.
    1. Bollen, K. A. (1989). Structural equations with latent variables (Vol. 210). John Wiley & Sons
    1. Burgette, L. F., & Reiter, J. P. (2010). Multiple imputation for missing data via sequential regression trees. American Journal of Epidemiology,172(9), 1070–1076. 10.1093/aje/kwq260. - PubMed
    1. Chavent M, Kuentz-Simonet V, Saracco J. Orthogonal rotation in pcamix. Advances in Data Analysis and Classification. 2012;6(2):131–146. doi: 10.1007/s11634-012-0105-3. - DOI
    1. Collins, L. M., Schafer, J. L., & Kam, C.-M. (2001). A comparison of inclusive and restrictive strategies in modern missing data procedures. Psychological Methods,6(4), 330–351. 10.1037//1082-989X.6.4.330. - PubMed

LinkOut - more resources