. 2023 Oct 13;29(20):4278-4288.
doi: 10.1158/1078-0432.CCR-23-1106.

Neoantigen Targetability in Progressive Advanced Melanoma

Affiliations

Neoantigen Targetability in Progressive Advanced Melanoma

Jitske van den Bulk et al. Clin Cancer Res. .

Abstract

Purpose: The availability of (neo)antigens and the infiltration of tumors by (neo)antigen-specific T cells are crucial factors in cancer immunotherapy. In this study, we aimed to investigate the targetability of (neo)antigens in advanced progessive melanoma and explore the potential for continued T-cell-based immunotherapy.

Experimental design: We examined a cohort of eight patients with melanoma who had sequential metastases resected at early and later time points. Antigen-presenting capacity was assessed using IHC and flow cytometry. T-cell infiltration was quantified through multiplex immunofluorescence. Whole-exome and RNA sequencing were conducted to identify neoantigens and assess the expression of neoantigens and tumor-associated antigens. Mass spectrometry was used to evaluate antigen presentation. Tumor recognition by autologous T cells was assessed by coculture assays with cell lines derived from the metastatic lesions.

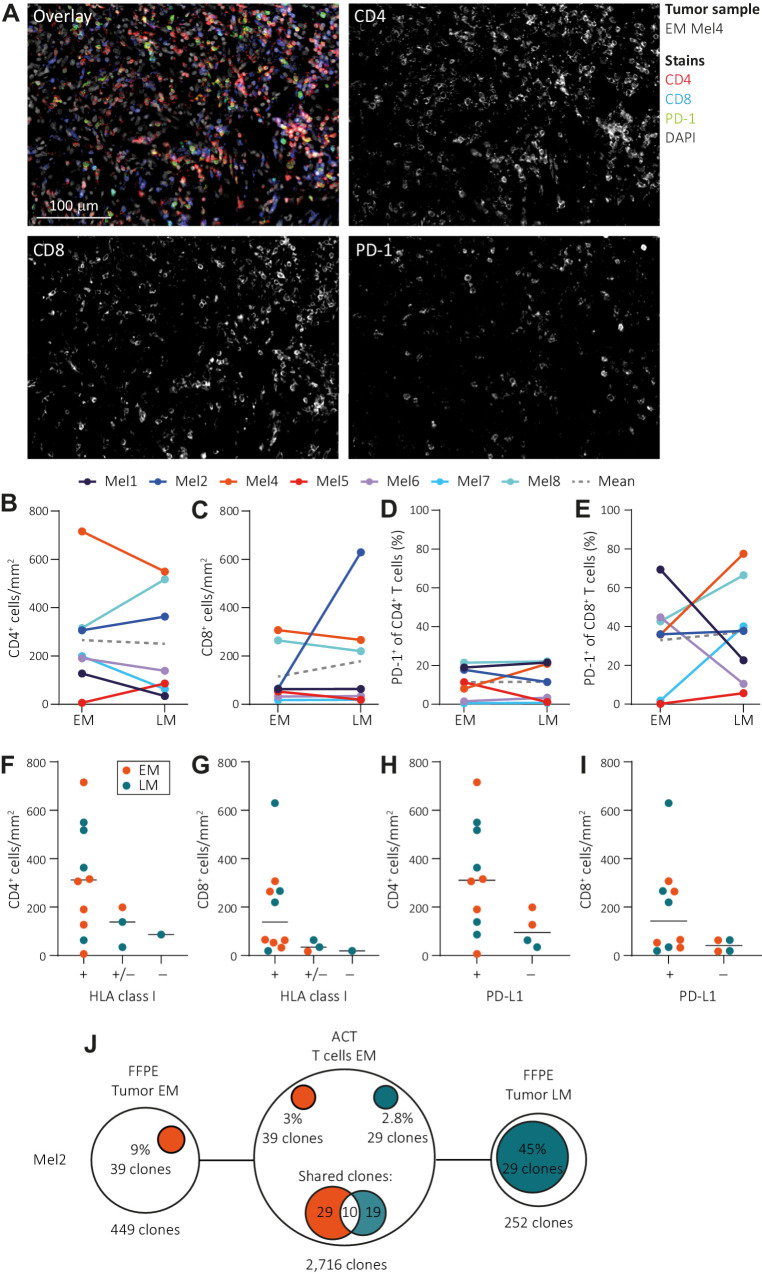
Results: We observed similar T-cell infiltration in paired early and later metastatic (LM) lesions. Although elements of the antigen-presenting machinery were affected in some LM lesions, both the early and later metastasis-derived cell lines were recognized by autologous T cells. At the genomic level, the (neo)antigen landscape was dynamic, but the (neo)antigen load was stable between paired lesions.

Conclusions: Our findings indicate that subsequently isolated tumors from patients with late-stage melanoma retain sufficient antigen-presenting capacity, T-cell infiltration, and a stable (neo)antigen load, allowing recognition of tumor cells by T cells. This indicates a continuous availability of T-cell targets in metastases occurring at different time points and supports further exploration of (neo)antigen-specific T-cell-based therapeutic approaches for advanced melanoma.


Figures

Figure 1. Clinical information of the melanoma patient cohort. Schematic overview of the clinical timeline for eight patients with melanoma, spanning from the diagnosis of the primary tumor until the time of article writing or death. The figure depicts the studied tumor lesions (shown inside the bar in orange and green) and therapeutic regimens (displayed above the bars in diverse colors), accompanied by disease status, indicated by white and light or dark gray shading.
Figure 1.
Clinical information of the melanoma patient cohort. Schematic overview of the clinical timeline for eight patients with melanoma, spanning from the diagnosis of the primary tumor until the time of article writing or death. The figure depicts the studied tumor lesions (shown inside the bar in orange and green) and therapeutic regimens (displayed above the bars in diverse colors), accompanied by disease status, indicated by white and light or dark gray shading.
Figure 2. T-cell infiltration in EM and LM lesions. A, A representative tissue section of EM Mel4 is shown using multispectral fluorescent imaging. The overlay image displays combined immunodetection of CD4 (red), CD8 (blue), PD-1 (green), and DAPI (white; top left), whereas individual immunodetections are shown in the remaining panels in black and white images. B–E, Quantification of T-cell infiltrate. The number of cells per mm2 of tissue is represented by dots, with lines connecting the EM and LM lesions of each patient. The average cell numbers are indicated by dashed lines. The quantified data include the number of infiltrating CD4+ T cells (B), number of CD8+ T cells (C), and the percentage of PD-1+ cells among CD4+ (D) and CD8+ T cells (E). The Wilcoxon matched-pairs signed rank test did not reveal significant differences between EM and LM samples for the datasets presented in B–E. F–I, CD4+ (F and H) and CD8+ (G and I) T-cell infiltrate is shown in relation to positive (i.e., scored strongly positive or weak for all 3 markers), intermediate (i.e., at least one marker scored positive and one or two negative or heterogeneous), and a lack of HLA class I expression (F and G), and in relation to positive or negative PD-L1 expression (H and I) as determined by IHC (Table 1). No significant differences were observed using Kruskal–Wallis and Mann–Whitney U tests, respectively. J, The number of unique T-cell receptors is depicted using semi-proportional circles for the indicated samples. The absolute numbers of T-cell receptors are provided below each circle. Orange sub-circles indicate shared clones between the EM-FFPE sample and the ACT product, with the number of shared clones and the corresponding percentage in EM-FFPE and ACT product indicated next to the circles. Green sub-circles represent clones shared between the ACT product and LM-FFPE tissue, along with the associated numbers and percentages present in each of these samples, respectively. The overlapping region in the middle circles indicates the 10 shared clones present in both EM and LM, depicted in white.
Figure 2.
T-cell infiltration in EM and LM lesions. A, A representative tissue section of EM Mel4 is shown using multispectral fluorescent imaging. The overlay image displays combined immunodetection of CD4 (red), CD8 (blue), PD-1 (green), and DAPI (white; top left), whereas individual immunodetections are shown in the remaining panels in black and white images. B–E, Quantification of T-cell infiltrate. The number of cells per mm2 of tissue is represented by dots, with lines connecting the EM and LM lesions of each patient. The average cell numbers are indicated by dashed lines. The quantified data include the number of infiltrating CD4+ T cells (B), number of CD8+ T cells (C), and the percentage of PD-1+ cells among CD4+ (D) and CD8+ T cells (E). The Wilcoxon matched-pairs signed rank test did not reveal significant differences between EM and LM samples for the datasets presented in B–E. F–I, CD4+ (F and H) and CD8+ (G and I) T-cell infiltrate is shown in relation to positive (i.e., scored strongly positive or weak for all 3 markers), intermediate (i.e., at least one marker scored positive and one or two negative or heterogeneous), and a lack of HLA class I expression (F and G), and in relation to positive or negative PD-L1 expression (H and I) as determined by IHC (Table 1). No significant differences were observed using Kruskal–Wallis and Mann–Whitney U tests, respectively. J, The number of unique T-cell receptors is depicted using semi-proportional circles for the indicated samples. The absolute numbers of T-cell receptors are provided below each circle. Orange sub-circles indicate shared clones between the EM-FFPE sample and the ACT product, with the number of shared clones and the corresponding percentage in EM-FFPE and ACT product indicated next to the circles. Green sub-circles represent clones shared between the ACT product and LM-FFPE tissue, along with the associated numbers and percentages present in each of these samples, respectively. The overlapping region in the middle circles indicates the 10 shared clones present in both EM and LM, depicted in white.
Figure 3. Tumor-directed T-cell recognition. T-cell recognition was assessed for each patient by testing the EM and LM corresponding T-cell products for recognition of EM or LM-derived tumor cell lines. The EM or LM T-cell products were either TIL isolated from the corresponding tumor tissue or MLTC T cells obtained after repeated stimulation of autologous PBMC with the corresponding EM or LM cell lines, respectively. The stimuli included medium control, EM and LM cell lines preincubated with (+) or without (−) IFNγ, CD3/28 beads (positive control), and SEB (positive control for Mel5). IFNγ production (or CCL4 for Mel6) was measured as a read-out for recognition. The values are depicted as follows: No tumor recognition (defined as less than the medium background plus 2× standard deviation, in gray), tumor recognition (between 1 and 10 times above background, light green), and strong tumor recognition (>10 times above background, dark green). The mean ± standard deviation of at least two independent experiments is shown and all green values are significantly higher than the negative control (P < 0.05; Student t test).
Figure 3.
Tumor-directed T-cell recognition. T-cell recognition was assessed for each patient by testing the EM and LM corresponding T-cell products for recognition of EM or LM-derived tumor cell lines. The EM or LM T-cell products were either TIL isolated from the corresponding tumor tissue or MLTC T cells obtained after repeated stimulation of autologous PBMC with the corresponding EM or LM cell lines, respectively. The stimuli included medium control, EM and LM cell lines preincubated with (+) or without (−) IFNγ, CD3/28 beads (positive control), and SEB (positive control for Mel5). IFNγ production (or CCL4 for Mel6) was measured as a read-out for recognition. The values are depicted as follows: No tumor recognition (defined as less than the medium background plus 2× standard deviation, in gray), tumor recognition (between 1 and 10 times above background, light green), and strong tumor recognition (>10 times above background, dark green). The mean ± standard deviation of at least two independent experiments is shown and all green values are significantly higher than the negative control (P < 0.05; Student t test).
Figure 4. Neoantigen landscape in metastatic melanoma. A, The total number of non-synonymous, transcribed mutations (i.e., on both DNA as well as RNA level) present in the EM and LM lesions is shown. The dots represent the sum of lesion-specific and shared mutations, and the lines connect EM and LM lesions of individual patients. Mean values are connected by the dashed line. B, The proportion (%) of EM-specific (orange) or LM-specific (green) mutations on the DNA (solid bars) and RNA (hatched bars) levels, along with their corresponding predicted strong binding peptides shown in the same colors in the lower bar. The white parts of the bars represent the proportion of shared mutations (at DNA and RNA levels) and corresponding predicted strong binding peptides. C, Visualization of the predicted strong binding peptides corresponding to the sum of lesion-specific and shared mutations as shown in A, are depicted in a similar way for EM and LM lesions of individual patients. D, The RNA expression of the mutated genes, in transcripts per million (TPM) plus one, is depicted for corresponding HLA class I neoantigen-derived peptides that were eluted from Mel2-, Mel3-, and Mel5-derived tumor cell lines, in the left, middle, and right, respectively. The gene expression is shown for EM and LM of each patient and the different colors of the bars represent peptides that were detected in the cell line eluate. Gray and white bars indicate that peptides were not detected or not determined, respectively. E, RNA expression of the mutations, in transcripts per million (TPM), is depicted by dots and only shown if a corresponding peptide is eluted from either the EM or LM of patient Mel2 (light blue), Mel3 (green), or Mel5 (orange). The lesions from which peptides were eluted are filled with patient-specific colors, and lines connect the EM (left) and LM (right) lesions. For Mel5 LM (gray symbols) no ligandome analysis was performed as the corresponding cell line lost HLA class I expression. The table below provides information on the patient and lesion from which peptides were eluted (+), not eluted (−), or not determined (nd).
Figure 4.
Neoantigen landscape in metastatic melanoma. A, The total number of non-synonymous, transcribed mutations (i.e., on both DNA as well as RNA level) present in the EM and LM lesions is shown. The dots represent the sum of lesion-specific and shared mutations, and the lines connect EM and LM lesions of individual patients. Mean values are connected by the dashed line. B, The proportion (%) of EM-specific (orange) or LM-specific (green) mutations on the DNA (solid bars) and RNA (hatched bars) levels, along with their corresponding predicted strong binding peptides shown in the same colors in the lower bar. The white parts of the bars represent the proportion of shared mutations (at DNA and RNA levels) and corresponding predicted strong binding peptides. C, Visualization of the predicted strong binding peptides corresponding to the sum of lesion-specific and shared mutations as shown in A, are depicted in a similar way for EM and LM lesions of individual patients. D, The RNA expression of the mutated genes, in transcripts per million (TPM) plus one, is depicted for corresponding HLA class I neoantigen-derived peptides that were eluted from Mel2-, Mel3-, and Mel5-derived tumor cell lines, in the left, middle, and right, respectively. The gene expression is shown for EM and LM of each patient and the different colors of the bars represent peptides that were detected in the cell line eluate. Gray and white bars indicate that peptides were not detected or not determined, respectively. E, RNA expression of the mutations, in transcripts per million (TPM), is depicted by dots and only shown if a corresponding peptide is eluted from either the EM or LM of patient Mel2 (light blue), Mel3 (green), or Mel5 (orange). The lesions from which peptides were eluted are filled with patient-specific colors, and lines connect the EM (left) and LM (right) lesions. For Mel5 LM (gray symbols) no ligandome analysis was performed as the corresponding cell line lost HLA class I expression. The table below provides information on the patient and lesion from which peptides were eluted (+), not eluted (−), or not determined (nd).

References

    1. Hodi FS, O'Day SJ, McDermott DF, Weber RW, Sosman JA, Haanen JB, et al. Improved survival with ipilimumab in patients with metastatic melanoma. N Engl J Med 2010;363:711–23. - PMC - PubMed
    1. Larkin J, Chiarion-Sileni V, Gonzalez R, Grob JJ, Rutkowski P, Lao CD, et al. Five-year survival with combined nivolumab and ipilimumab in advanced melanoma. N Engl J Med 2019;381:1535–46. - PubMed
    1. Wolchok JD, Chiarion-Sileni V, Gonzalez R, Grob JJ, Rutkowski P, Lao CD, et al. Long-term outcomes with nivolumab plus ipilimumab or nivolumab alone versus ipilimumab in patients with advanced melanoma. J Clin Oncol 2022;40:127–37. - PMC - PubMed
    1. Serra-Bellver P, Versluis JM, Oberoi HK, Zhou C, Slattery TD, Khan Y, et al. Real-world outcomes with ipilimumab and nivolumab in advanced melanoma: a multicentre retrospective study. Eur J Cancer 2022;176:121–32. - PubMed
    1. Sarnaik AA, Hamid O, Khushalani NI, Lewis KD, Medina T, Kluger HM, et al. Lifileucel, a tumor-infiltrating lymphocyte therapy, in metastatic melanoma. J Clin Oncol 2021;39:2656–66. - PMC - PubMed