. 2023 Aug 29;42(8):112930.
doi: 10.1016/j.celrep.2023.112930. Epub 2023 Aug 4.

Topography of mutational signatures in human cancer

Affiliations

Topography of mutational signatures in human cancer

Burçak Otlu et al. Cell Rep. .

Abstract

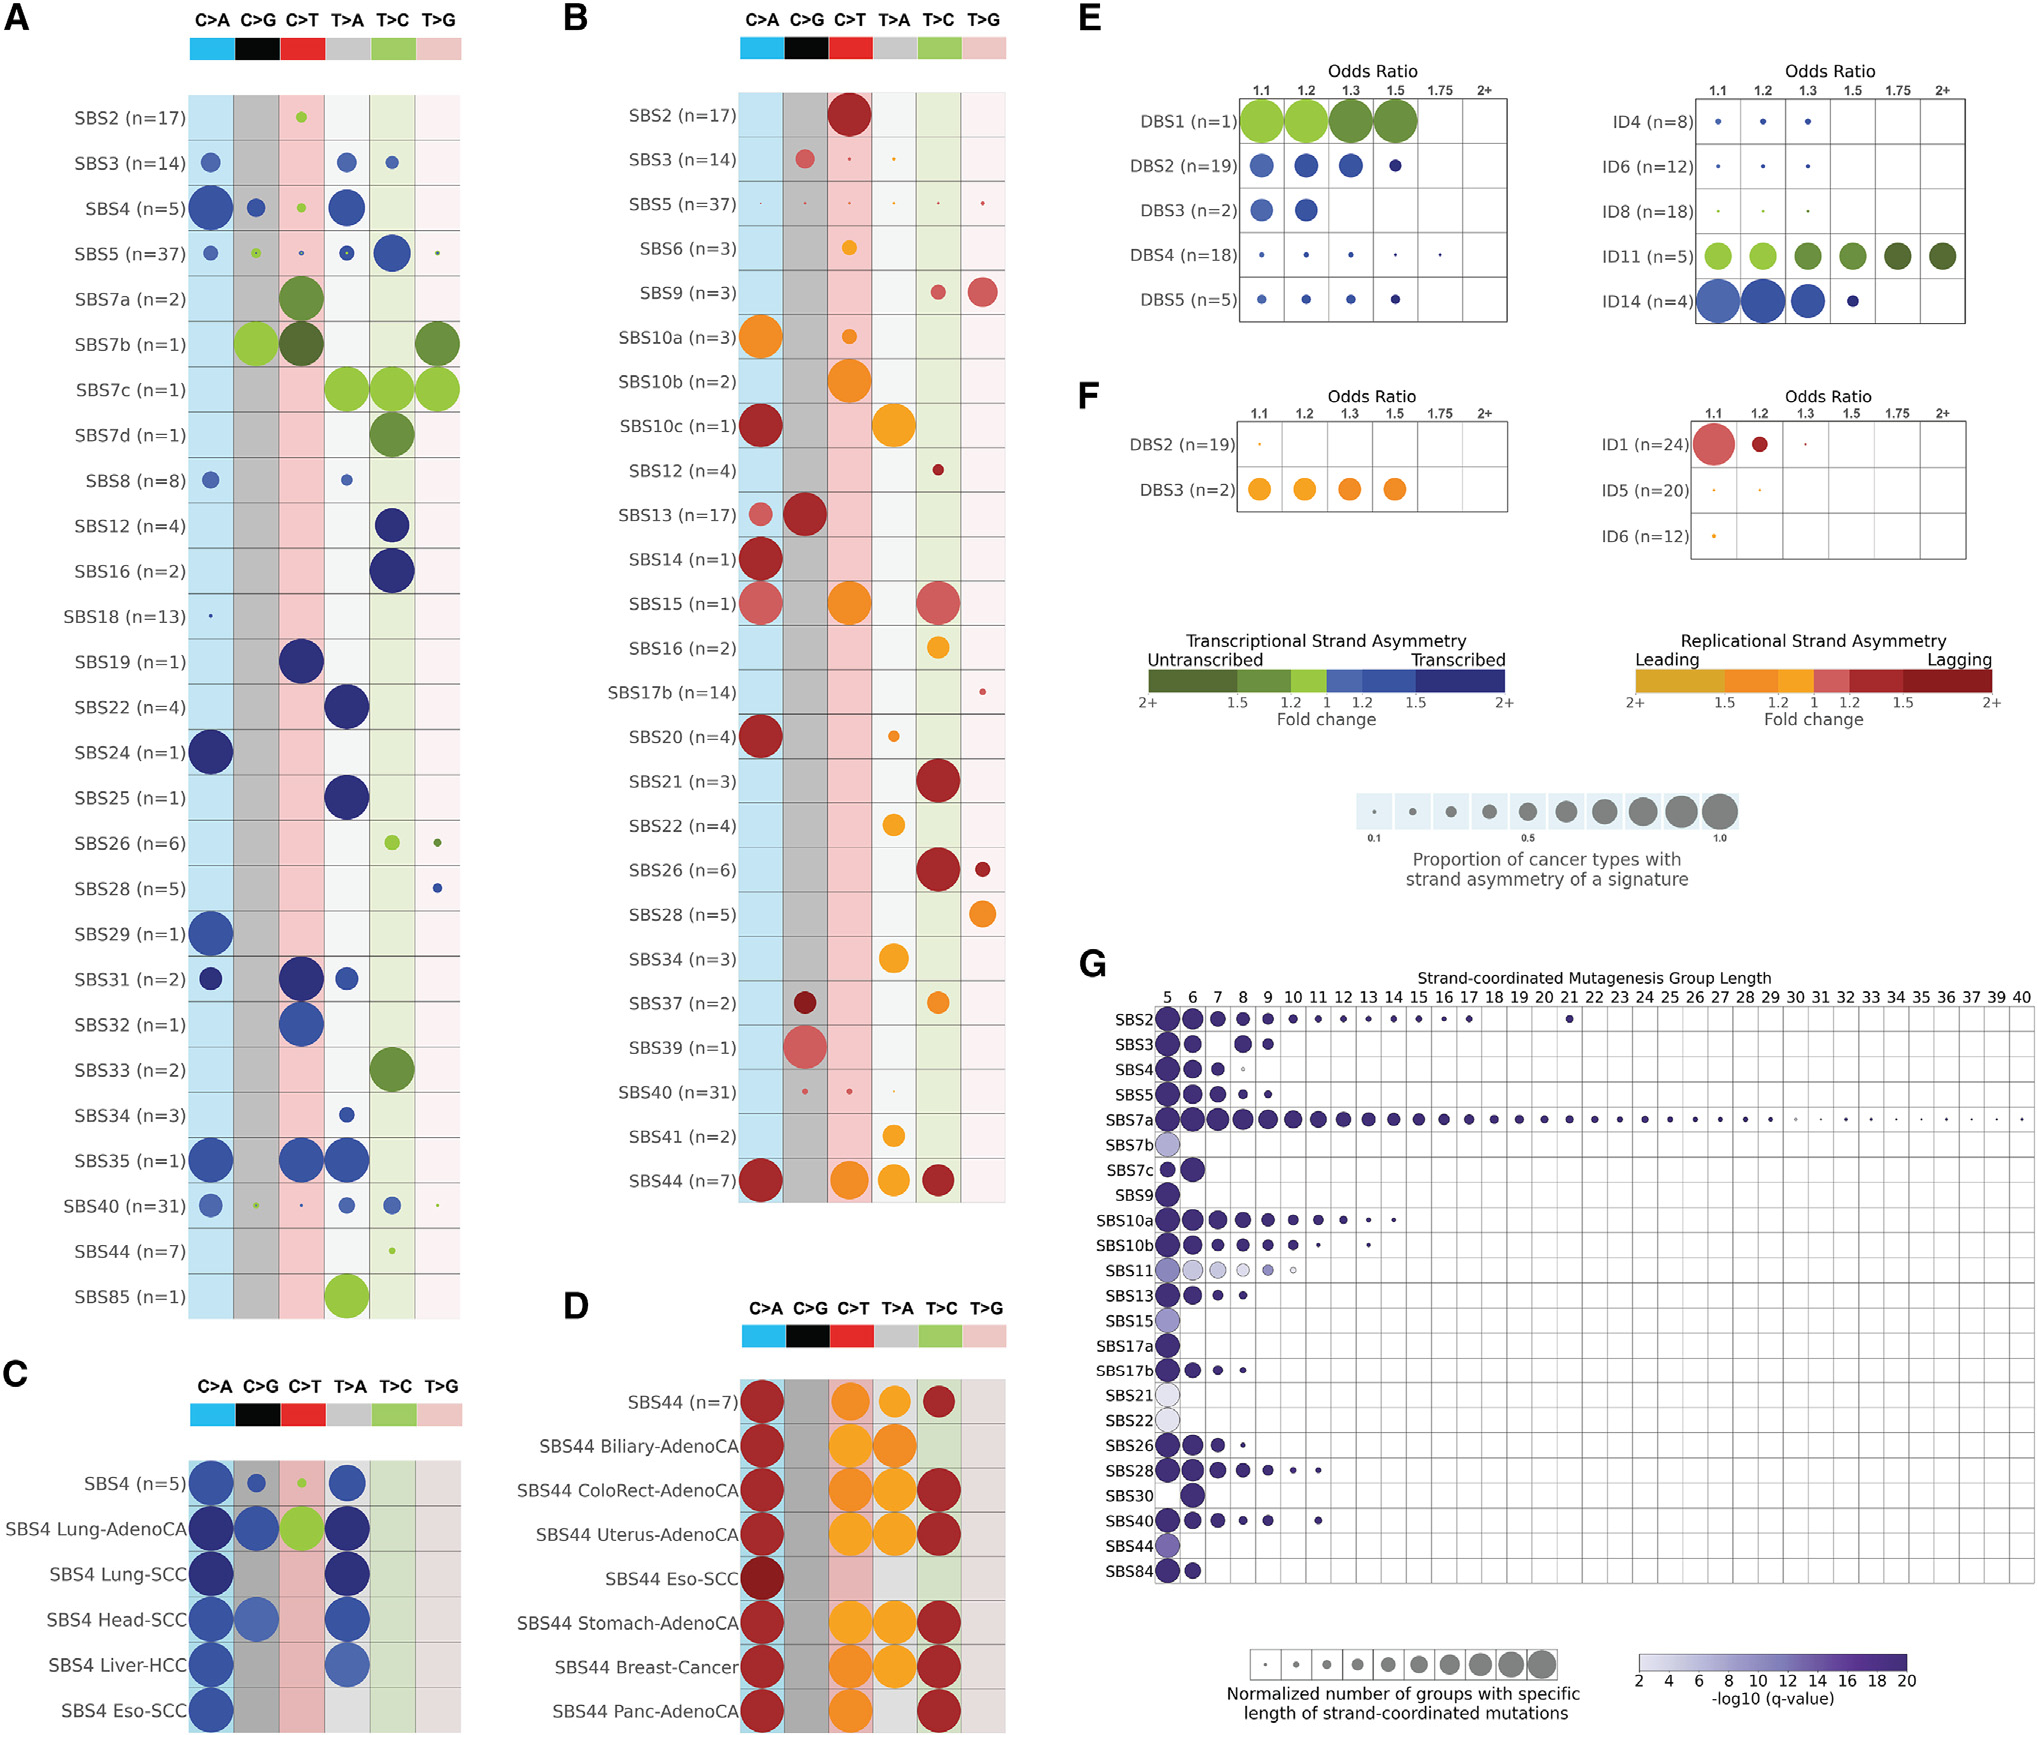
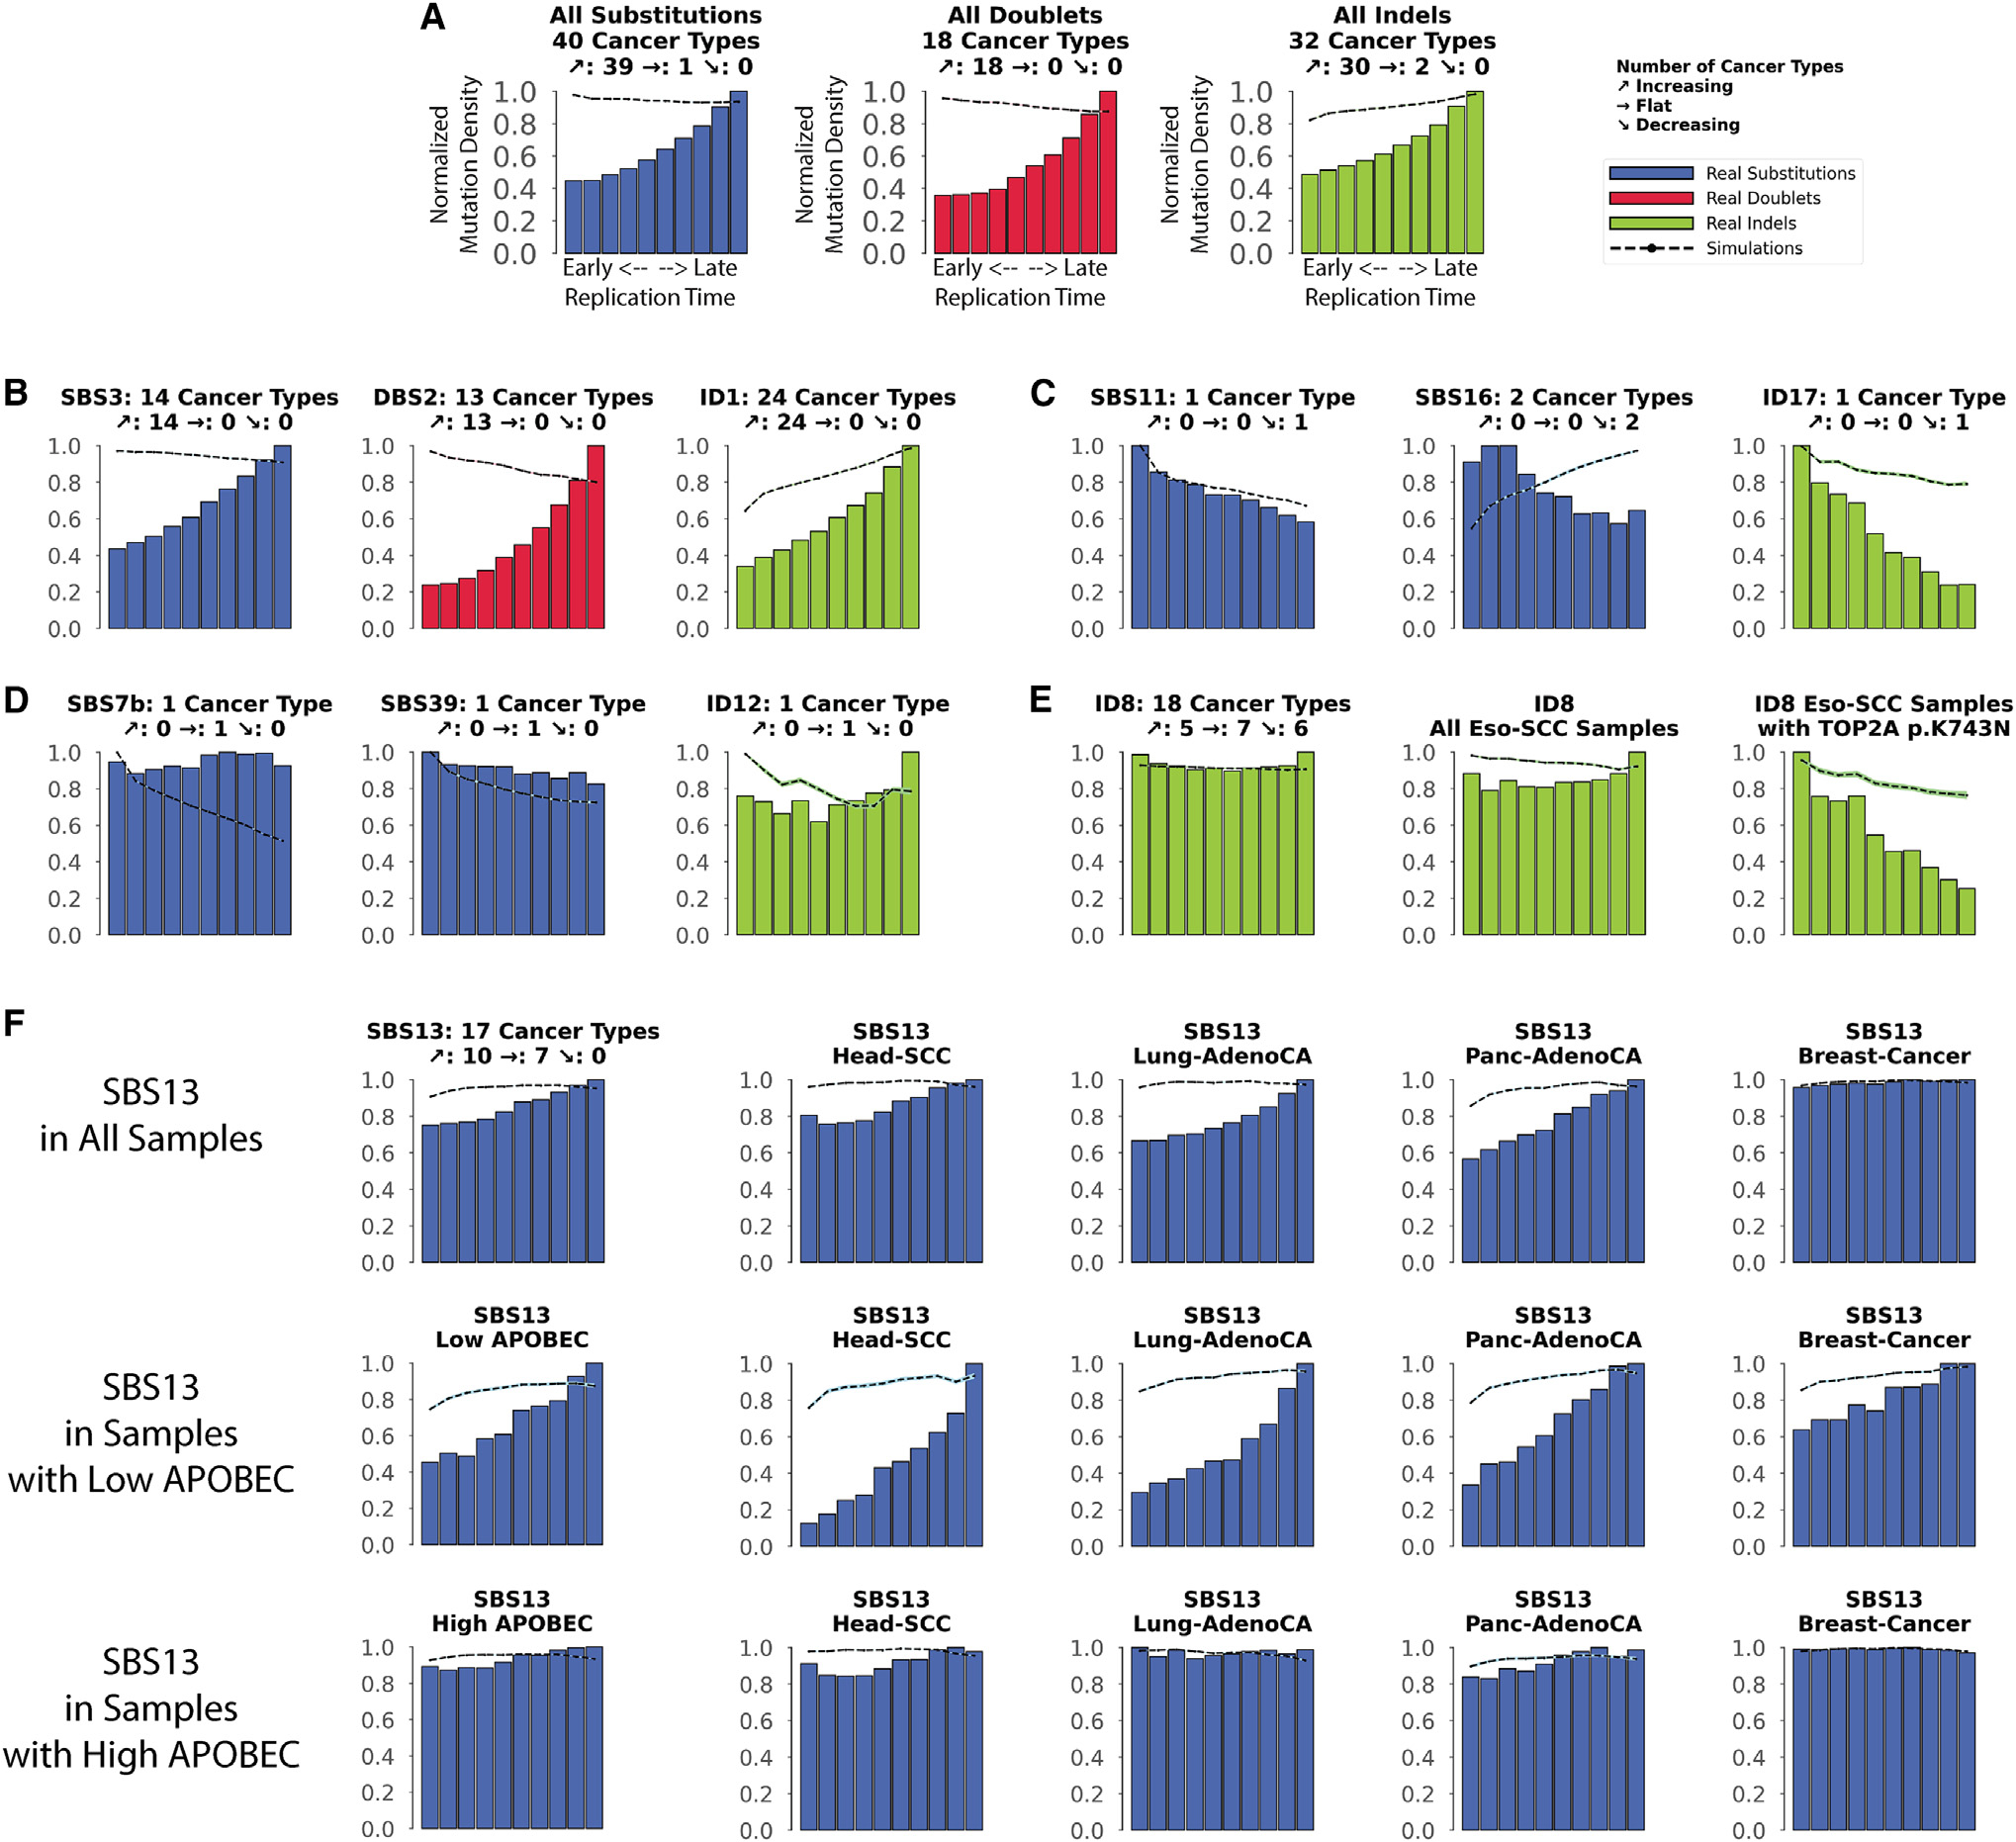
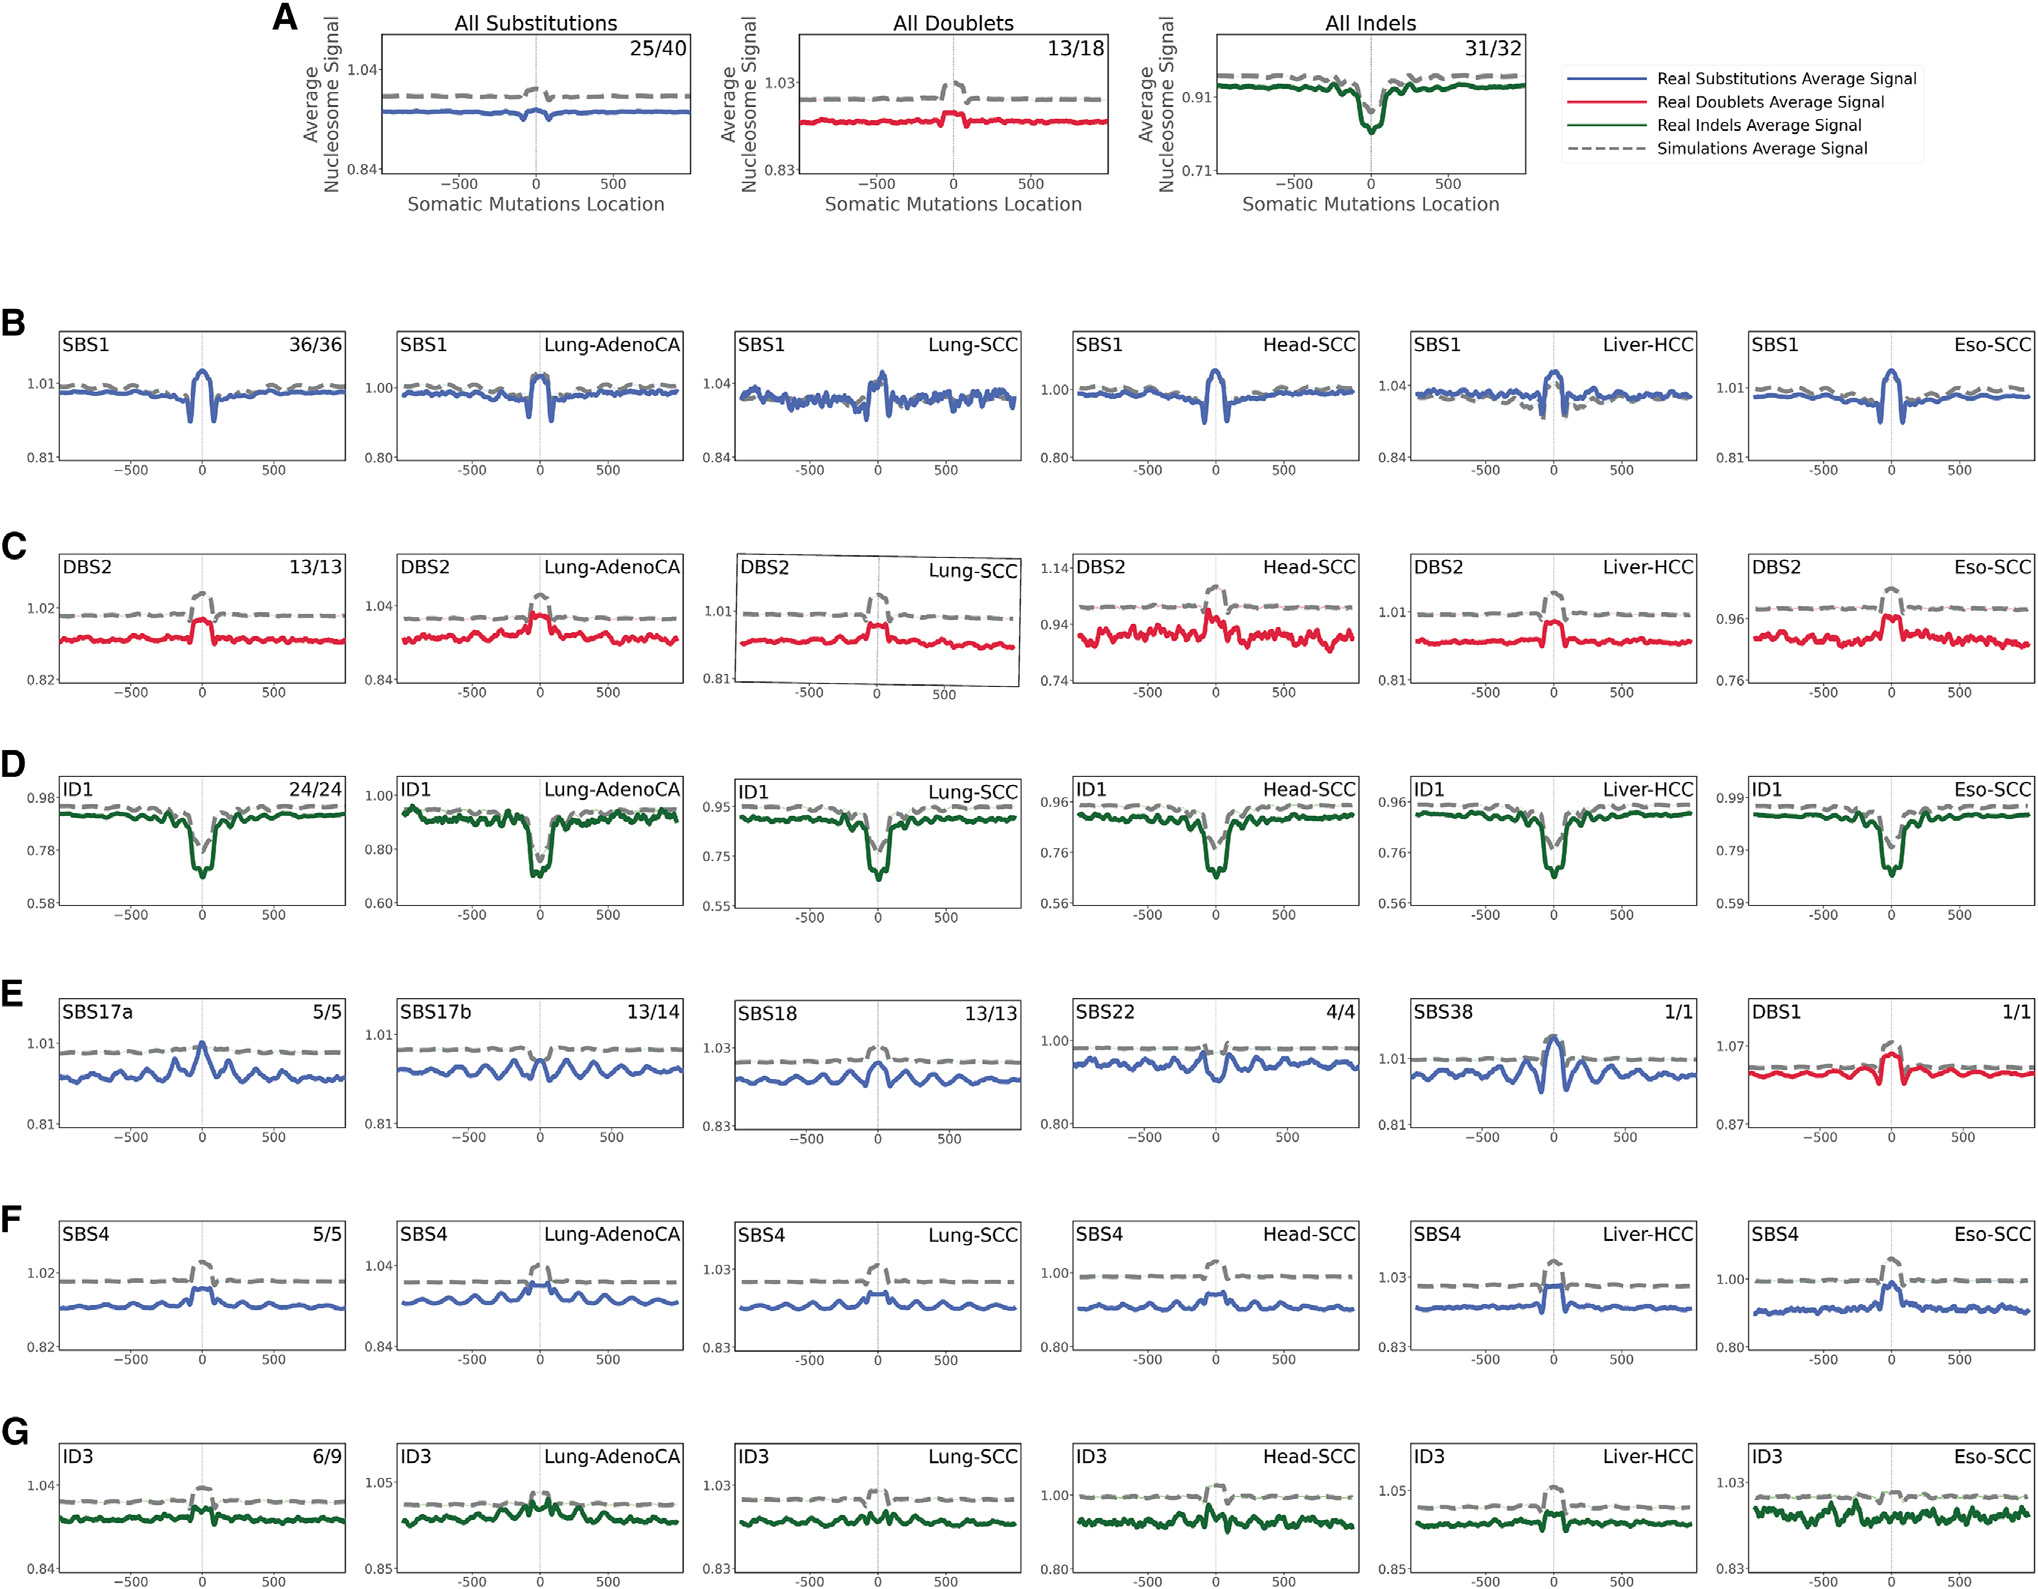
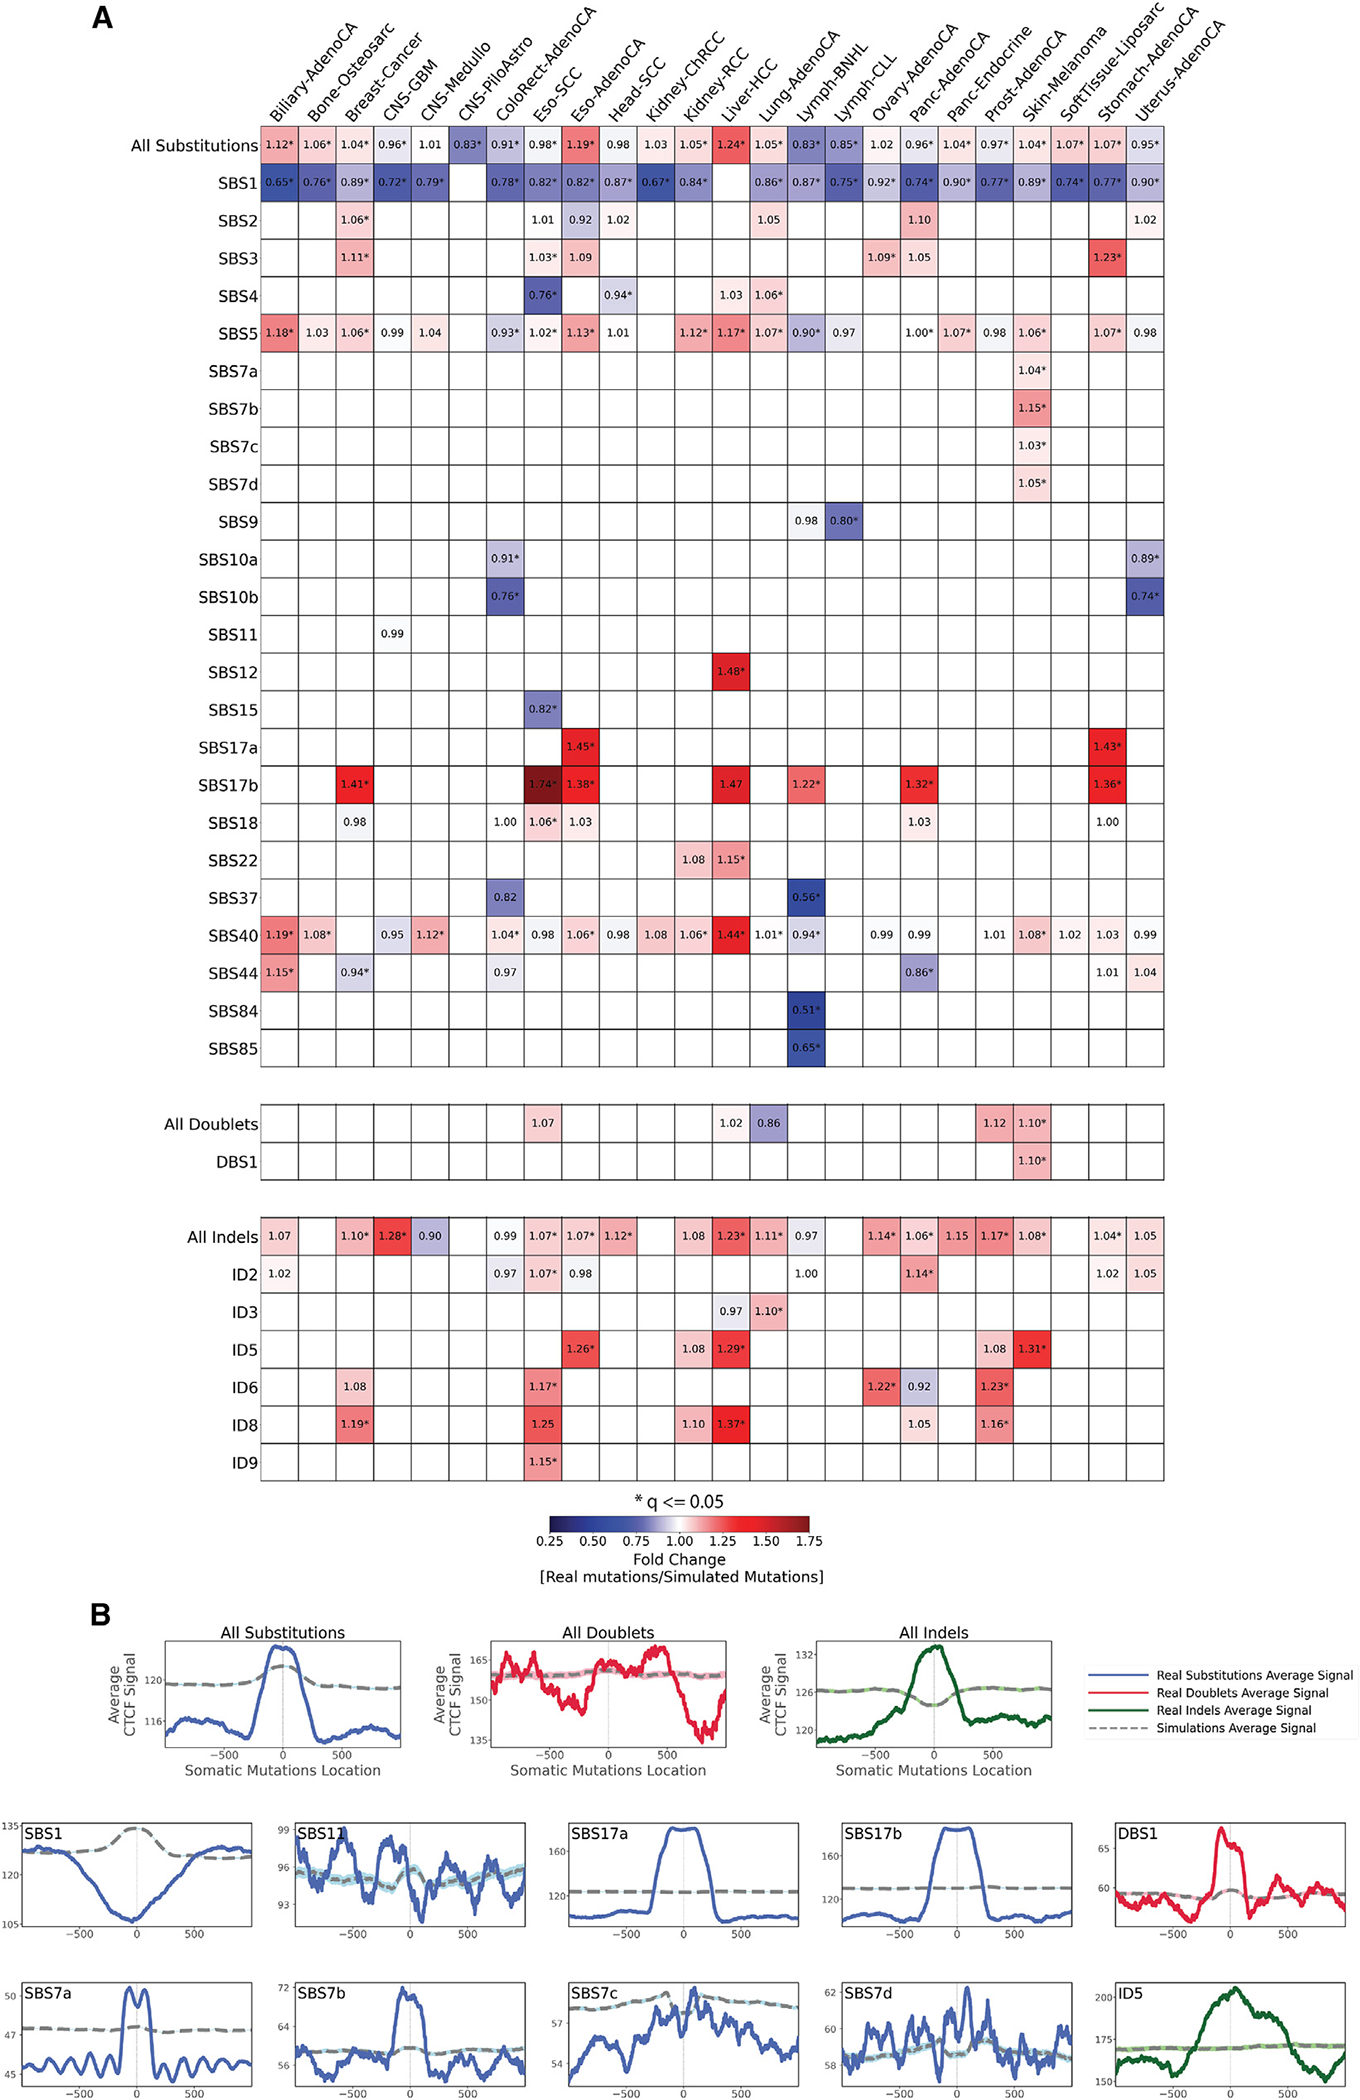
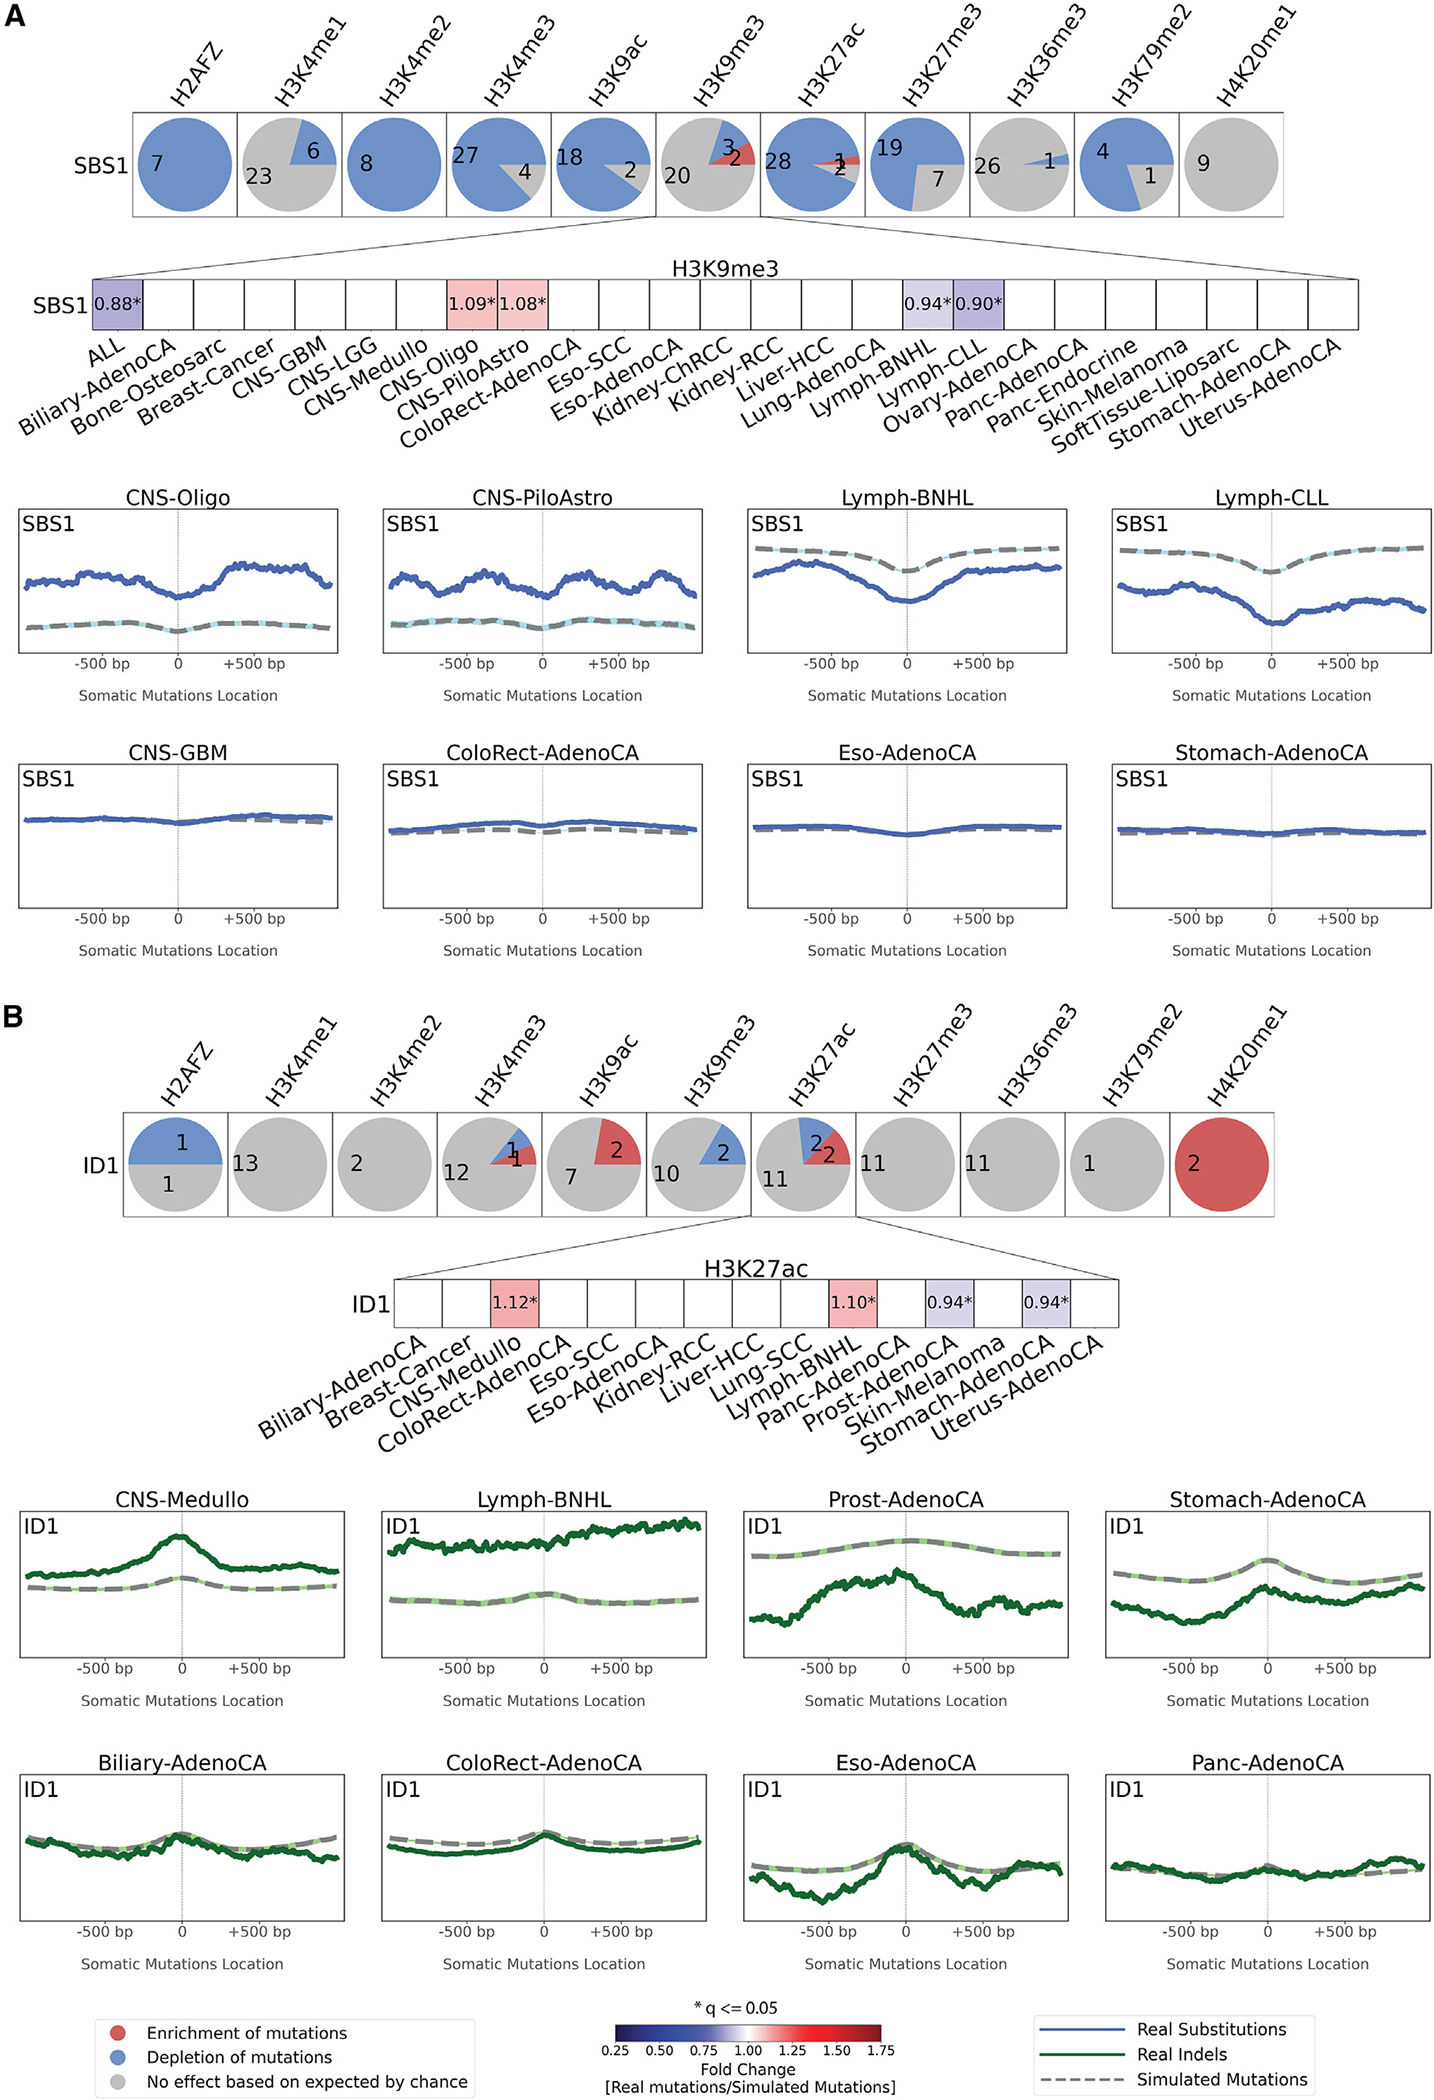
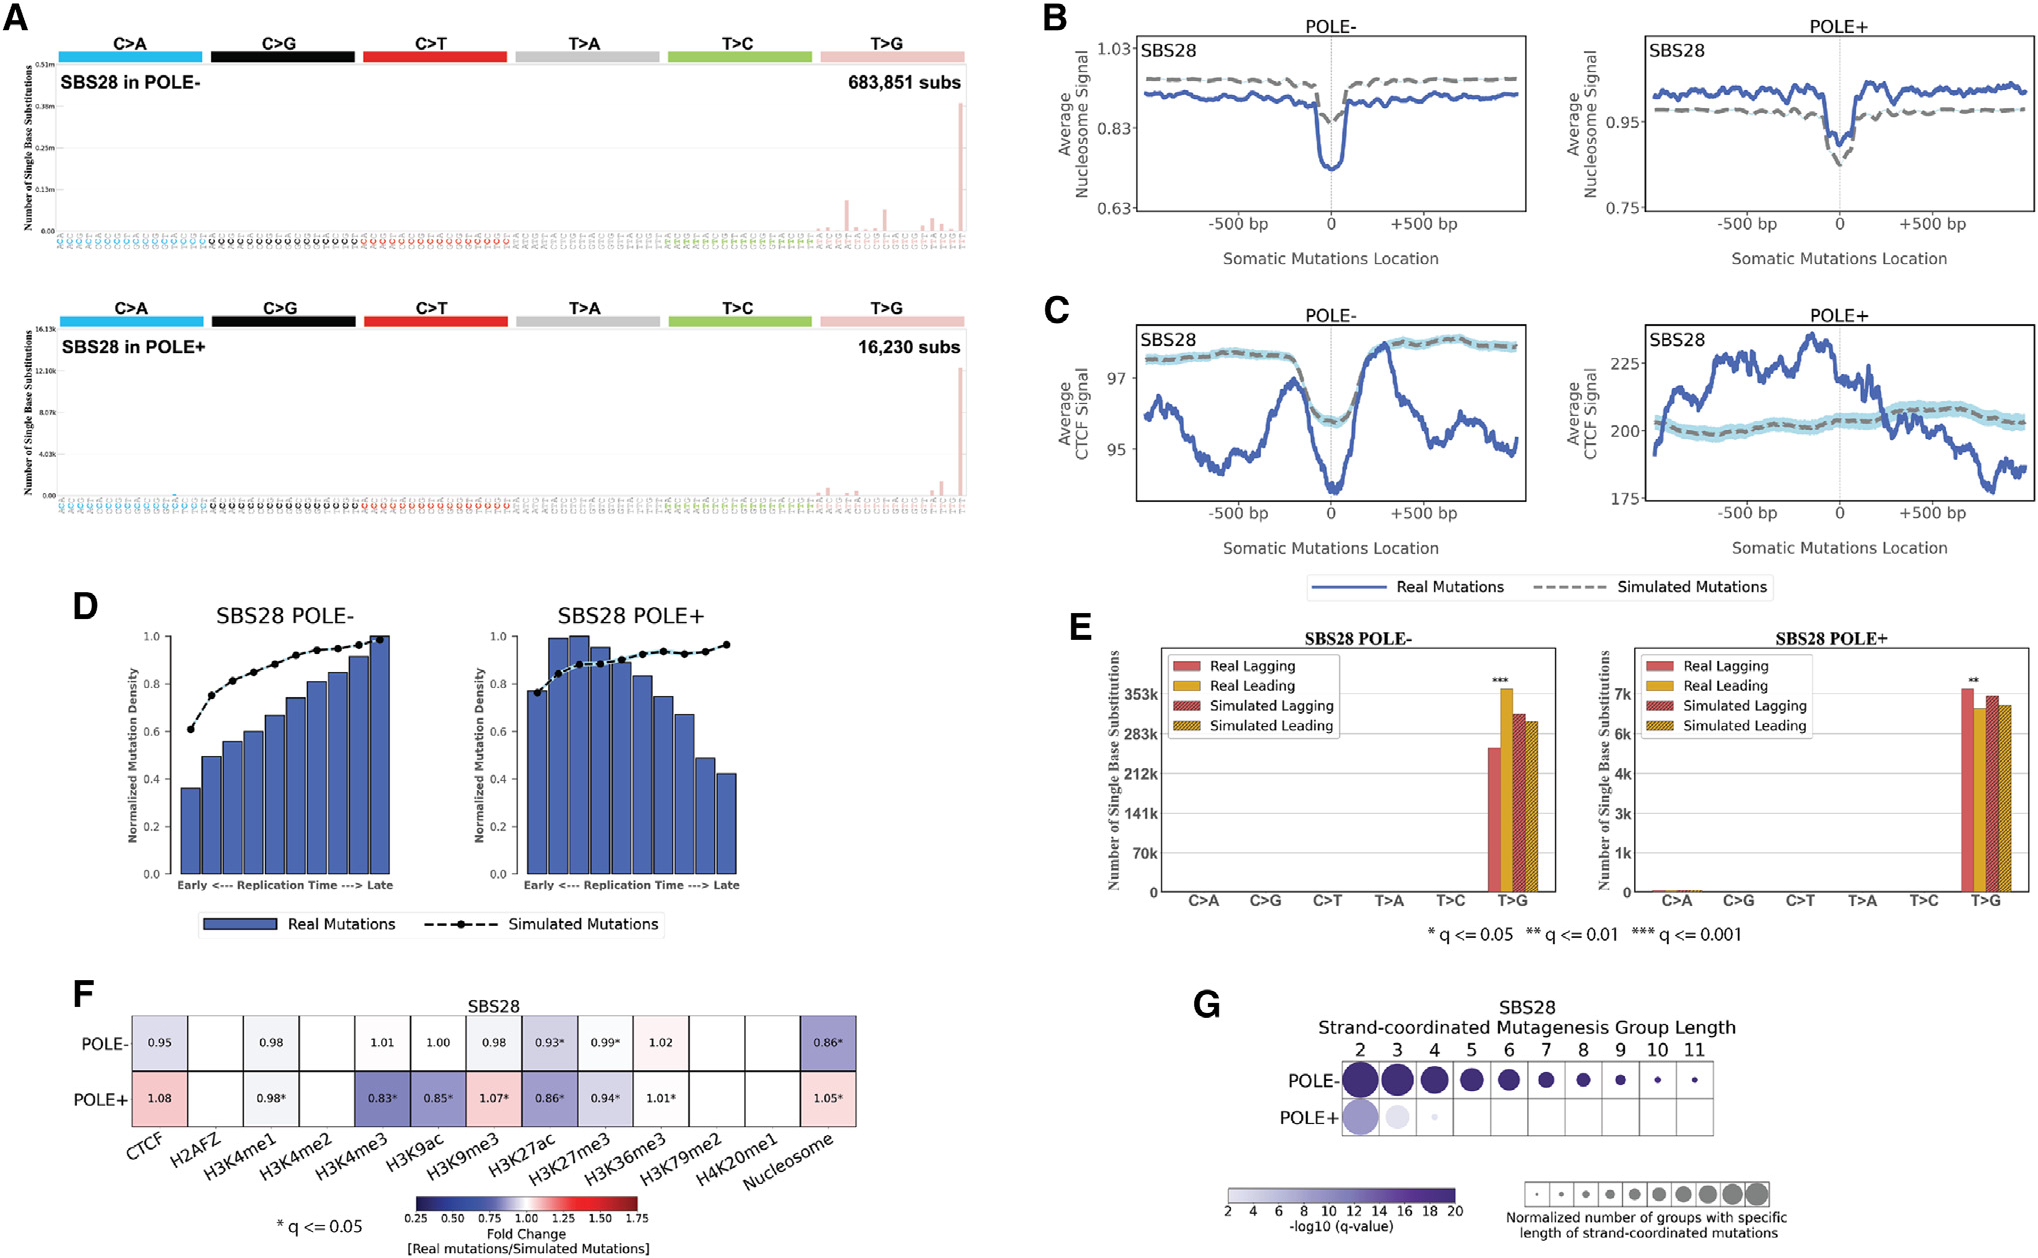
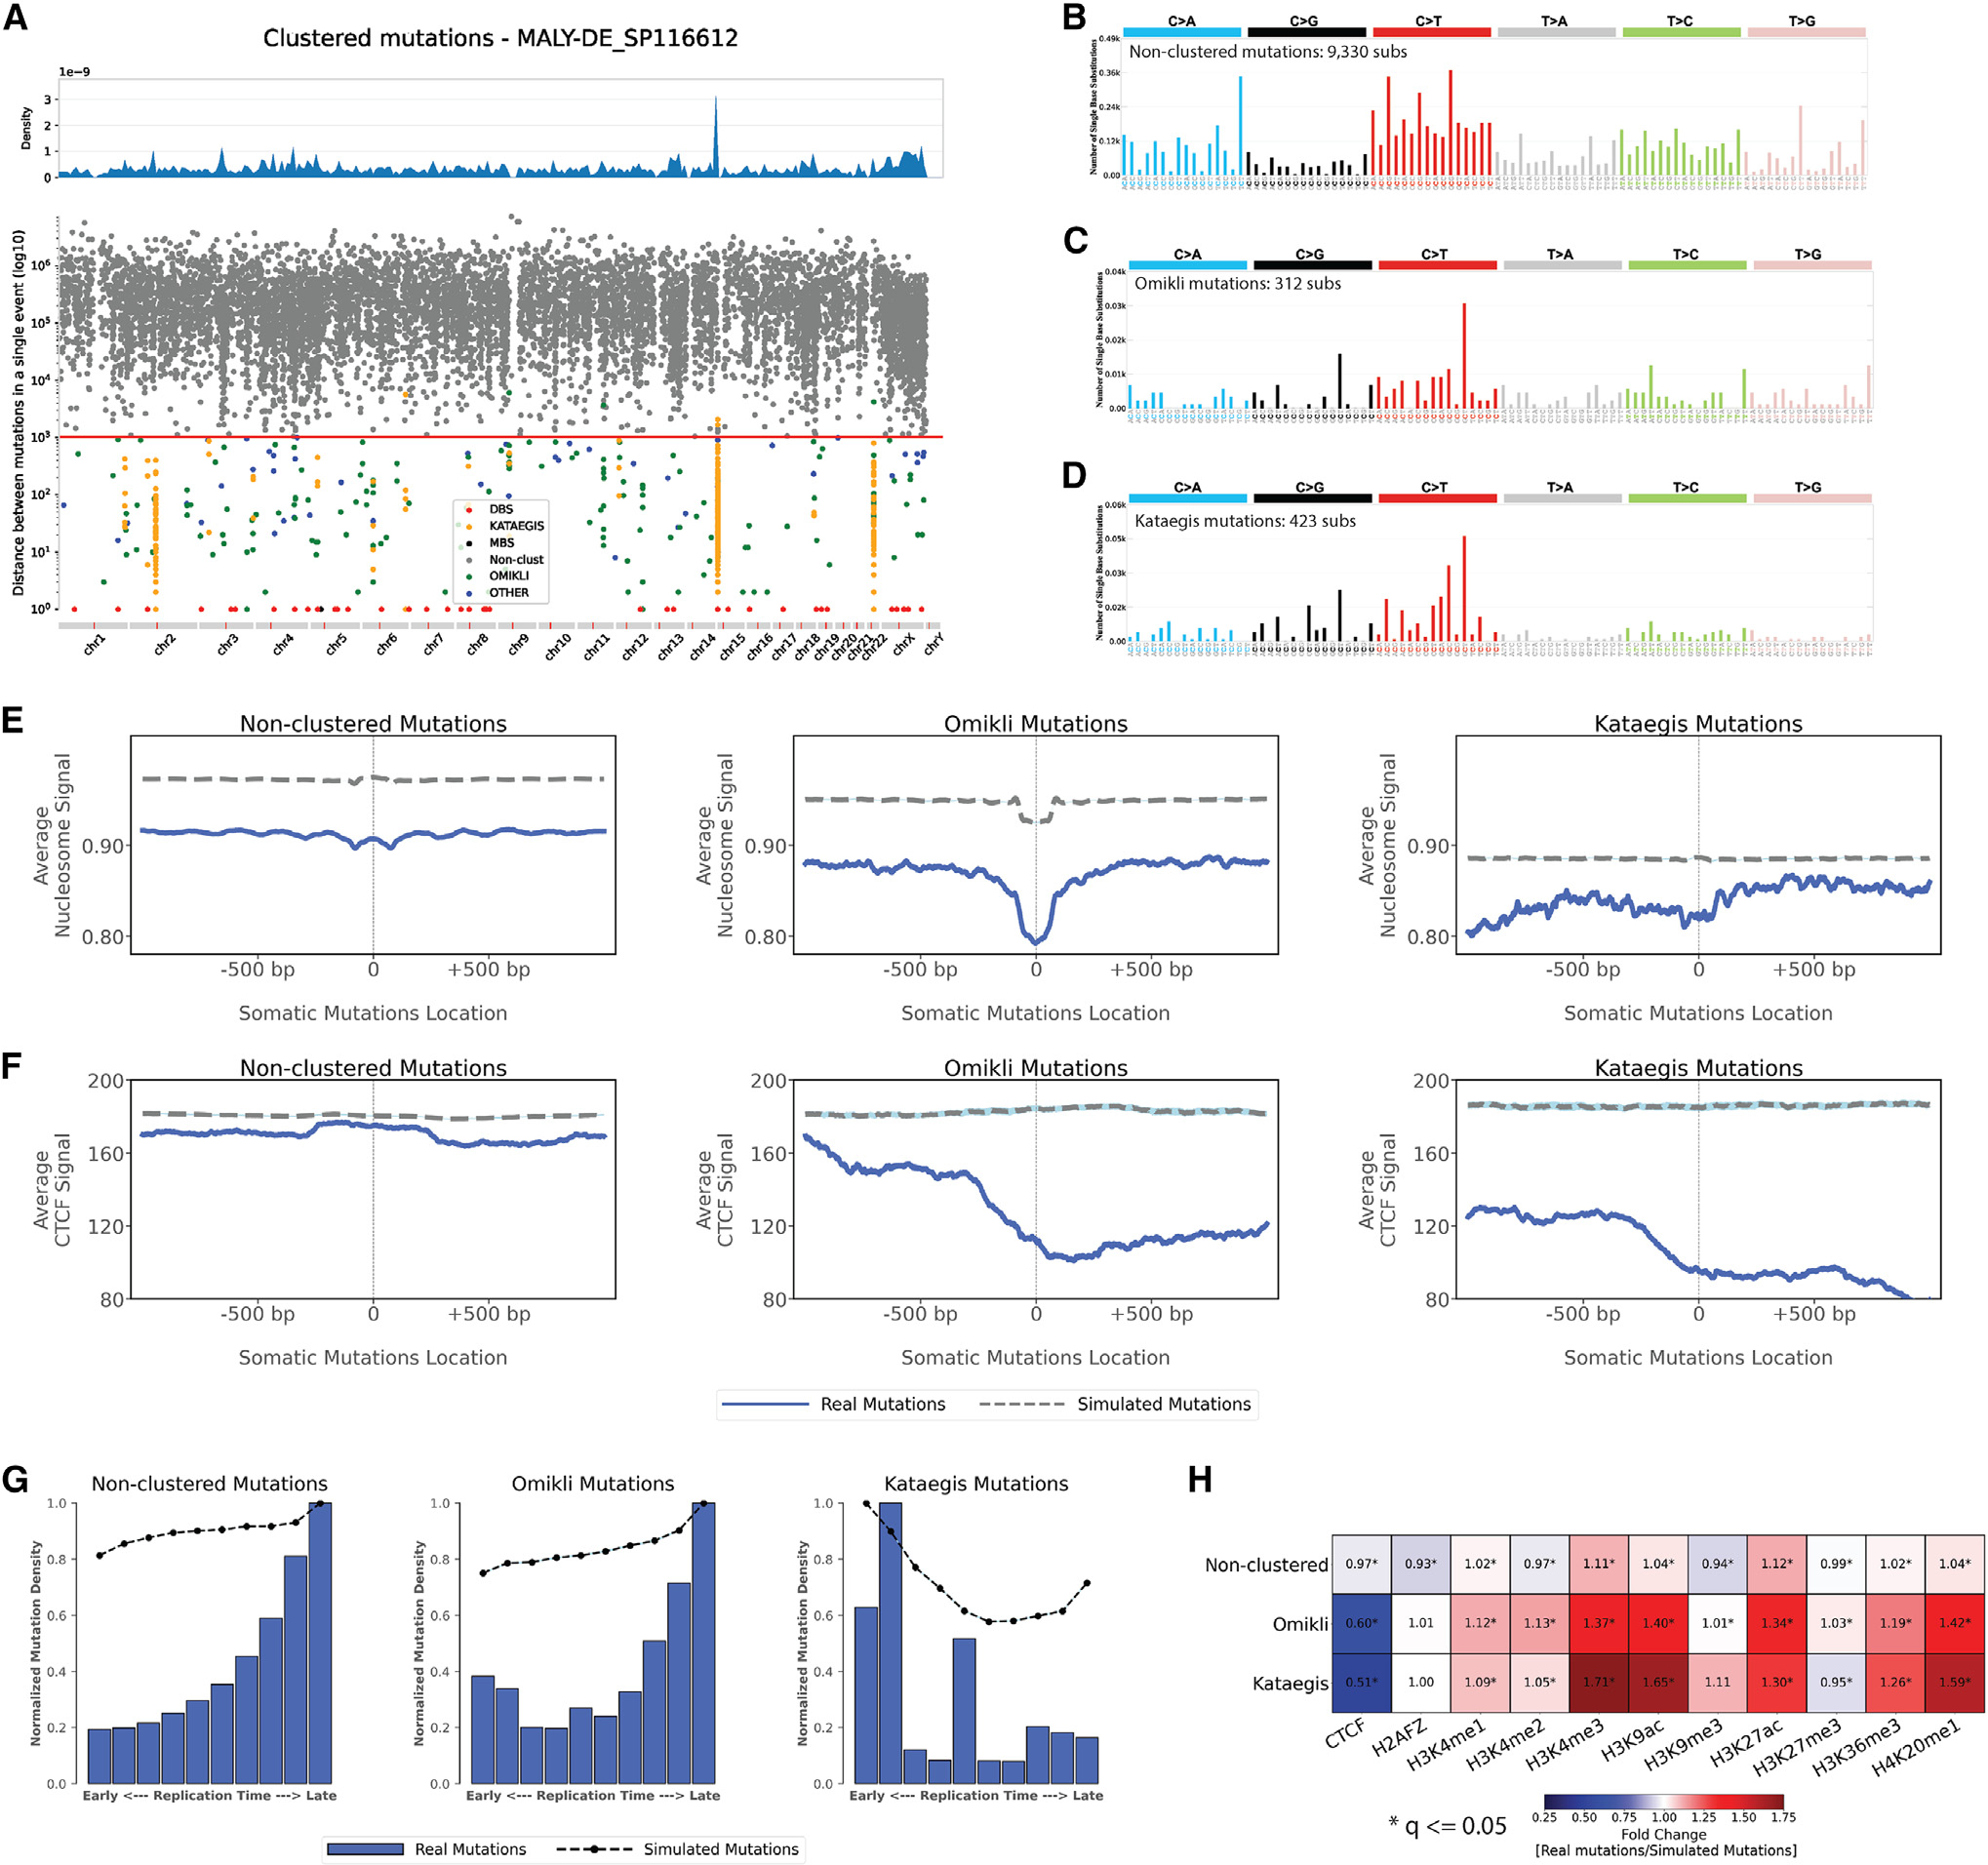
The somatic mutations found in a cancer genome are imprinted by different mutational processes. Each process exhibits a characteristic mutational signature, which can be affected by the genome architecture. However, the interplay between mutational signatures and topographical genomic features has not been extensively explored. Here, we integrate mutations from 5,120 whole-genome-sequenced tumors from 40 cancer types with 516 topographical features from ENCODE to evaluate the effect of nucleosome occupancy, histone modifications, CTCF binding, replication timing, and transcription/replication strand asymmetries on the cancer-specific accumulation of mutations from distinct mutagenic processes. Most mutational signatures are affected by topographical features, with signatures of related etiologies being similarly affected. Certain signatures exhibit periodic behaviors or cancer-type-specific enrichments/depletions near topographical features, revealing further information about the processes that imprinted them. Our findings, disseminated via the COSMIC (Catalog of Somatic Mutations in Cancer) signatures database, provide a comprehensive online resource for exploring the interactions between mutational signatures and topographical features across human cancer.

Keywords: CP: Cancer; CP: Genomics; cancer genomics; genome topography; mutational signatures; somatic mutations.


Conflict of interest statement

Declaration of interests L.B.A. is a compensated consultant and has equity interest in io9, LLC, and Genome Insight. His spouse is an employee of Biotheranostics, Inc. L.B.A. is also an inventor of US patent 10,776,718 for source identification by non-negative matrix factorization. E.N.B. and L.B.A. declare US provisional applications with serial numbers 63/289,601, 63/269,033, and 63/483,237. L.B.A. also declares US provisional applications with serial numbers 63/366,392, 63/412,835, and 63/492,348.

Figures

Figure 1.
Figure 1.. Strand asymmetries and strand-coordinated mutagenesis
(A) Transcription strand asymmetries of signatures of single-base substitutions (SBSs). Rows represent the signatures, where n reflects the number of cancer types in which each signature was found. Columns display the six substitution subtypes based on the mutated pyrimidine base: C>A, C>G, C>T, T>A, T>C, and T>G. SBS signatures with transcription strand asymmetries on the transcribed and/or the untranscribed strands with adjusted p values ≤ 0.05 (Fisher’s exact test corrected for multiple testing using Benjamini-Hochberg) are shown in circles with blue and green colors, respectively. The color intensity reflects the odds ratio between the ratio of real mutations and the ratio of simulated mutations, where each ratio is calculated using the number of mutations on the transcribed strand and the number of mutations on the untranscribed strand. Only odds ratios above 1.10 are shown. Circle sizes reflect the proportion of cancer types exhibiting a signature with specific transcription strand asymmetry. (B) Replication strand asymmetries of SBS signatures. Rows represent the signatures, where n reflects the number of cancer types in which each signature was found. Columns display the six substitution subtypes based on the mutated pyrimidine base: C>A, C>G, C>T, T>A, T>C, and T>G. SBS signatures with replicational strand asymmetries on the lagging strand or on the leading strand with adjusted p values ≤ 0.05 (Fisher’s exact test corrected for multiple testing using Benjamini-Hochberg) are shown in circles with red and yellow colors, respectively. The color intensity reflects the odds ratio between the ratio of real mutations and the ratio of simulated mutations, where each ratio is calculated using the number of mutations on the lagging strand and the number of mutations on the leading strand. Only odds ratios above 1.10 are shown. Circle sizes reflect the proportion of cancer types exhibiting a signature with specific replication strand asymmetry. (C) Transcription strand asymmetries of signature SBS4 across cancer types. Data are presented in a format similar to the one in (A). (D) Replication strand asymmetries of signature SBS44 across cancer types. Data are presented in a format similar to the one in (B). (E) Transcription strand asymmetries of signatures of doublet-base substitutions (DBSs) and of small insertions or deletions (IDs). Data are presented in a format similar to the one in (A). (F) Replication strand asymmetries of DBS and ID mutational signatures. Data are presented in a format similar to the one in (B). (G) Strand-coordinated mutagenesis of SBS signatures. Rows represent SBS signatures and columns reflect the lengths, in numbers of consecutive mutations, of strand-coordinated mutagenesis groups. SBS signatures with statistically significant strand-coordinated mutagenesis (adjusted p values ≤ 0.05, z-test corrected for multiple testing using Benjamini-Hochberg) are shown as circles under the respective group length with a minimum length of 5 consecutive mutations. The size of each circle reflects the number of consecutive mutation groups for the specified group length normalized for each signature. The color of each circle reflects the statistical significance of the number of subsequent mutation groups for each group length with respect to simulated mutations. See also Figure S1.
Figure 2.
Figure 2.. Interplay between replication timing and mutational signatures
Replication time data are separated into deciles, with each segment containing exactly 10% of the observed replication time signal (x axes). Normalized mutation densities per decile (y axes) are presented for early (left) to late (right) replication domains. Real data for SBS signatures are shown as blue bars, for DBS signatures as red bars, and for small ID signatures as green bars. Simulated somatic mutations are shown as dashed lines. Where applicable, the total number of evaluated cancer types for a particular mutational signature is shown on top of each plot (e.g., 18 cancer types were evaluated for ID8 in E). For each signature, the number of cancer types where the mutation density increases with replication timing is shown next to the slanted up arrow (↗; e.g., 5 cancer types for ID8). Similarly, the number of cancer types where the mutation density decreases with replication timing is shown next to the slanted down arrow (↘; e.g., 6 cancer types for ID8). Lastly, the number of cancer types where the mutation density is not affected by replication timing is shown next to the right-pointing arrow (→ e.g., 7 cancer types for ID8). (A) All SBSs, DBSs, and IDs across all examined cancer types with each cancer type examined separately. (B) Exemplar signatures consistently associated with late replication timing. (C) Exemplar signatures consistently associated with early replication timing. (D) Exemplar signatures consistently unaffected by replication timing. (E) ID8 as a mutational signature inconsistently affected by replication timing. (F) The effect of replication timing on APOBEC3-associated signature SBS13 in samples with low and high APOBEC3 mutational burden. See also Figure S2.
Figure 3.
Figure 3.. Relationship between mutational signatures and nucleosome occupancy
In all cases, solid lines correspond to real somatic mutations, with blue solid lines reflecting SBSs, red solid lines reflecting DBSs, and green solid lines reflecting small IDs. Simulated somatic mutations are shown as dashed lines. Solid lines and dashed lines display the average nucleosome signal (y axes) along a 2 kb window (x axes) centered at the mutation start site for real and simulated mutations, respectively. The mutation site is annotated in the middle of each plot and denoted as 0. The 2 kb window encompasses 1,000 base pairs 5′ adjacent to each mutation as well as 1,000 base pairs 3′ adjacent to each mutation. Where applicable, the total number of similar and considered cancer types using an X/Y format, with X being the number of cancer types where a signature has similar nucleosome behavior (Pearson correlation ≥ 0.5 and adjusted p value ≤ 0.05, z-test corrected for multiple testing using Benjamini-Hochberg) and Y representing the total number of examined cancer types for that signature. For example, signature ID3 in (G) annotated with 6/9 reflects a total of 9 examined cancer types with similar nucleosome behavior observed in 6 cancer types. (A) All SBSs, DBSs, and IDs across all examined cancer types with each cancer type examined separately. (B–D) The nucleosome occupancy of signatures SBS1 (B), DBS2 (C), and ID1 (D) are shown across all cancer types as well as within cancers of the lung, head and neck, liver, and esophagus. (E) Signatures with consistent periodicities of mutation rates around the nucleosome. (F and G) Tobacco-associated SBS4 (F) and ID3 (G) exhibiting periodicities of mutation rates only in certain cancer types. See also Figure S3.
Figure 4.
Figure 4.. Relationship between mutational signatures and CTCF binding sites
(A) Enrichments and depletions of somatic mutations within CTCF binding sites. Heatmaps display only mutational signatures and cancer types that have at least one statistically significant enrichment or depletion of somatic mutations attributed to signatures of either SBSs, DBSs, or small IDs. Red colors correspond to enrichments of real somatic mutations when compared to simulated data. Blue colors correspond to depletions of real somatic mutations when compared to simulated data. The intensities of red and blue colors reflect the degree of enrichments or depletions based on the fold change. White colors correspond to lack of data for performing statistical comparisons (e.g., signature not being detected in a cancer type). Statistically significant enrichments and depletions are annotated with an asterisk (*; adjusted p value ≤ 0.05, z-test combined with Fisher’s method and corrected for multiple testing using Benjamini-Hochberg). (B) The top three panels reflect average CTCF occupancy signal for all SBSs, DBS, and IDs across all examined cancer types. Bottom panels reflect all somatic mutations attributed for several exemplar mutational signatures across all cancer types. In all cases, solid lines correspond to real somatic mutations, with blue solid lines reflecting SBSs, red solid lines reflecting DBSs, and green solid lines reflecting IDs. Solid lines and dashed lines display the average CTCF binding signal (y axes) along a 2 kb window (x axes) centered at the mutation start site for real and simulated mutations, respectively. The mutation start site is annotated in the middle of each plot and denoted as 0. The 2 kb window encompasses 1,000 base pairs 5′ adjacent to each mutation as well as 1,000 base pairs 3′ adjacent to each mutation.
Figure 5.
Figure 5.. Exemplar relationships between mutational signatures and histone modifications
The effect of histone modifications is shown for signatures SBS1 (A) and ID1 (B). For each signature, an evaluation was made for each of the 11 histone marks across all cancer types with sufficient numbers of somatic mutations with results presented as circles. Each circle is separated in red, blue, and gray segments proportional to the cancer types in which the signature has a specific behavior. A red segment in a circle reflects the signature being enriched in the vicinity of a histone modification (adjusted p value ≤ 0.05, z-test combined with Fisher’s method and corrected for multiple testing using Benjamini-Hochberg and at least 5% enrichment). A blue segment in a circle reflects the signature being depleted in the vicinity of a histone modification (adjusted p value ≤ 0.05, z-test combined with Fisher’s method and corrected for multiple testing using Benjamini-Hochberg and at least 5% depletion). A gray segment in a circle corresponds to neither depletion nor enrichment of the signature in the vicinity of a histone modification. The figure zooms in on the effect of H3K9me3 on SBS1 (A) and of H3K27ac on ID1 (B). Red colors correspond to enrichments of real somatic mutations when compared to simulated data. Blue colors correspond to depletions of real somatic mutations when compared to simulated data. The intensities of red and blue colors reflect the degree of enrichments or depletions based on the fold change. We further zoom in on the patterns of mutations around H3K9me3 and H3K27ac. Solid lines correspond to real somatic mutations, with blue solid lines reflecting SBSs and green solid lines reflecting IDs. Solid lines and dashed lines display the average histone mark signal (y axes) along a 2 kb window (x axes) centered at the mutation start site for real and simulated mutations, respectively. The mutation start site is annotated in the middle of each plot and denoted as 0. The 2 kb window encompasses 1,000 base pairs 5′ adjacent to each mutation as well as 1,000 base pairs 3′ adjacent to each mutation. See also Figure S4.
Figure 6.
Figure 6.. Topography of signature SBS28 in POLE-deficient (POLE) and POLE-proficient (POLE+) samples
(A) Mutational patterns of signature SBS28 in POLE and POLE+ samples displayed using the conventional 96 mutational classification schema for SBSs. (B) Nucleosome occupancy of SBS28 in POLE and POLE+ samples. Blue solid lines and gray dashed lines display the average nucleosome signal (y axes) along a 2 kb window (x axes) centered at the mutation start site for real and simulated mutations, respectively. The mutation start site is annotated in the middle of each plot and denoted as 0. The 2 kb window encompasses 1,000 base pairs 5′ adjacent to each mutation as well as 1,000 base pairs 3′ adjacent to each mutation. (C) CTCF occupancy of SBS28 in POLE and POLE+ samples. Blue solid lines and gray dashed lines display the average CTCF binding signal (y axes) along a 2 kb window (x axes) centered at the mutation start site for real and simulated mutations, respectively. The mutation start site is annotated in the middle of each plot and denoted as 0. The 2 kb window encompasses 1,000 base pairs 5′ adjacent to each mutation as well as 1,000 base pairs 3′ adjacent to each mutation. (D) Replication timing of SBS28 mutations in POLE and POLE+ samples. Replication time data are separated into deciles, with each segment containing exactly 10% of the observed replication time signal (x axes). Normalized mutation densities per decile (y axes) are presented for early (left) to late (right) replication domains. Normalized mutation densities of real somatic mutations and simulated somatic mutations from early- to late-replicating regions are shown as blue bars and dashed lines, respectively. (E) Replication strand asymmetry of SBS28 mutations in POLE and POLE+ samples. Bar plots display the number of mutations accumulated on the lagging strand and on the leading strand for six substitution subtypes based on the mutated pyrimidine base C>A, C>G, C>T, T>A, T>C, and T>G in red and yellow colors, respectively. Simulated mutations on lagging and leading strands are displayed in shaded bar plots. Statistically significant strand asymmetries are shown with stars: adjusted p values: *p ≤ 0.05; **p ≤ 0.01; ***p ≤ 0.001 (Fisher’s exact test corrected for multiple testing using Benjamini-Hochberg). (F) Enrichments and depletions of SBS28 somatic mutations in POLE and POLE+ samples within CTCF binding sites, histone modifications, and nucleosome occupied regions. Red colors correspond to enrichments of real somatic mutations when compared to simulated data. Blue colors correspond to depletions of real somatic mutations when compared to simulated data. The intensities of red and blue colors reflect the degree of enrichments or depletions based on the fold change. White colors correspond to lack of data for performing statistical comparisons. Statistically significant enrichments and depletions are annotated with an asterisk (*; adjusted p value ≤ 0.05, z-test combined with Fisher’s method and corrected for multiple testing using Benjamini-Hochberg). (G) Strand-coordinated mutagenesis of SBS28 mutations in POLE and POLE+ samples. Rows represent SBS28 signature in POLE and POLE+ samples across all cancer types and columns reflect the lengths, in numbers of consecutive mutations, of strand-coordinated mutagenesis groups. Statistically significant strand-coordinated mutagenesis (adjusted p value ≤ 0.05, z-test corrected for multiple testing using Benjamini-Hochberg) are shown as circles under the respective group length with a length starting from 2 to 11 consecutive mutations. The size of each circle reflects the number of consecutive mutation groups for the specified group length normalized for each SBS28 signature in POLE and POLE+ samples. The color of each circle reflects the statistical significance of the number of subsequent mutation groups for each group length with respect to the simulated mutations using −log10 (q value).
Figure 7.
Figure 7.. Topography of non-clustered, omikli, and kataegis substitutions across 288 whole-genome-sequenced B cell malignancies
(A) A rainfall plot of an example B cell malignancy sample, MALY-DE_SP116612, depicting the intra-mutational distance (IMD) distributions of substitutions across genomic coordinates. Each dot represents the minimum distance between two adjacent mutations. Dots are colored based on their corresponding classifications. Specifically, non-clustered mutations are shown in gray, DBSs in red, multi-base substitutions (MBSs) in black, omikli events in green, kataegis events in orange, and all other clustered events in blue. The red line depicts the sample-dependent IMD threshold for each sample. Specific clustered mutations may be above this threshold due to corrections for regional mutation density. (B–D) The trinucleotide mutational spectra for the different catalogs of non-clustered, omikli, and kataegis mutations for the exemplar sample (DBSs and MBSs are not shown). (E) Nucleosome occupancy of non-clustered, omikli, and kataegis mutations of B cell malignancies. Blue solid lines and gray dashed lines display the average nucleosome signal (y axes) along a 2 kb window (x axes) centered at the mutation start site for real and simulated mutations, respectively. The mutation start site is annotated in the middle of each plot and denoted as 0. The 2 kb window encompasses 1,000 base pairs 5′ adjacent to each mutation as well as 1,000 base pairs 3′ adjacent to each mutation. (F) CTCF occupancy of non-clustered, omikli, and kataegis mutations of B cell malignancies. Blue solid lines and gray dashed lines display the average CTCF signal (y axes) along a 2 kb window (x axes) centered at the mutation start site for real and simulated mutations, respectively. The mutation start site is annotated in the middle of each plot and denoted as 0. The 2 kb window encompasses 1,000 base pairs 5′ adjacent to each mutation as well as 1,000 base pairs 3′ adjacent to each mutation. (G) Replication timing of non-clustered, omikli, and kataegis mutations of B cell malignancies. Replication time data are separated into deciles, with each segment containing exactly 10% of the observed replication time signal (x axes). Normalized mutation densities per decile (y axes) are presented for early (left) to late (right) replication domains. Normalized mutation densities of real somatic mutations and simulated somatic mutations from early- to late-replicating regions are shown as blue bars and dashed lines, respectively. (H) Enrichments and depletions of non-clustered, omikli, and kataegis mutations of B cell malignancies within CTCF binding sites and histone modifications. Red colors correspond to enrichments of real somatic mutations when compared to simulated data. Blue colors correspond to depletions of real somatic mutations when compared to simulated data. The intensities of red and blue colors reflect the degree of enrichments or depletions based on the fold change. White colors correspond to lack of data for performing statistical comparisons. Statistically significant enrichments and depletions are annotated with an asterisk (*; adjusted p value ≤0.05, z-test combined with Fisher’s method and corrected for multiple testing using Benjamini-Hochberg). See also Figure S5.

References

    1. Stratton MR, Campbell PJ, and Futreal PA (2009). The cancer genome. Nature 458, 719–724. 10.1038/nature07943. - DOI - PMC - PubMed
    1. Martincorena I, and Campbell PJ (2015). Somatic mutation in cancer and normal cells. Science 349, 1483–1489. 10.1126/science.aab4082. - DOI - PubMed
    1. Alexandrov LB, Nik-Zainal S, Wedge DC, Aparicio SA, Behjati S, Biankin AV, Bignell GR, Bolli N, Borg A, Borresen-Dale AL, et al. (2013). Signatures of mutational processes in human cancer. Nature 500, 415–421. 10.1038/nature12477. - DOI - PMC - PubMed
    1. Alexandrov LB, Kim J, Haradhvala NJ, Huang MN, Tian Ng AW, Wu Y, Boot A, Covington KR, Gordenin DA, Bergstrom EN, et al. (2020). The repertoire of mutational signatures in human cancer. Nature 578, 94–101. 10.1038/s41586-020-1943-3. - DOI - PMC - PubMed
    1. Islam SMA, Diaz-Gay M, Wu Y, Barnes M, Vangara R, Bergstrom EN, He Y, Vella M, Wang J, Teague JW, et al. (2022). Uncovering novel mutational signatures by de novo extraction with SigProfilerExtractor. Cell Genom 2, 100179. 10.1016/j.xgen.2022.100179. - DOI - PMC - PubMed

Publication types