. 2023 Aug 4;9(31):eadf6895.
doi: 10.1126/sciadv.adf6895. Epub 2023 Aug 4.

Monomerization of TDP-43 is a key determinant for inducing TDP-43 pathology in amyotrophic lateral sclerosis

Affiliations

Monomerization of TDP-43 is a key determinant for inducing TDP-43 pathology in amyotrophic lateral sclerosis

Kotaro Oiwa et al. Sci Adv. .

Abstract

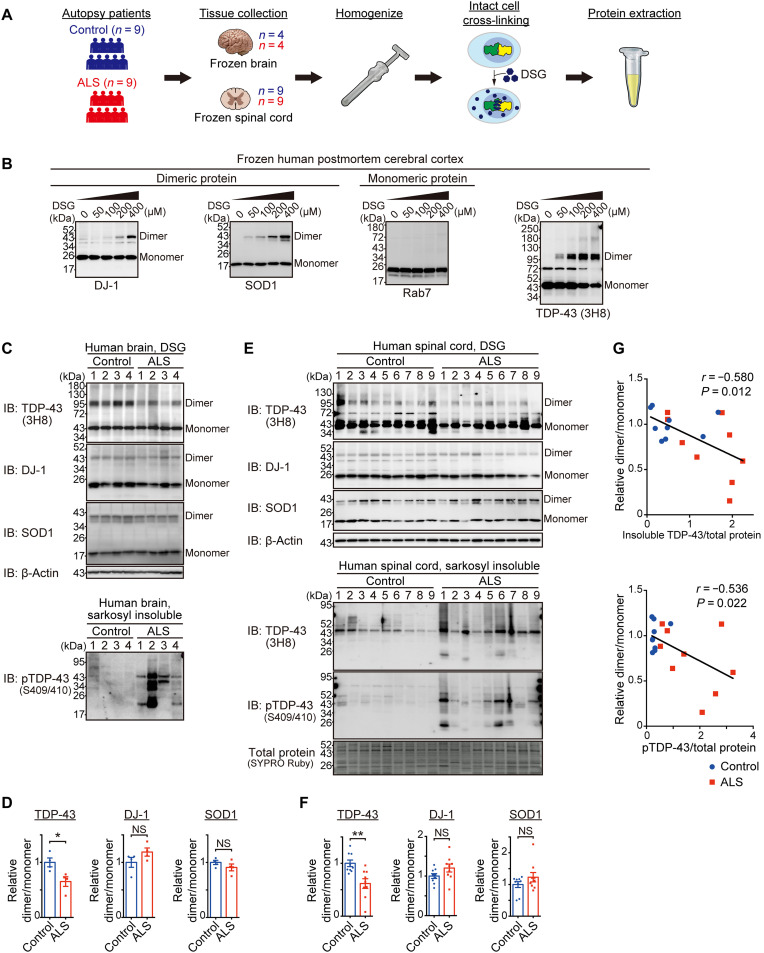
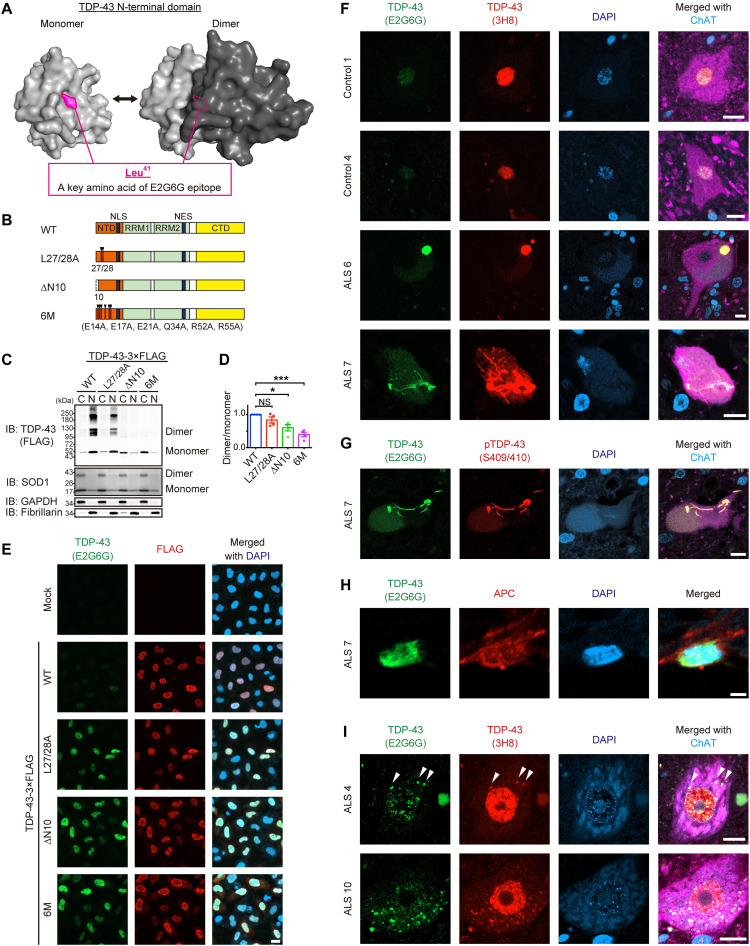
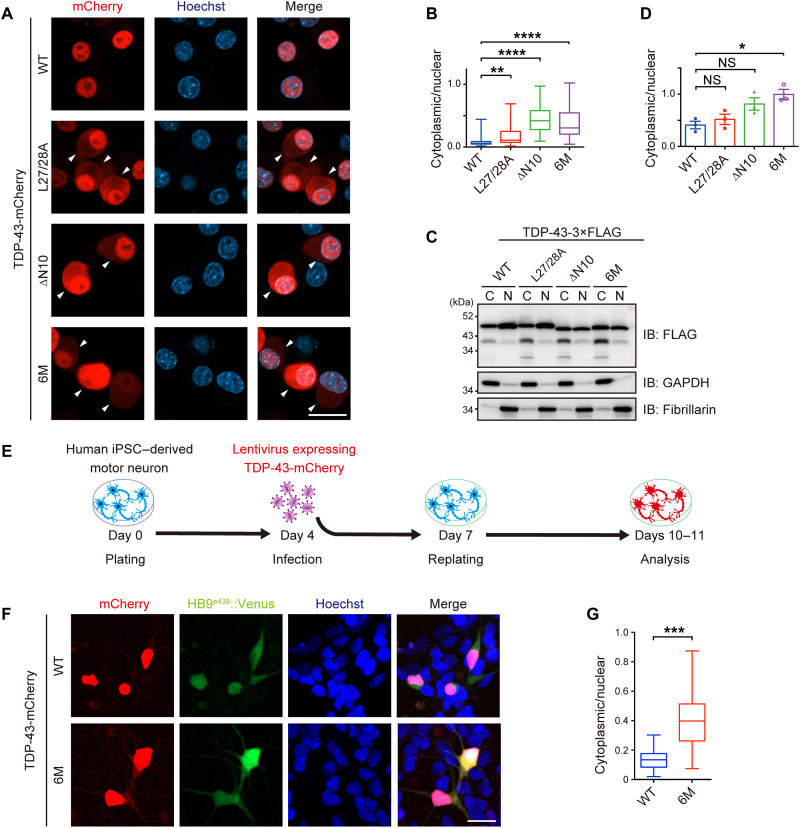
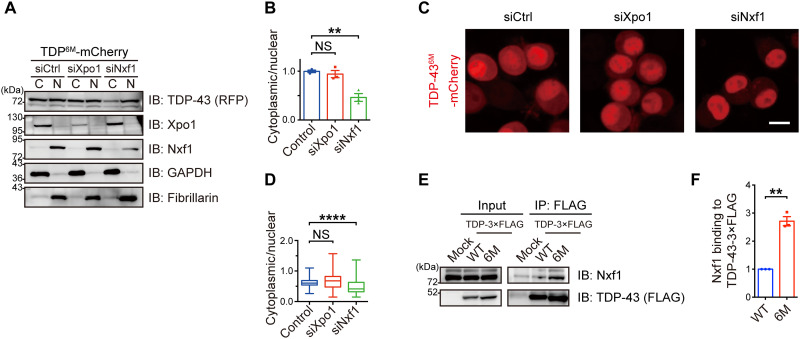
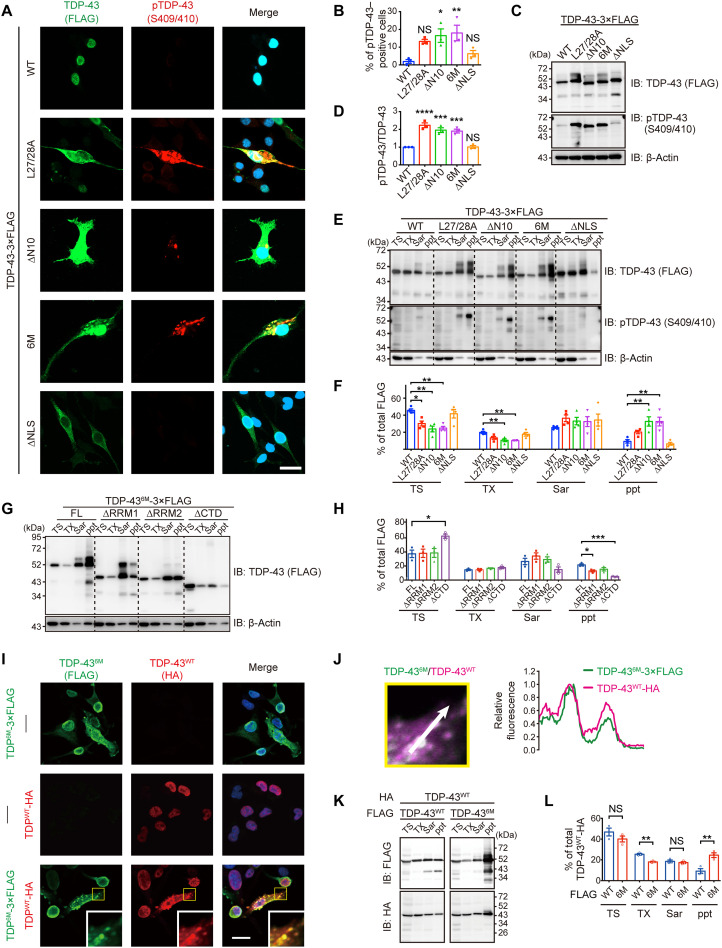
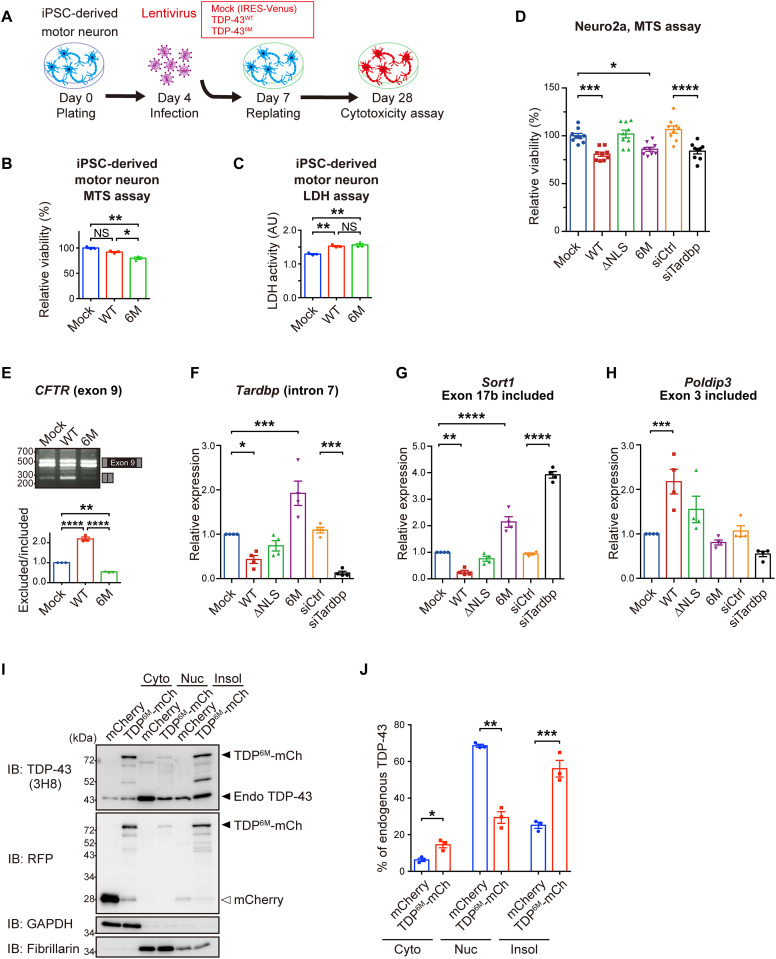
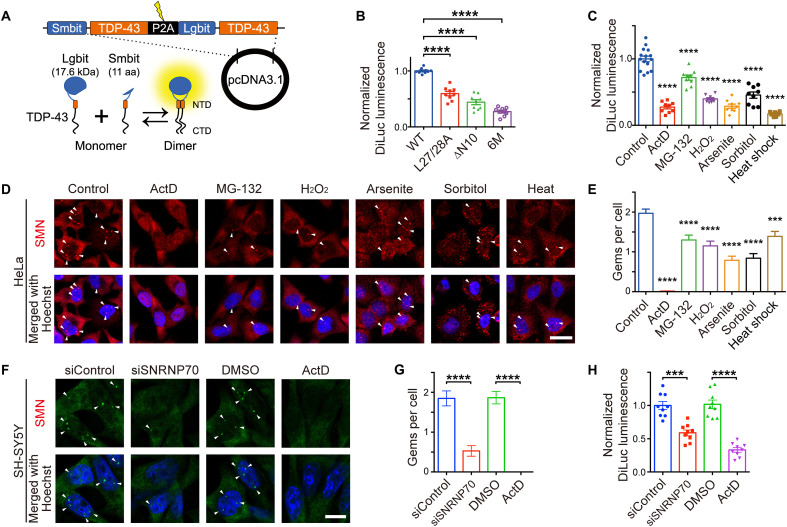
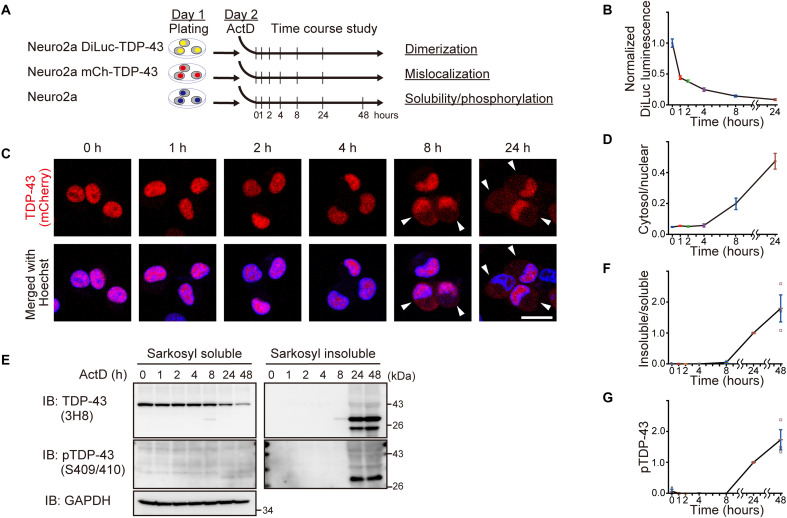
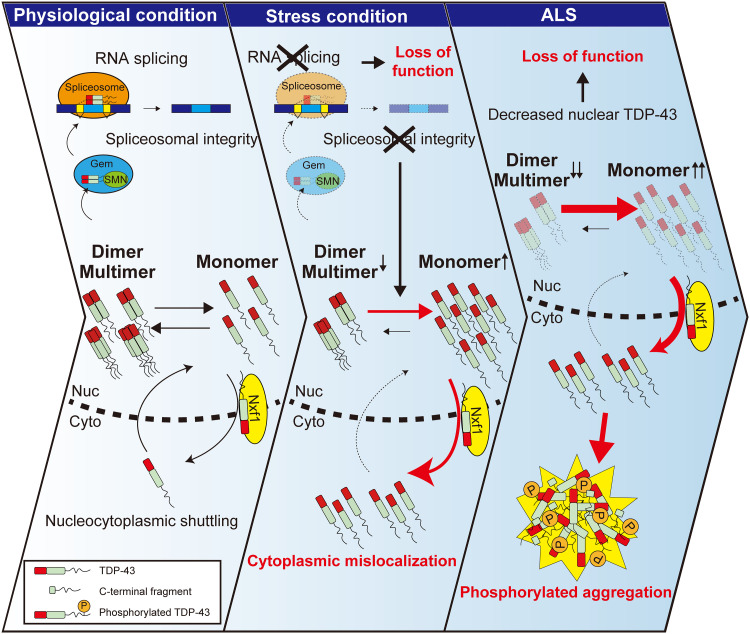
The cytoplasmic aggregation of TAR DNA binding protein-43 (TDP-43), also known as TDP-43 pathology, is the pathological hallmark of amyotrophic lateral sclerosis (ALS). However, the mechanism underlying TDP-43 cytoplasmic mislocalization and subsequent aggregation remains unclear. Here, we show that TDP-43 dimerization/multimerization is impaired in the postmortem brains and spinal cords of patients with sporadic ALS and that N-terminal dimerization-deficient TDP-43 consists of pathological inclusion bodies in ALS motor neurons. Expression of N-terminal dimerization-deficient mutant TDP-43 in Neuro2a cells and induced pluripotent stem cell-derived motor neurons recapitulates TDP-43 pathology, such as Nxf1-dependent cytoplasmic mislocalization and aggregate formation, which induces seeding effects. Furthermore, TDP-DiLuc, a bimolecular luminescence complementation reporter assay, could detect decreased N-terminal dimerization of TDP-43 before TDP-43 pathological changes caused by the transcription inhibition linked to aberrant RNA metabolism in ALS. These findings identified TDP-43 monomerization as a critical determinant inducing TDP-43 pathology in ALS.


Figures

Fig. 1.
Fig. 1.. TDP-43 dimerization/multimerization is impaired in the cerebral cortices and spinal cords of patients with sporadic ALS.
(A) Schematic representation of the experimental design of the DSG cross-linking assay using frozen postmortem brain or spinal cord tissues. (B) Representative immunoblots showing a dose-dependent increase in TDP-43 dimer/multimer levels and DJ-1 and SOD1 dimer levels after DSG treatment, with unaffected Rab7 levels. Postmortem frozen cerebral cortex was DSG–cross-linked at the indicated concentrations. The same extracted protein samples were analyzed by immunoblotting for TDP-43; dimeric protein controls, DJ-1 and SOD1; and monomeric protein control, Rab7. The 72 kDa additional band in the TDP-43 immunoblotting is a nonspecific band (see fig. S1). (C) Representative immunoblots (IB) of DSG–cross-linked or sarkosyl-insoluble postmortem brain samples visualized with the indicated antibodies. n = 4, biologically independent samples. (D) Quantification of the dimer/monomer ratio (relative to the mean level of the control samples) of TDP-43, DJ-1, and SOD1 in (C). n = 4, biologically independent samples. (E) Representative immunoblots of DSG–cross-linked or sarkosyl-insoluble samples from postmortem spinal cord tissues visualized with the indicated antibodies. The SYPRO Ruby stain detected the total protein levels. n = 9, biologically independent samples. (F) Quantification of the dimer/monomer ratio (relative to the mean level of the control samples) of TDP-43, DJ-1, and SOD1 in (E). n = 9, biologically independent samples. (G) Correlation dot plots of the dimer/monomer ratio (relative to the mean level of the control samples) of TDP-43 and relative levels of sarkosyl-insoluble TDP-43 (top) or phosphorylated TDP-43 (pTDP-43) (bottom) normalized to the total protein levels (relative to the mean level of all samples) in (E) (Pearson’s correlation method). Data are expressed as means ± SEM (D and F). NS, not significant. *P < 0.05 and **P < 0.01 [unpaired two-sided t test in (D) and (F)].
Fig. 2.
Fig. 2.. NDD-TDP-43 constitutes pathological inclusion bodies in ALS.
(A) Three-dimensional models of the monomeric and dimeric NTD of TDP-43 as predicted by AlphaFold2. The critical amino acid of the anti–TDP-43 monoclonal antibody (E2G6G) epitope, Leu41, is indicated. (B) Schematic illustration of the TDP-43WT and three N-terminal dimerization–deficient mutants (NDD mutants). NLS, nuclear localization signal; NES, nuclear export signal. (C) Representative immunoblots of DSG–cross-linked subcellular fractions obtained from Neuro2a cells transiently expressing TDP-43-3×FLAG WT or NDD mutants. Monomeric, dimeric, and multimeric TDP-43 in the cytoplasmic (C) and nuclear (N) fractions were detected using an anti-FLAG antibody. SOD1, GAPDH (glyceraldehyde-3-phosphate dehydrogenase), and fibrillarin were used as markers for equal cross-linking, cytoplasmic fractions, and nuclear fractions, respectively. (D) Quantification of the dimer/monomer ratio of TDP-43 (relative to TDP-43WT) in (C). n = 4, biologically independent experiments. Data are expressed as means ± SEM. *P < 0.05 and ***P < 0.001 [analysis of variance (ANOVA) with Tukey’s test]. (E) Representative images of HeLa cells transiently expressing TDP-43 WT or NDD mutants immunostained with E2G6G and anti-FLAG antibody. DAPI, 4′,6-diamidino-2-phenylindole. (F) Representative images of spinal motor neurons from two controls and four patients with sporadic ALS (sALS), with similar results within the groups, immunostained with E2G6G, anti–panTDP-43 (3H8), and anti–choline acetyltransferase (ChAT). (G) Representative images of a spinal motor neuron from a patient with sALS immunostained with E2G6G, anti–pTDP-43 (Ser409/Ser410), and anti-ChAT. (H) Representative images of an oligodendrocyte in the spinal cord from a patient with sALS immunostained with E2G6G and anti-APC. (I) Representative images of spinal motor neurons from a patient with sALS with remaining nuclear TDP-43, immunostained with E2G6G, 3H8, and anti-ChAT. Arrowheads indicate E2G6G-positive cytoplasmic granules. Scale bars, 20 μm (E), 10 μm (F, G, and I), and 2 μm (H).
Fig. 3.
Fig. 3.. NDD-TDP-43 mutations induce protein mislocalization into the cytoplasm.
(A) Representative images of Neuro2a cells transiently expressing TDP-43-mCherry WT or NDD mutants. Arrowheads indicate cells with cytoplasmic TDP-43. Scale bar, 10 μm. (B) Box and whisker plots of the cytoplasmic/nuclear ratios of TDP-43-mCherry fluorescence quantified in 100 cells from (A) from three biologically independent experiments. (C) Representative immunoblots of the fractions obtained from Neuro2a cells transiently expressing TDP-43-3×FLAG WT or NDD mutants. (D) Quantification of the cytoplasmic/nuclear ratios of TDP-43-3×FLAG in (C). n = 3, biologically independent experiments. (E and F) Experimental protocol (E) and representative images of human iPSC–derived motor neurons infected with lentivirus expressing HB9e438::TDP-43WT- or HB9e438::TDP-436M-mCherry-IRES-Venus (F). (G) Box and whisker plots of the cytoplasmic/nuclear ratios of TDP-43-mCherry fluorescence quantified in 100 cells from (F) from eight biologically independent experiments. Data are expressed as means ± SEM (D). Box and whisker plots represent the quartiles (boxes), 50th percentiles (center lines), and ranges between the maximum and minimum values (whiskers) in (B) and (G). *P < 0.05, **P < 0.01, ***P < 0.001, and ****P < 0.0001 [ANOVA with Tukey’s test in (B) and (D) and unpaired two-sided t test in (G)].
Fig. 4.
Fig. 4.. Nxf1 facilitates cytoplasmic translocation of TDP-43 monomers.
(A) Neuro2a cells transiently expressing TDP-436M-mCherry were treated with control siRNA or siRNAs targeting Xpo1 or Nxf1, followed by nucleocytoplasmic fractionation. Representative immunoblots showing the cytoplasmic (C) and nuclear (N) levels of TDP-43 (RFP), Xpo1, and Nxf1 in the Neuro2a cells expressing TDP-436M-mCherry. GAPDH and fibrillarin were used as cytoplasmic and nuclear markers, respectively. (B) Relative cytoplasmic/nuclear ratios of TDP-43-mCherry in (A) plotted as means ± SEM. n = 3, biologically independent experiments. (C) Representative images of Neuro2a cells transiently expressing TDP-436M-mCherry treated with control siRNA or siRNAs targeting Xpo1 or Nxf1. Scale bar, 10 μm. (D) Box and whisker plots of the cytoplasmic/nuclear ratios of TDP-43-mCherry fluorescence quantified in 100 cells from three independent experiments in (C). The graph shows the quartiles (boxes), 50th percentiles (center lines), and ranges between the maximum and minimum values (whiskers). (E) TDP-43-3×FLAG WT or 6M mutant was transiently transfected in the Neuro2a cells. An anti-FLAG antibody was used for immunoprecipitation of the lysates. Bound endogenous Nxf1 was detected by immunoblotting with an anti-Nxf1 antibody. (F) Relative Nxf1 levels bound to TDP-43-3×FLAG was normalized to the immunoprecipitated FLAG levels (relative to TDP-43WT) in (E) plotted as means ± SEM. n = 3, biologically independent experiments. **P < 0.01 and ****P < 0.0001 [ANOVA with Tukey’s test in (B) and (D) and unpaired two-sided t test in (F)].
Fig. 5.
Fig. 5.. NDD-TDP-43 mutations induce phosphorylation, insolubilization, and coaggregation with WT TDP-43.
(A) Representative images of Neuro2a cells transiently expressing TDP-43 WT, NDD mutants, or NLS mutant immunostained with anti-FLAG and anti–pTDP-43. (B) Quantification of the percentage of the pTDP-43–positive cells per FLAG-positive cells in (A). Over 100 cells were quantified per experiment. (C) Representative immunoblots of Neuro2a cells transiently transfected with TDP-43-3×FLAG WT and mutants. (D) Quantification of pTDP-43/FLAG ratios (relative to TDP-43WT) in (C). (E) Representative immunoblots of Neuro2a cells transiently expressing TDP-43-3×FLAG WT and mutants. Proteins sequentially extracted with tris-HCl (TS), 1% Triton X-100 (TX), and 1% sarkosyl (Sar), as well as a sarkosyl-insoluble fraction (ppt), were analyzed by immunoblotting. (F) Quantification of the percentage of each fraction relative to the total amount of TDP-43-3×FLAG in (E). (G) Representative immunoblots of the sequentially extracted lysates from Neuro2a cells transiently expressing TDP-436M-3×FLAG full-length (FL) and deletion mutants. (H) Quantification of the percentage of each fraction to the total amount of TDP-43-3×FLAG in (G). (I) Representative immunofluorescence images of Neuro2a cells transiently expressing TDP-436M-3×FLAG (top), TDP-43WT-HA (middle), or both (bottom). Insets show magnified images of the outlined square area. (J) Line scan analysis of coaggregation of TDP-436M-3×FLAG and TDP-43WT-HA in the inset from (I). (K) Representative immunoblots of the sequentially extracted lysates from Neuro2a cells transiently coexpressing TDP-43WT-3×FLAG or TDP-436M-3×FLAG and TDP-43WT-HA. (L) Quantification of the percentage of TDP-43-3×FLAG in each fraction relative to the total amount of TDP-43WT-HA in (K). Scale bars, 10 μm (A and I). n = 3, biologically independent experiments (B, D, F, H, and L). Data are expressed as means ± SEM. *P < 0.05, **P < 0.01, ***P < 0.001, and ****P < 0.0001 [ANOVA with Tukey’s test in (B), (D), (F), and (H) and unpaired two-sided t test in (L)].
Fig. 6.
Fig. 6.. NDD-TDP-43 mutant impairs endogenous TDP-43 function by sequestrating the endogenous TDP-43 into aggregates.
(A to C) Cell viability and cytotoxicity of iPSC-derived motor neurons infected with lentivirus expressing TDP-43WT or TDP-436M. Experimental protocol (A), MTS assay (B), and LDH assay (C) (relative to mock-transfected cells). (D) Relative viability of Neuro2a cells transiently transfected with TDP-43, control siRNAs, or siRNA targeting TDP-43 (relative to mock-transfected cells) was determined by MTS assay. Triplicate samples were analyzed in three biologically independent experiments. (E) Exon skipping assay for CFTR exon 9. Neuro2a cells were transiently cotransfected with TDP-43 and CFTR minigene reporter plasmids. Splicing of CFTR exon 9 was assessed by RT-PCR (top). Quantification of the exclusion/inclusion ratio of CFTR exon 9 (relative to mock-transfected cells) was performed from the band intensities (bottom). n = 3, biologically independent experiments. (F to H) Quantification of RNA levels of Tardbp intron 7 (F), Sort1 (G), and Poldip3 (H) with indicated exon inclusion. Neuro2a cells were transiently transfected with TDP-43, control siRNAs, or siRNAs targeting TDP-43, and mRNA levels (relative to mock-transfected cells) were analyzed by quantitative RT-PCR. n = 4 biologically independent experiments. (I) Representative immunoblots showing endogenous TDP-43 and mCherry levels in cytoplasmic (Cyto), nuclear (Nuc), and 1% Triton X-100 insoluble fractions (Insol) of Neuro2a cells transiently expressing mCherry or TDP-436M-mCherry. GAPDH and fibrillarin were used as the cytoplasmic and nuclear markers, respectively. (J) Quantification of the percentage of endogenous TDP-43 in each fraction to the total endogenous TDP-43 in (I). n = 3, biologically independent experiments. Data are expressed as means ± SEM. *P < 0.05, **P < 0.01, ***P < 0.001, and ****P < 0.0001 [ANOVA with Tukey’s test in (B) to (H) and unpaired two-sided t test in (J)].
Fig. 7.
Fig. 7.. A bimolecular fluorescence complementation assay, TDP-DiLuc, demonstrates that transcription inhibition impairs TDP-43 dimerization/multimerization through spliceosomal defects.
(A) Schematic illustration of TDP-DiLuc, a NanoBiT-based complementation assay to monitor the TDP-43 dimerization/multimerization. aa, amino acids. (B) Relative luminescence in the Neuro2a cells transiently expressing TDP-DiLuc WT or NDD mutants (normalized to mean TDP-43WT levels). Triplicate samples were analyzed in three biologically independent experiments. (C) Quantification of the TDP-43 dimerization under stress conditions. Relative DiLuc luminescence of Neuro2a cells stably expressing TDP-DiLuc WT treated with actinomycin D (ActD), MG-132, H2O2, sodium arsenite, sorbitol, or heat shock (relative to nontreated control cells). Triplicate samples were analyzed in three biologically independent experiments. (D) Representative confocal images of HeLa cells treated with the indicated reagents followed by staining with anti-SMN. Arrowheads indicate SMN-positive Gems. (E) Quantification of Gems per cell in (D). The number of Gems was quantified in 100 cells from three independent experiments. (F) Representative confocal images of SH-SY5Y cells transiently transfected with control siRNA or siRNA targeting SNRNP70. Cells treated with ActD (5 μg/ml; 3 hours) served as the positive control. Arrowheads indicate SMN-positive Gems. DMSO, dimethyl sulfoxide. (G) Quantification of Gems per cell in (F). The number of Gems was quantified in 100 cells from three biologically independent experiments. (H) Quantification of the relative DiLuc luminescence in SH-SY5Y cells transiently transfected with TDP-DiLuc and control siRNA or siRNA targeting SNRNP70. Cells treated with ActD (5 μg/ml; 3 hours) served as the positive control. Triplicate samples were analyzed in three biologically independent experiments. Scale bars, 20 μm (D and F). Data are expressed as means ± SEM (B, C, E, G, and H). ***P < 0.001 and ****P < 0.0001 [ANOVA with Tukey’s test in (B), (C), (E), (G), and (H)].
Fig. 8.
Fig. 8.. Time-course analyses of TDP-43 alterations in ActD-treated cells indicate that TDP-43 pathological changes are preceded by its monomerization.
(A) Experimental protocol of time course analysis of Neuro2a cells treated with ActD (1 μg/ml) for the indicated time. (B) DiLuc luminescence of the Neuro2a cells stably expressing TDP-DiLuc treated with ActD (1 μg/ml) for the indicated time (relative to mean levels at time zero). Triplicate samples were analyzed in three biologically independent experiments. (C) Representative images of Neuro2a cells stably expressing mCherry-TDP-43WT and treated with ActD (1 μg/ml) for the indicated time. Arrowheads indicate cells with cytoplasmic TDP-43. Scale bar, 20 μm. (D) Time course analysis of the cytoplasmic/nuclear ratios of mCherry-TDP-43WT fluorescence quantified in 50 cells from (C) from two biologically independent experiments. (E) Representative immunoblots of sarkosyl-soluble and sarkosyl-insoluble fractions from Neuro2a cells treated with ActD (1 μg/ml) for the indicated time. (F and G) Time course analysis of the insoluble/soluble TDP-43 ratios (F) and levels of pTDP-43 at Ser409/Ser410 in the sarkosyl-insoluble fractions (G) (relative to levels at 24 hours). n = 3, biologically independent experiments. Data are expressed as means ± SEM (B, D, F, and G).
Fig. 9.
Fig. 9.. Schematic illustration of the role of the TDP-43 monomer-dimer/multimer equilibrium in the development of TDP-43 pathology in ALS.
TDP-43 exists in a monomer-dimer/multimer equilibrium in cells. The NTD of TDP-43 mediates the formation of physiological homodimers, which are essential for its physiological splicing function. The RNA export factor Nxf1 facilitates the nuclear export of monomeric TDP-43 (left). Various types of stresses, including transcription inhibition, impair TDP-43 dimerization/multimerization, likely by inducing spliceosomal defects and disrupting the monomer-dimer/multimer equilibrium, resulting in increased amounts of monomeric nonfunctional TDP-43 (middle). This excess of monomeric TDP-43 is exported from the nucleus in an Nxf1-dependent manner, leading to the cytoplasmic mislocalization of TDP-43 and its subsequent phosphorylation and aggregation, resulting in irreversible TDP-43 pathology in ALS (right).

Comment in

References

    1. J. P. Taylor, R. H. Brown Jr., D. W. Cleveland, Decoding ALS: From genes to mechanism. Nature 539, 197–206 (2016). - PMC - PubMed
    1. P. Tziortzouda, L. Van Den Bosch, F. Hirth, Triad of TDP43 control in neurodegeneration: Autoregulation, localization and aggregation. Nat. Rev. Neurosci. 22, 197–208 (2021). - PubMed
    1. G. Kim, O. Gautier, E. Tassoni-Tsuchida, X. R. Ma, A. D. Gitler, ALS genetics: Gains, losses, and implications for future therapies. Neuron 108, 822–842 (2020). - PMC - PubMed
    1. T. Arai, M. Hasegawa, H. Akiyama, K. Ikeda, T. Nonaka, H. Mori, D. Mann, K. Tsuchiya, M. Yoshida, Y. Hashizume, T. Oda, TDP-43 is a component of ubiquitin-positive tau-negative inclusions in frontotemporal lobar degeneration and amyotrophic lateral sclerosis. Biochem. Biophys. Res. Commun. 351, 602–611 (2006). - PubMed
    1. M. Neumann, D. M. Sampathu, L. K. Kwong, A. C. Truax, M. C. Micsenyi, T. T. Chou, J. Bruce, T. Schuck, M. Grossman, C. M. Clark, L. F. McCluskey, B. L. Miller, E. Masliah, I. R. Mackenzie, H. Feldman, W. Feiden, H. A. Kretzschmar, J. Q. Trojanowski, V. M. Lee, Ubiquitinated TDP-43 in frontotemporal lobar degeneration and amyotrophic lateral sclerosis. Science 314, 130–133 (2006). - PubMed

MeSH terms