. 2023 Aug 3;186(16):3368-3385.e18.
doi: 10.1016/j.cell.2023.07.007.

DRG afferents that mediate physiologic and pathologic mechanosensation from the distal colon

Affiliations

DRG afferents that mediate physiologic and pathologic mechanosensation from the distal colon

Rachel L Wolfson et al. Cell. .

Abstract

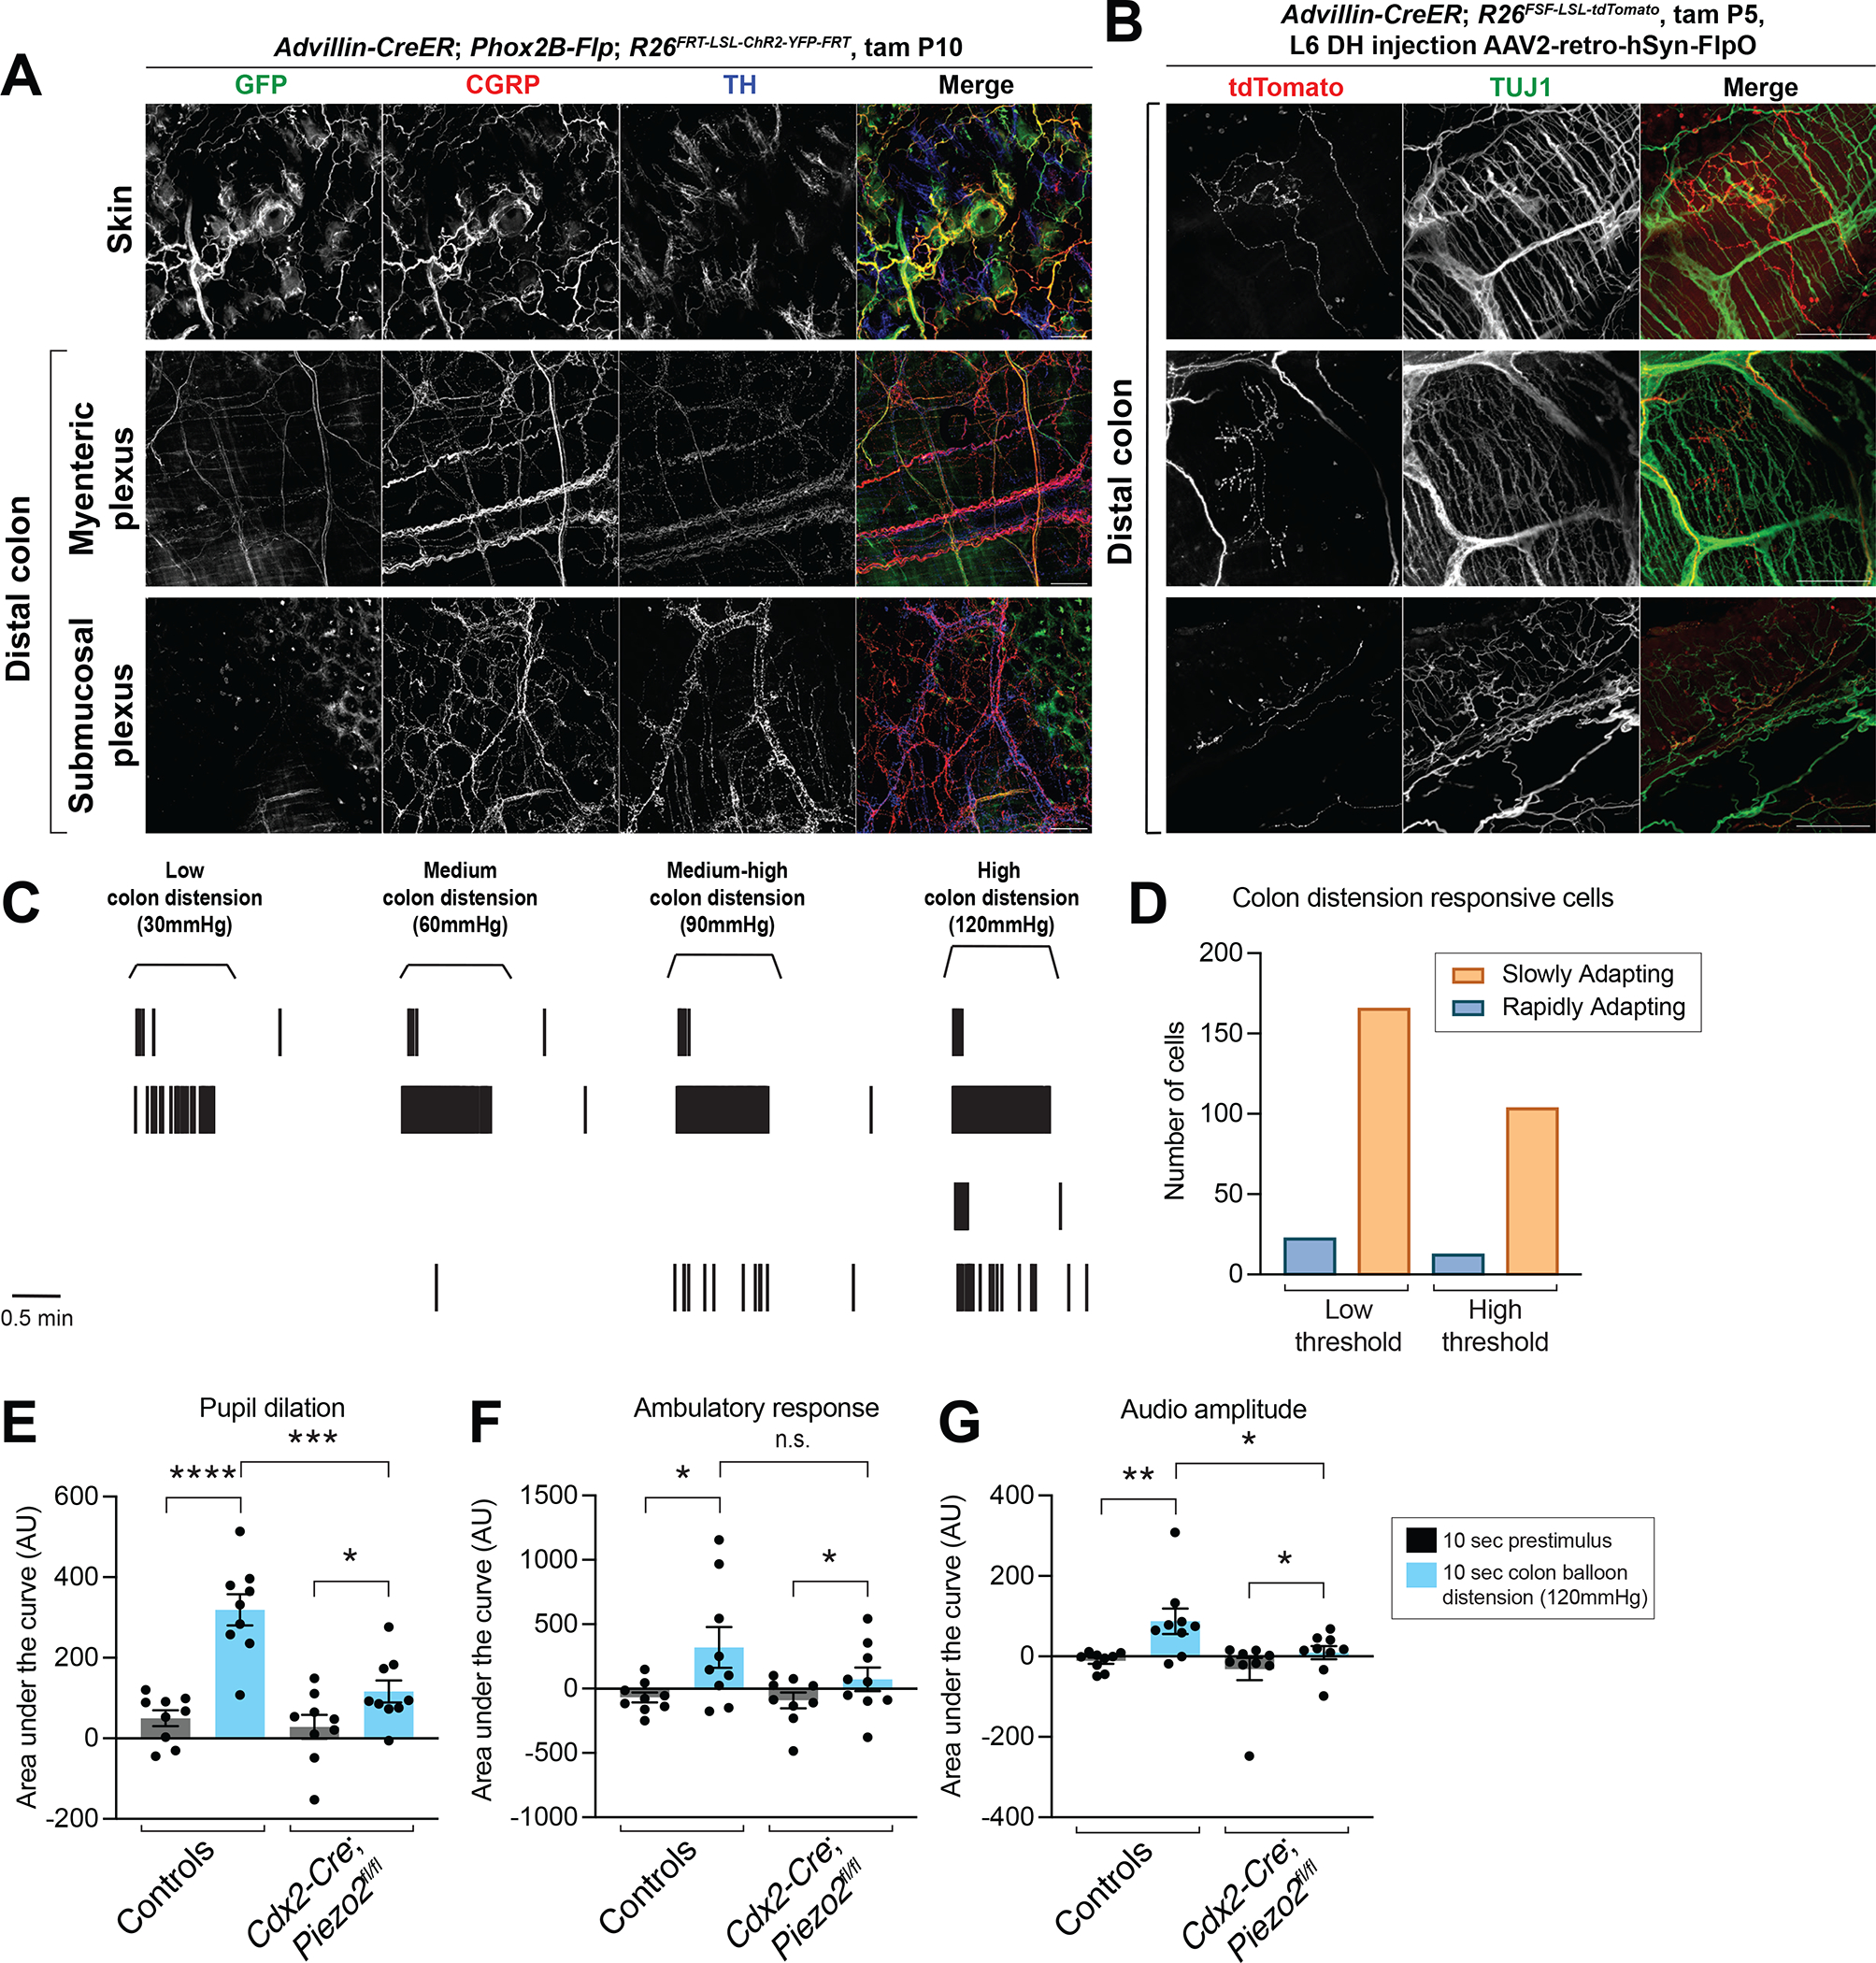
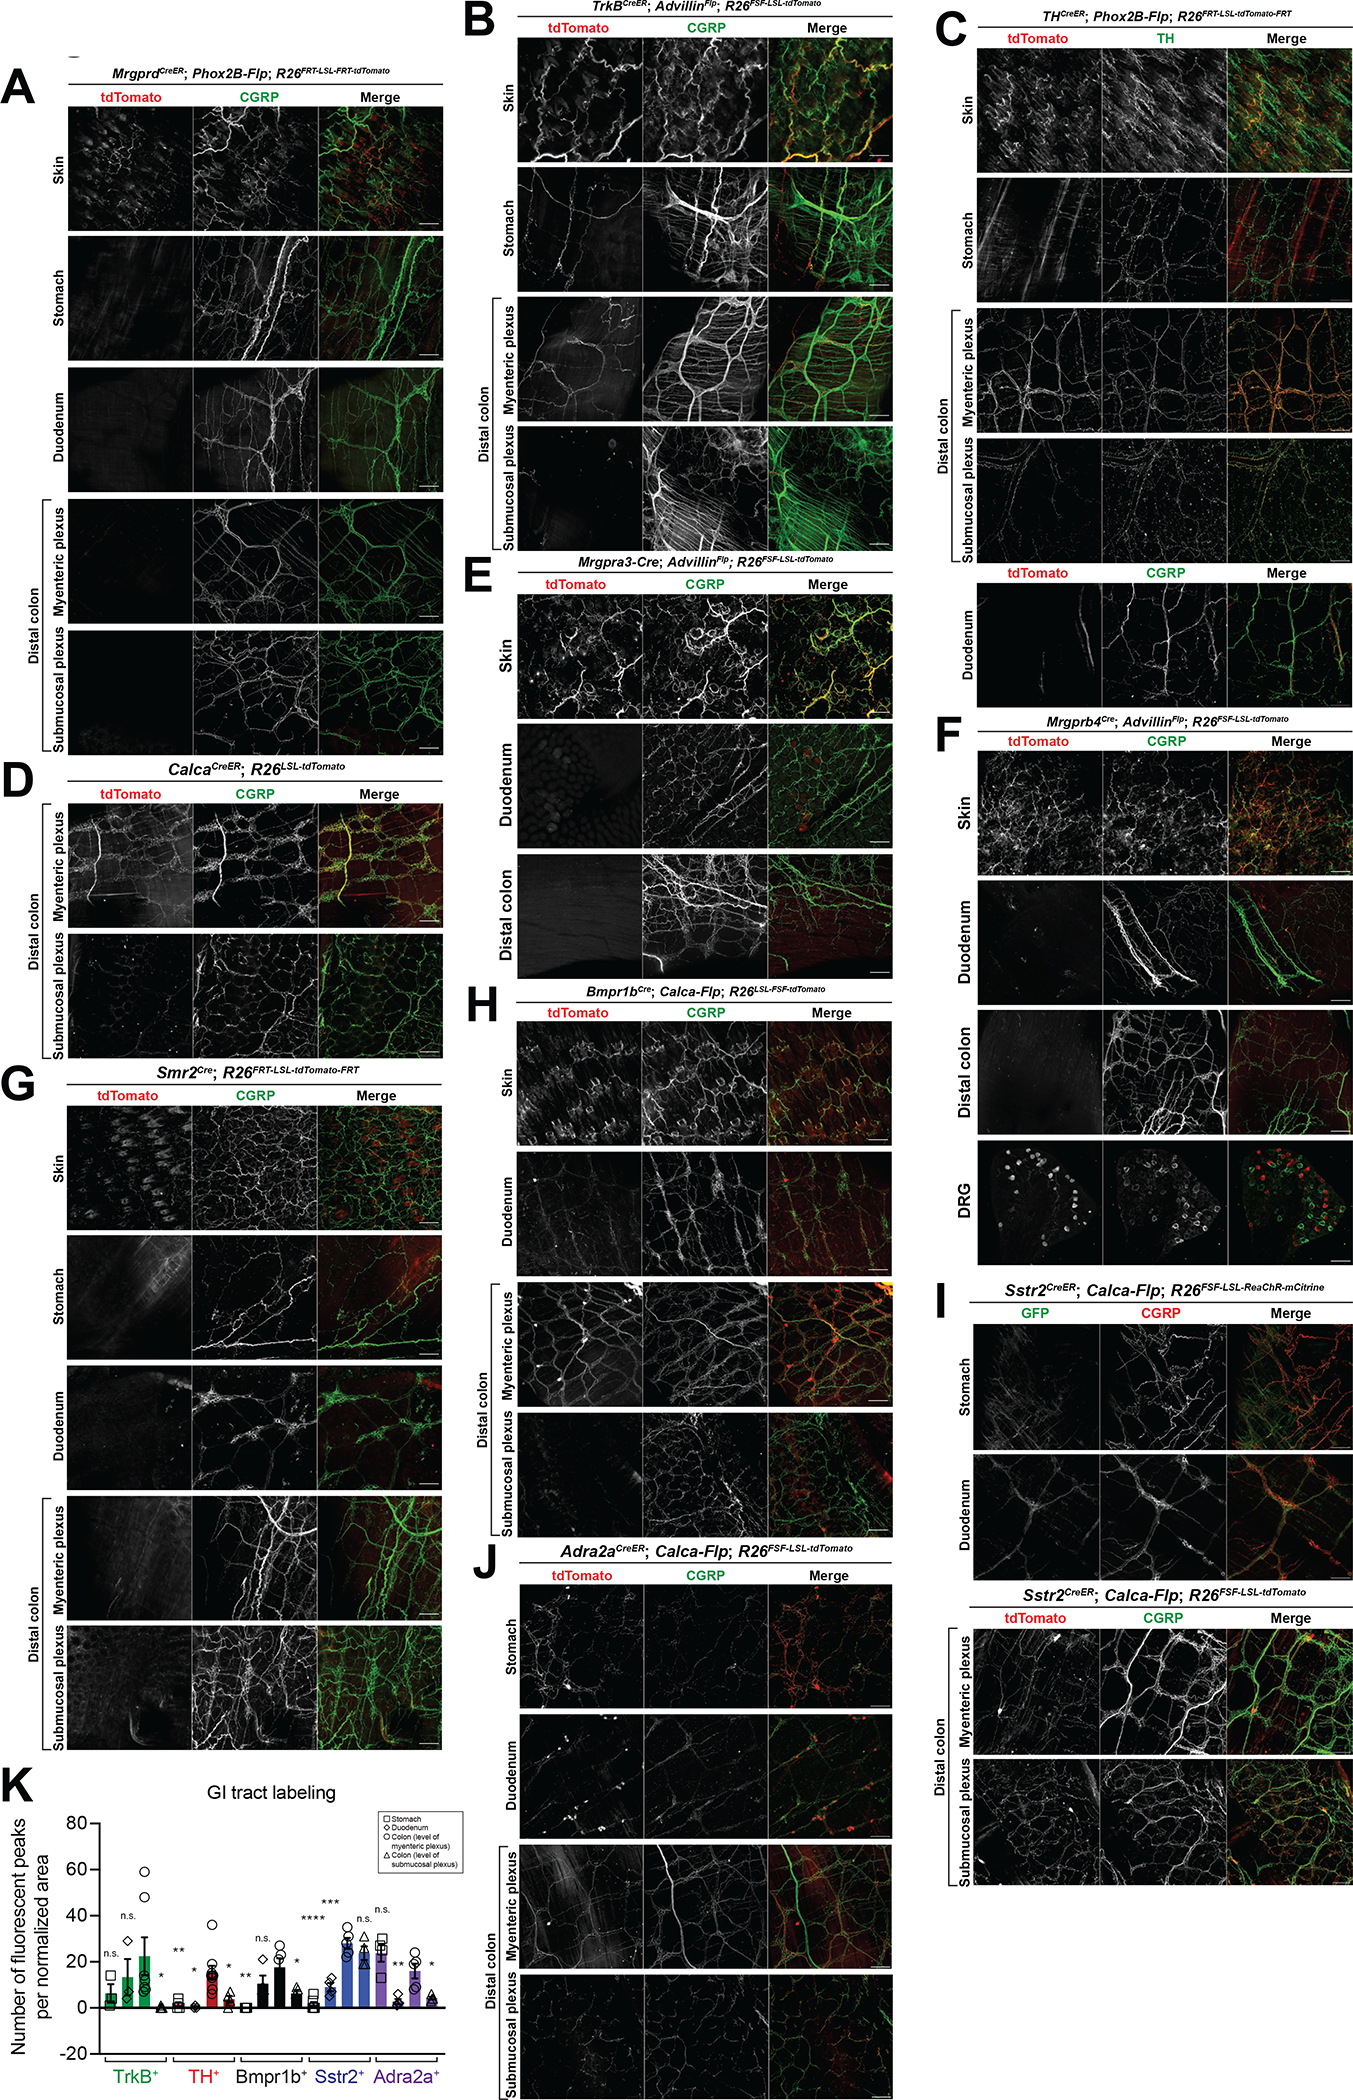
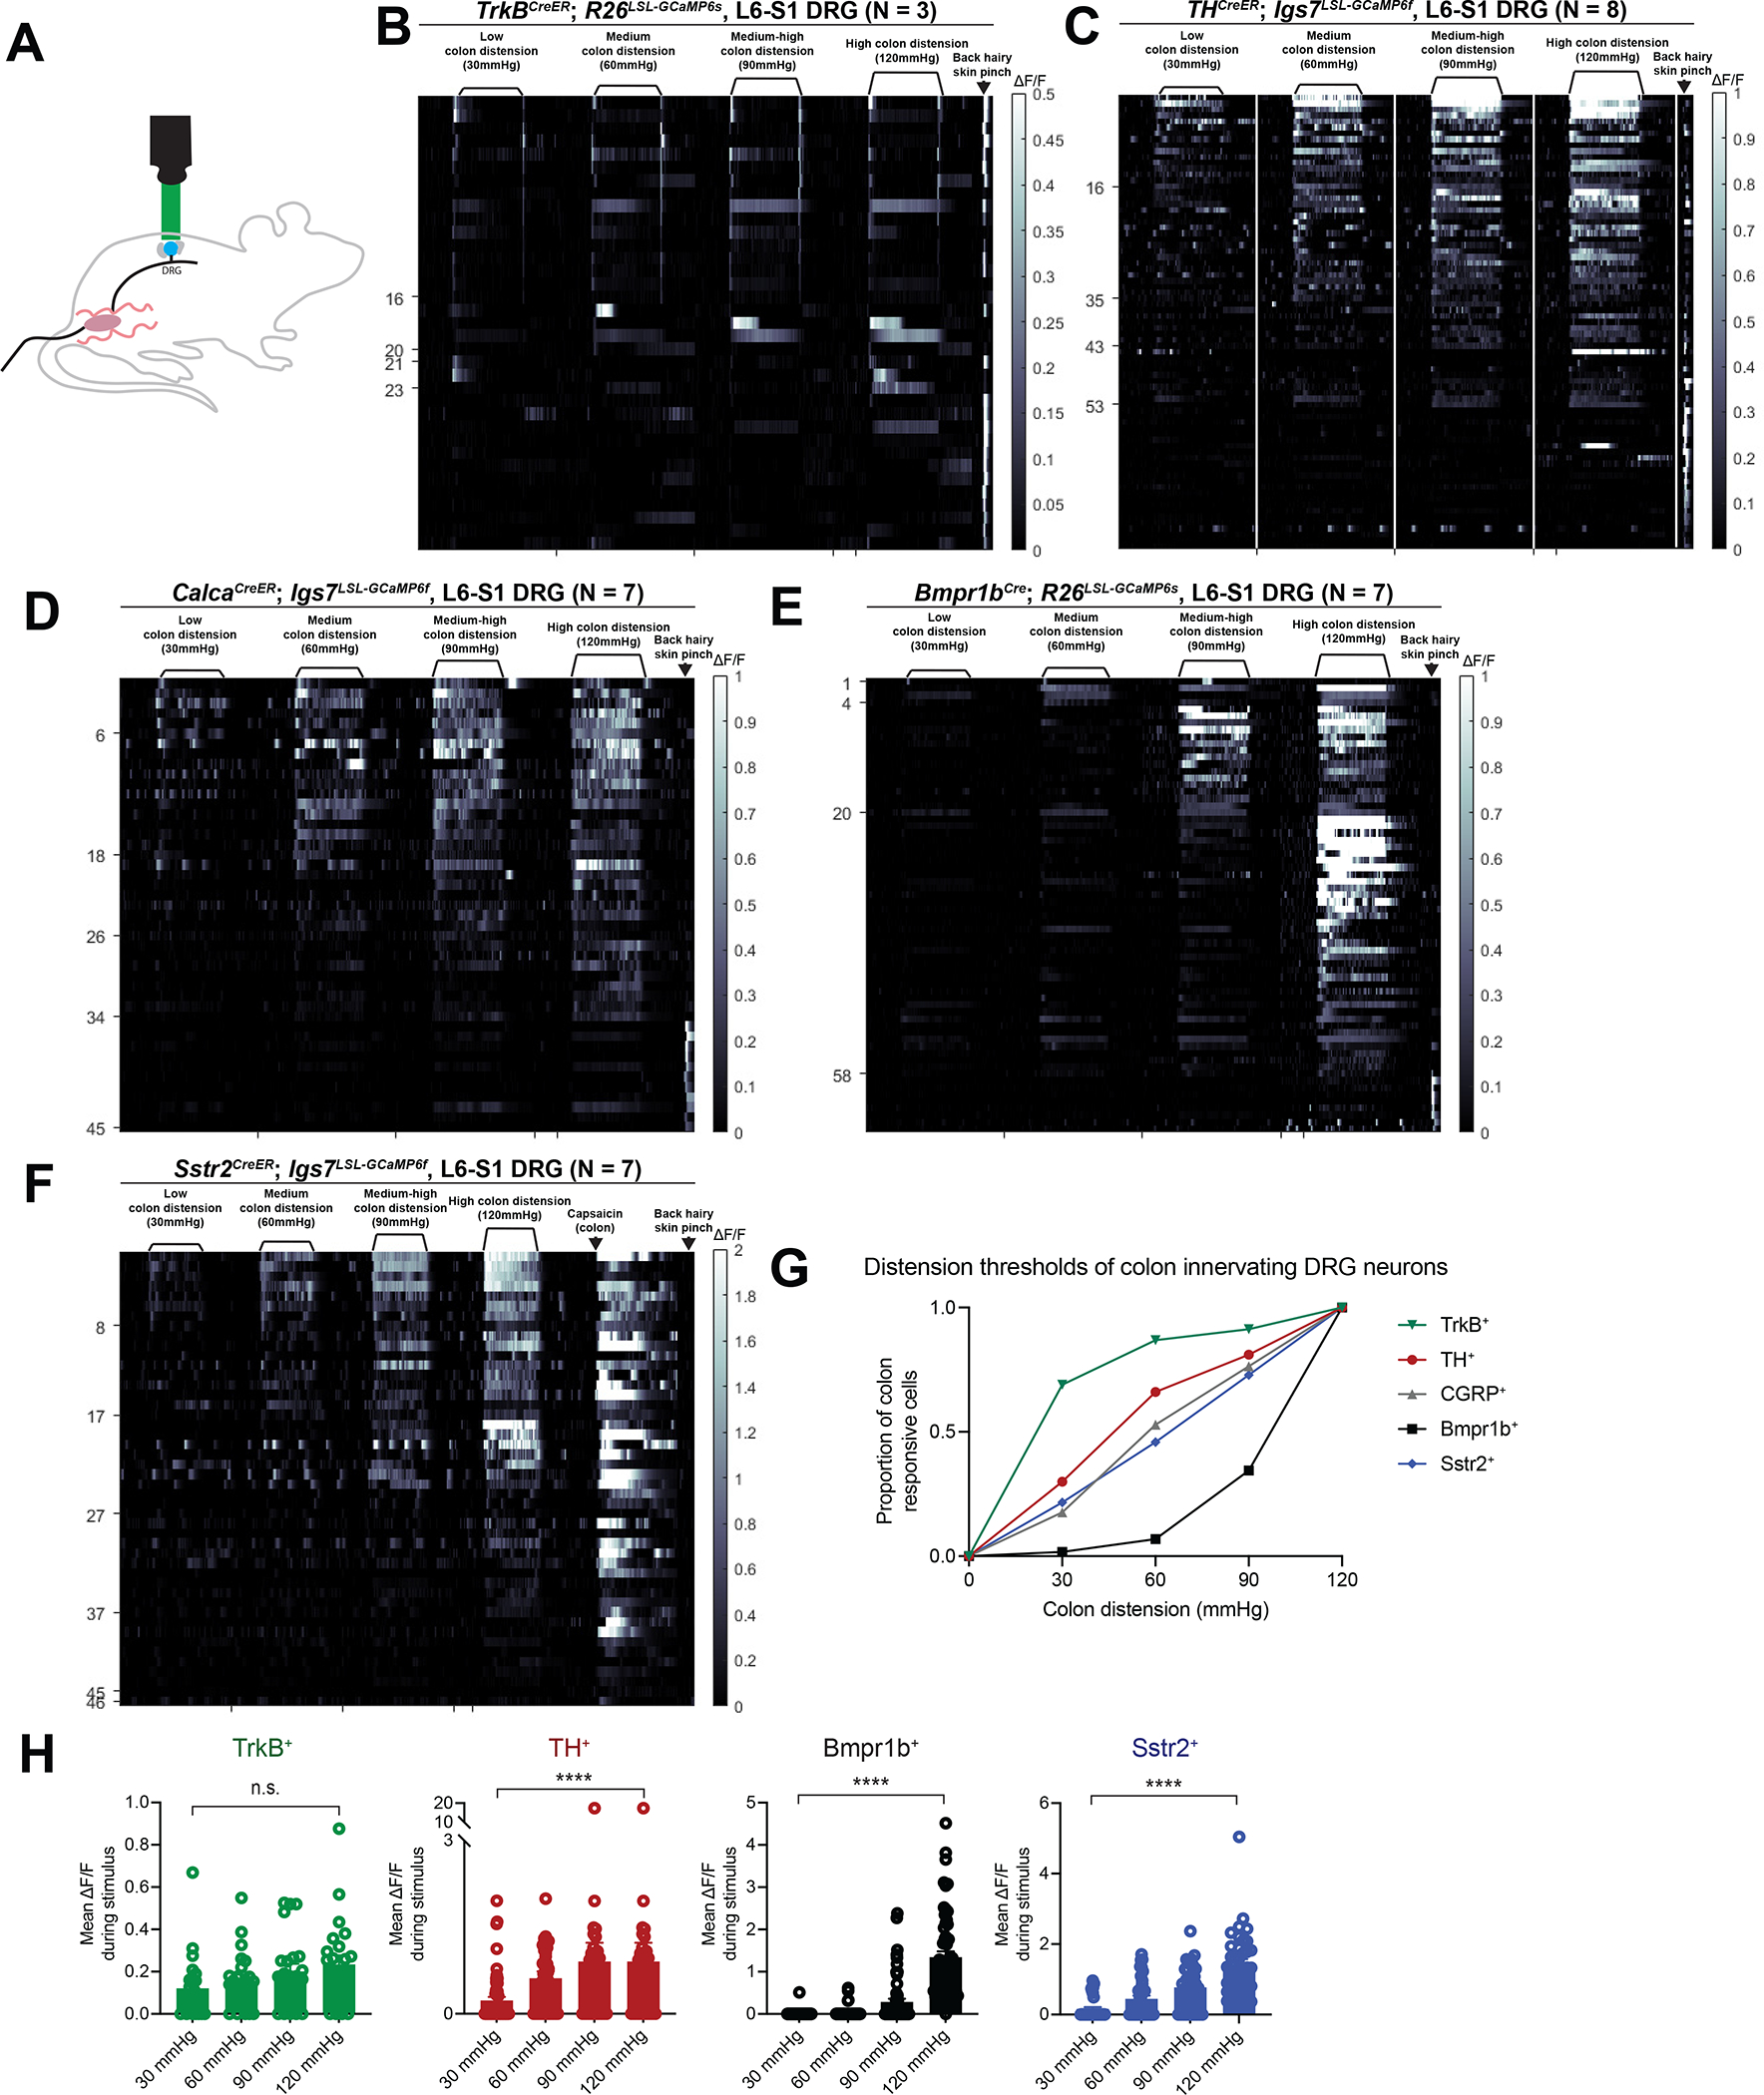
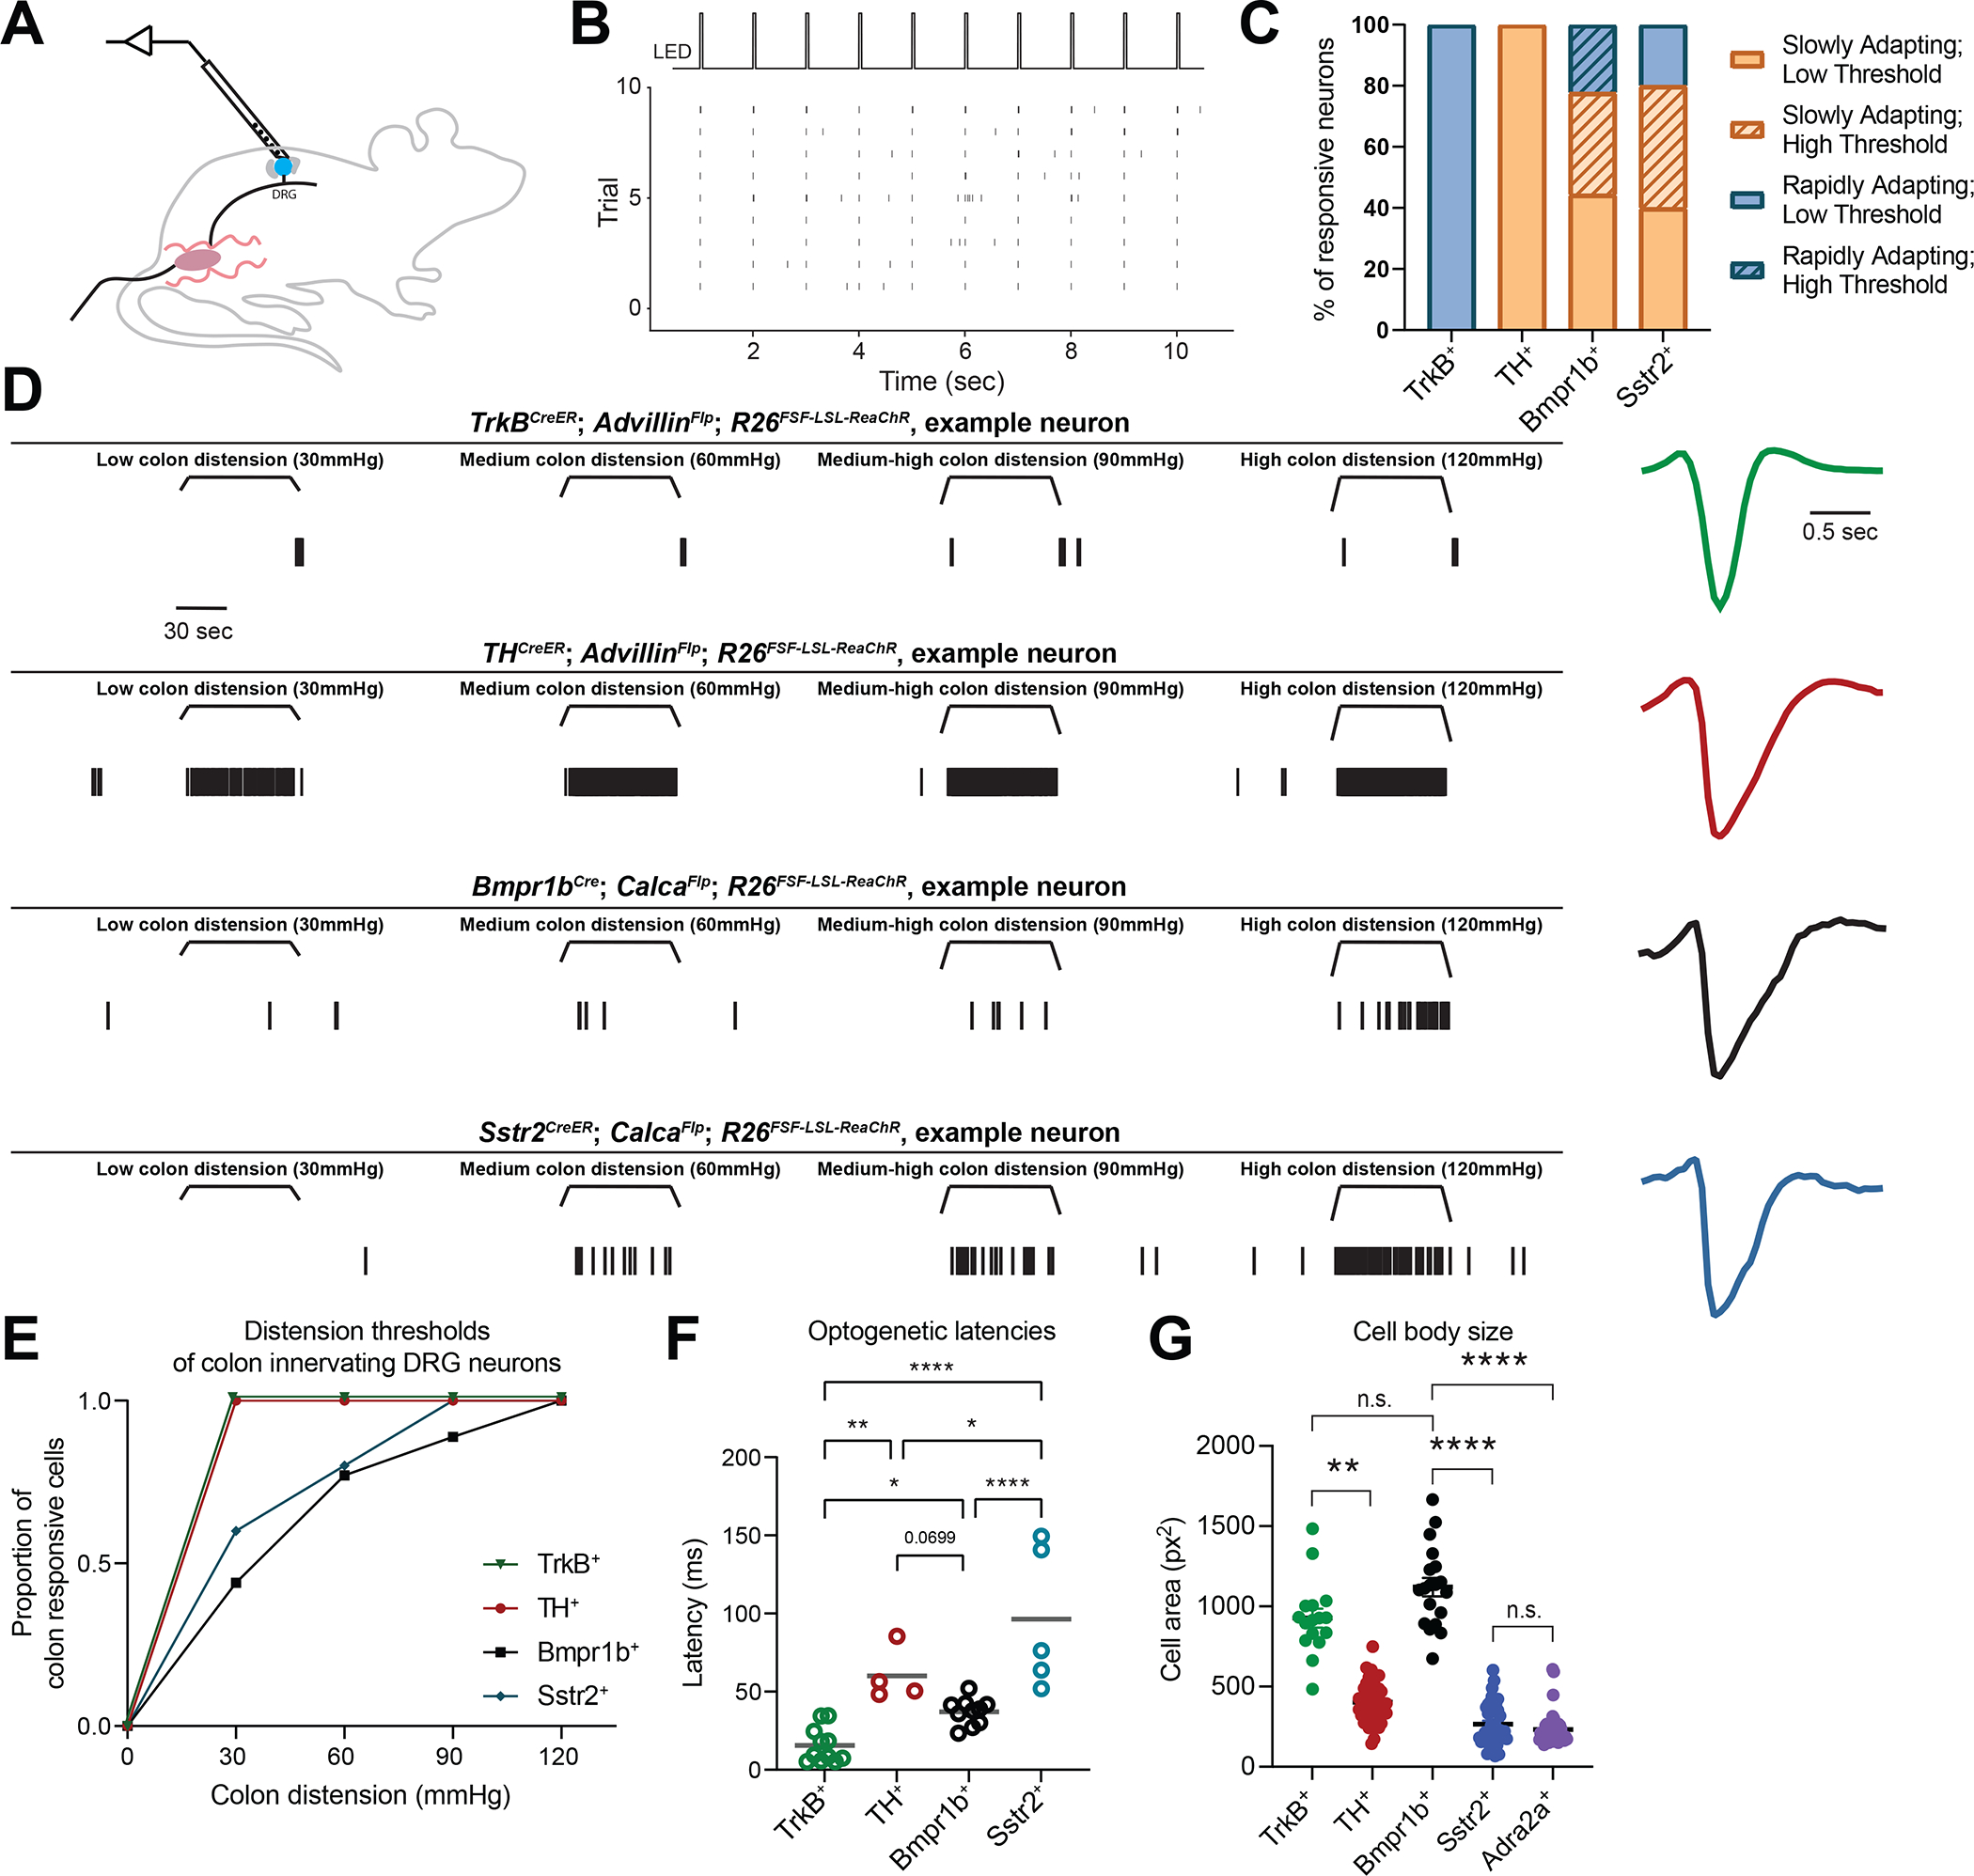
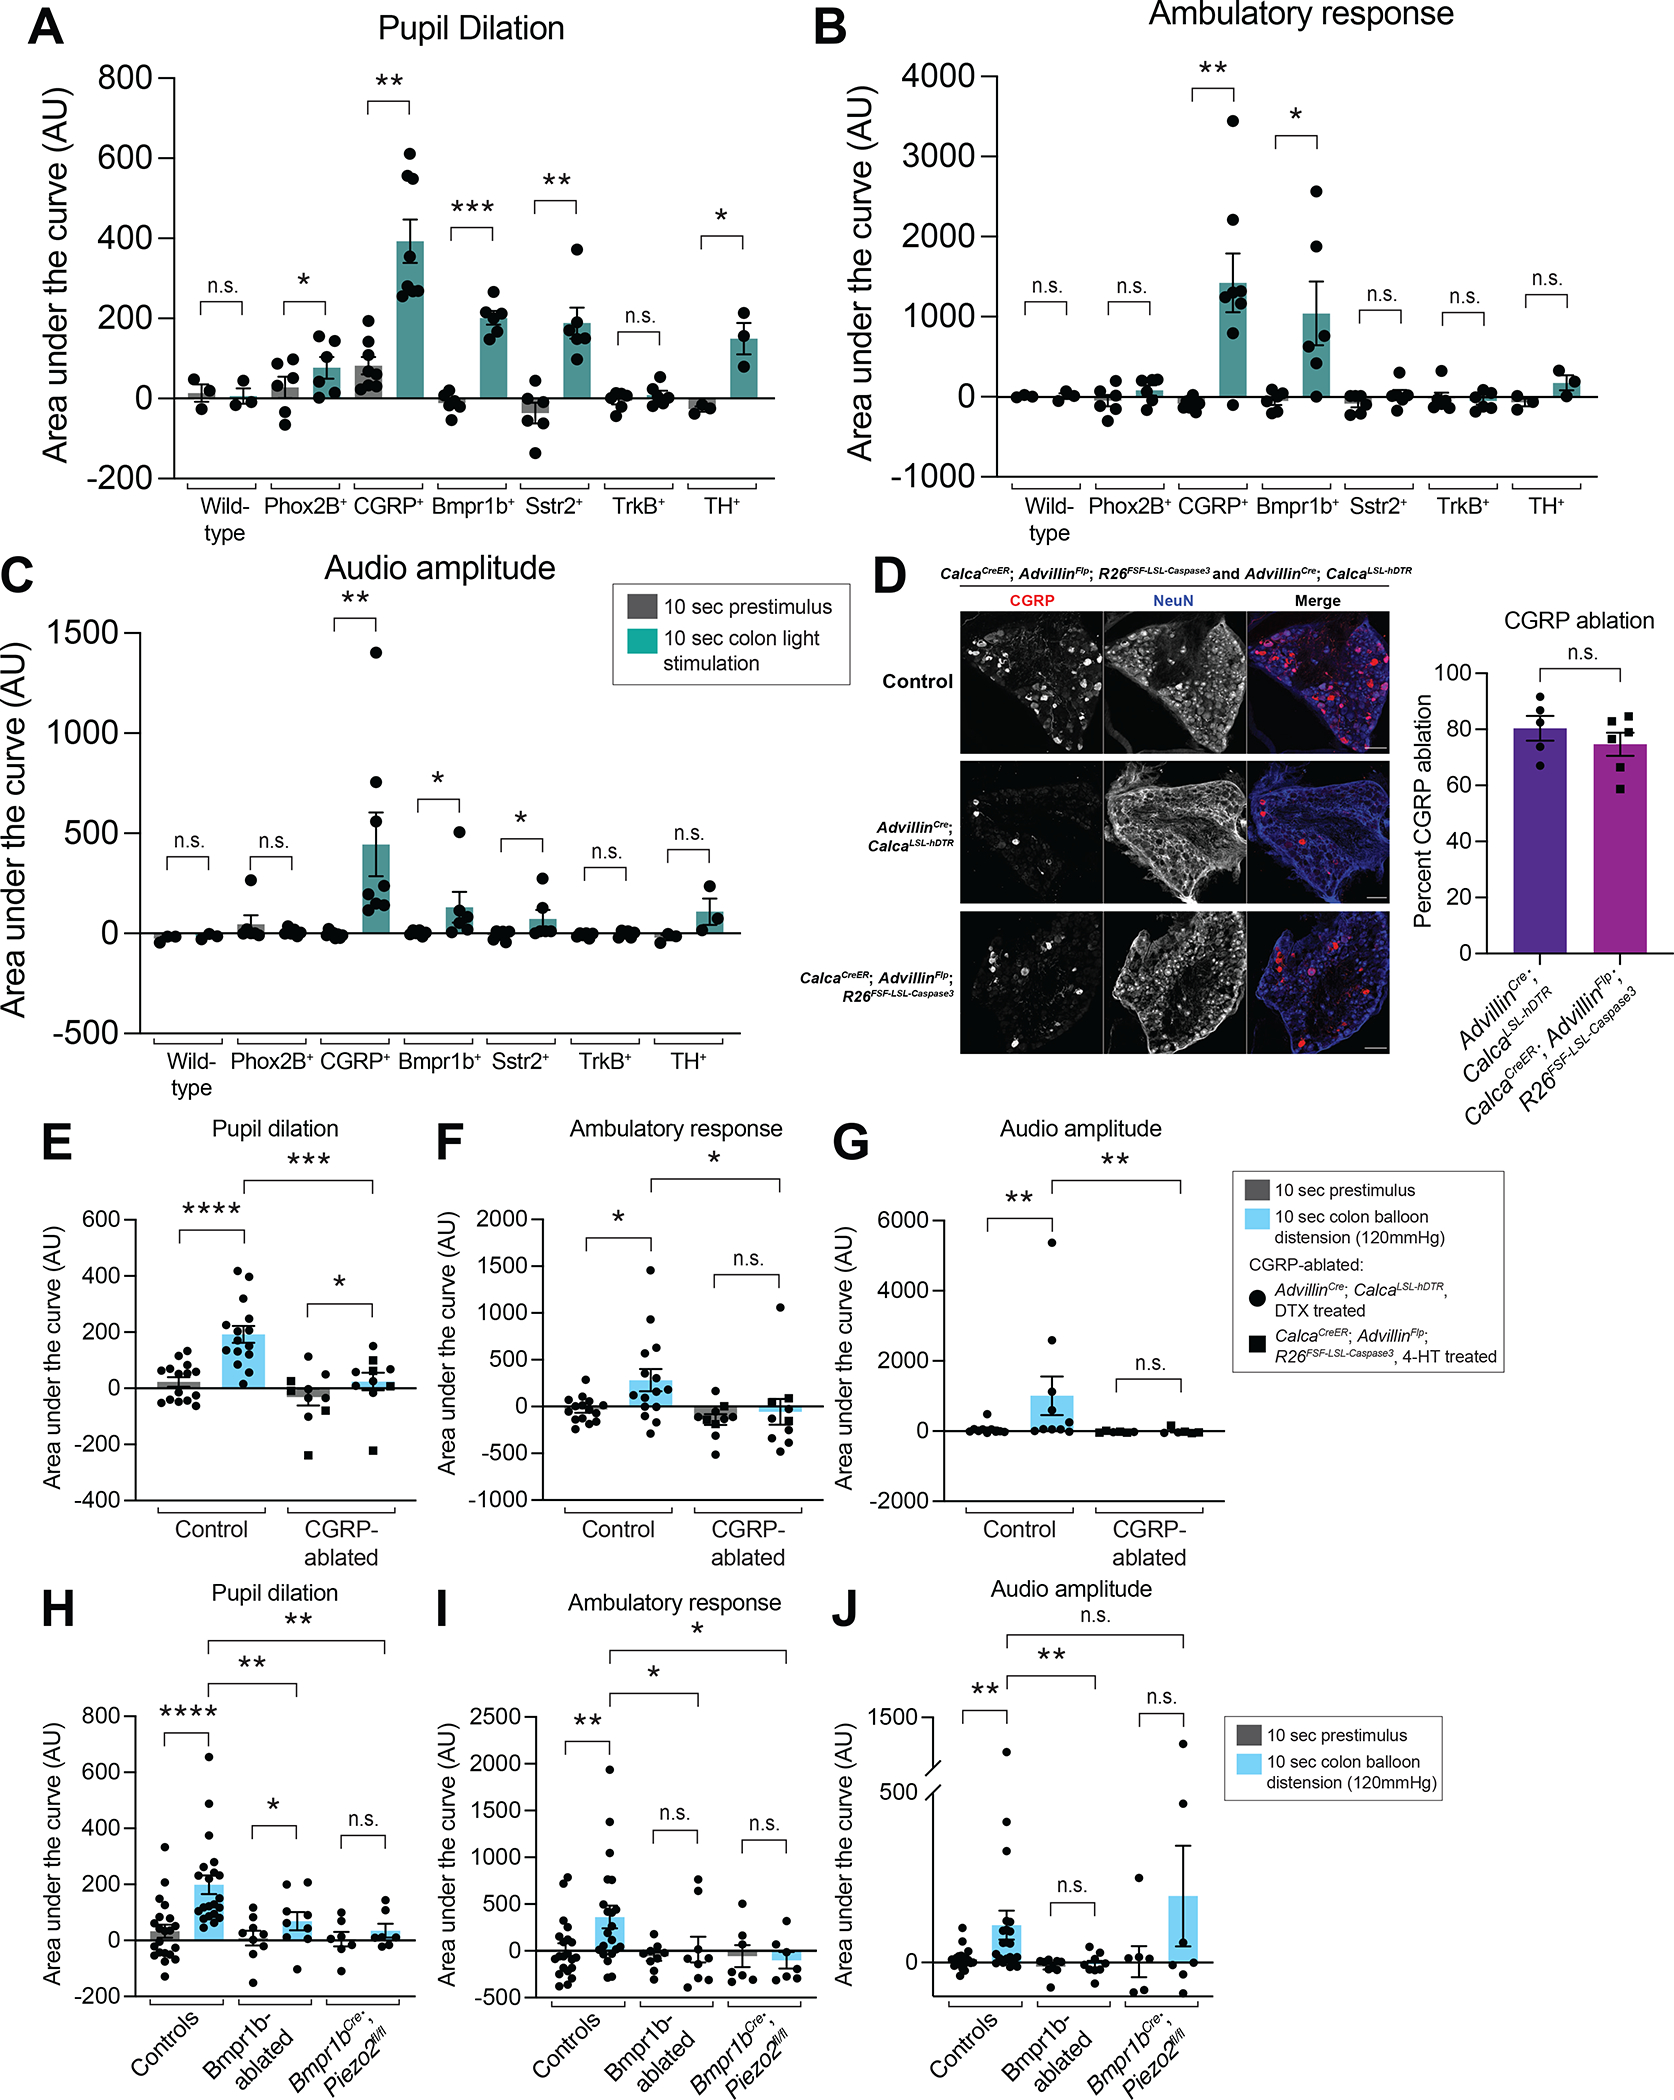
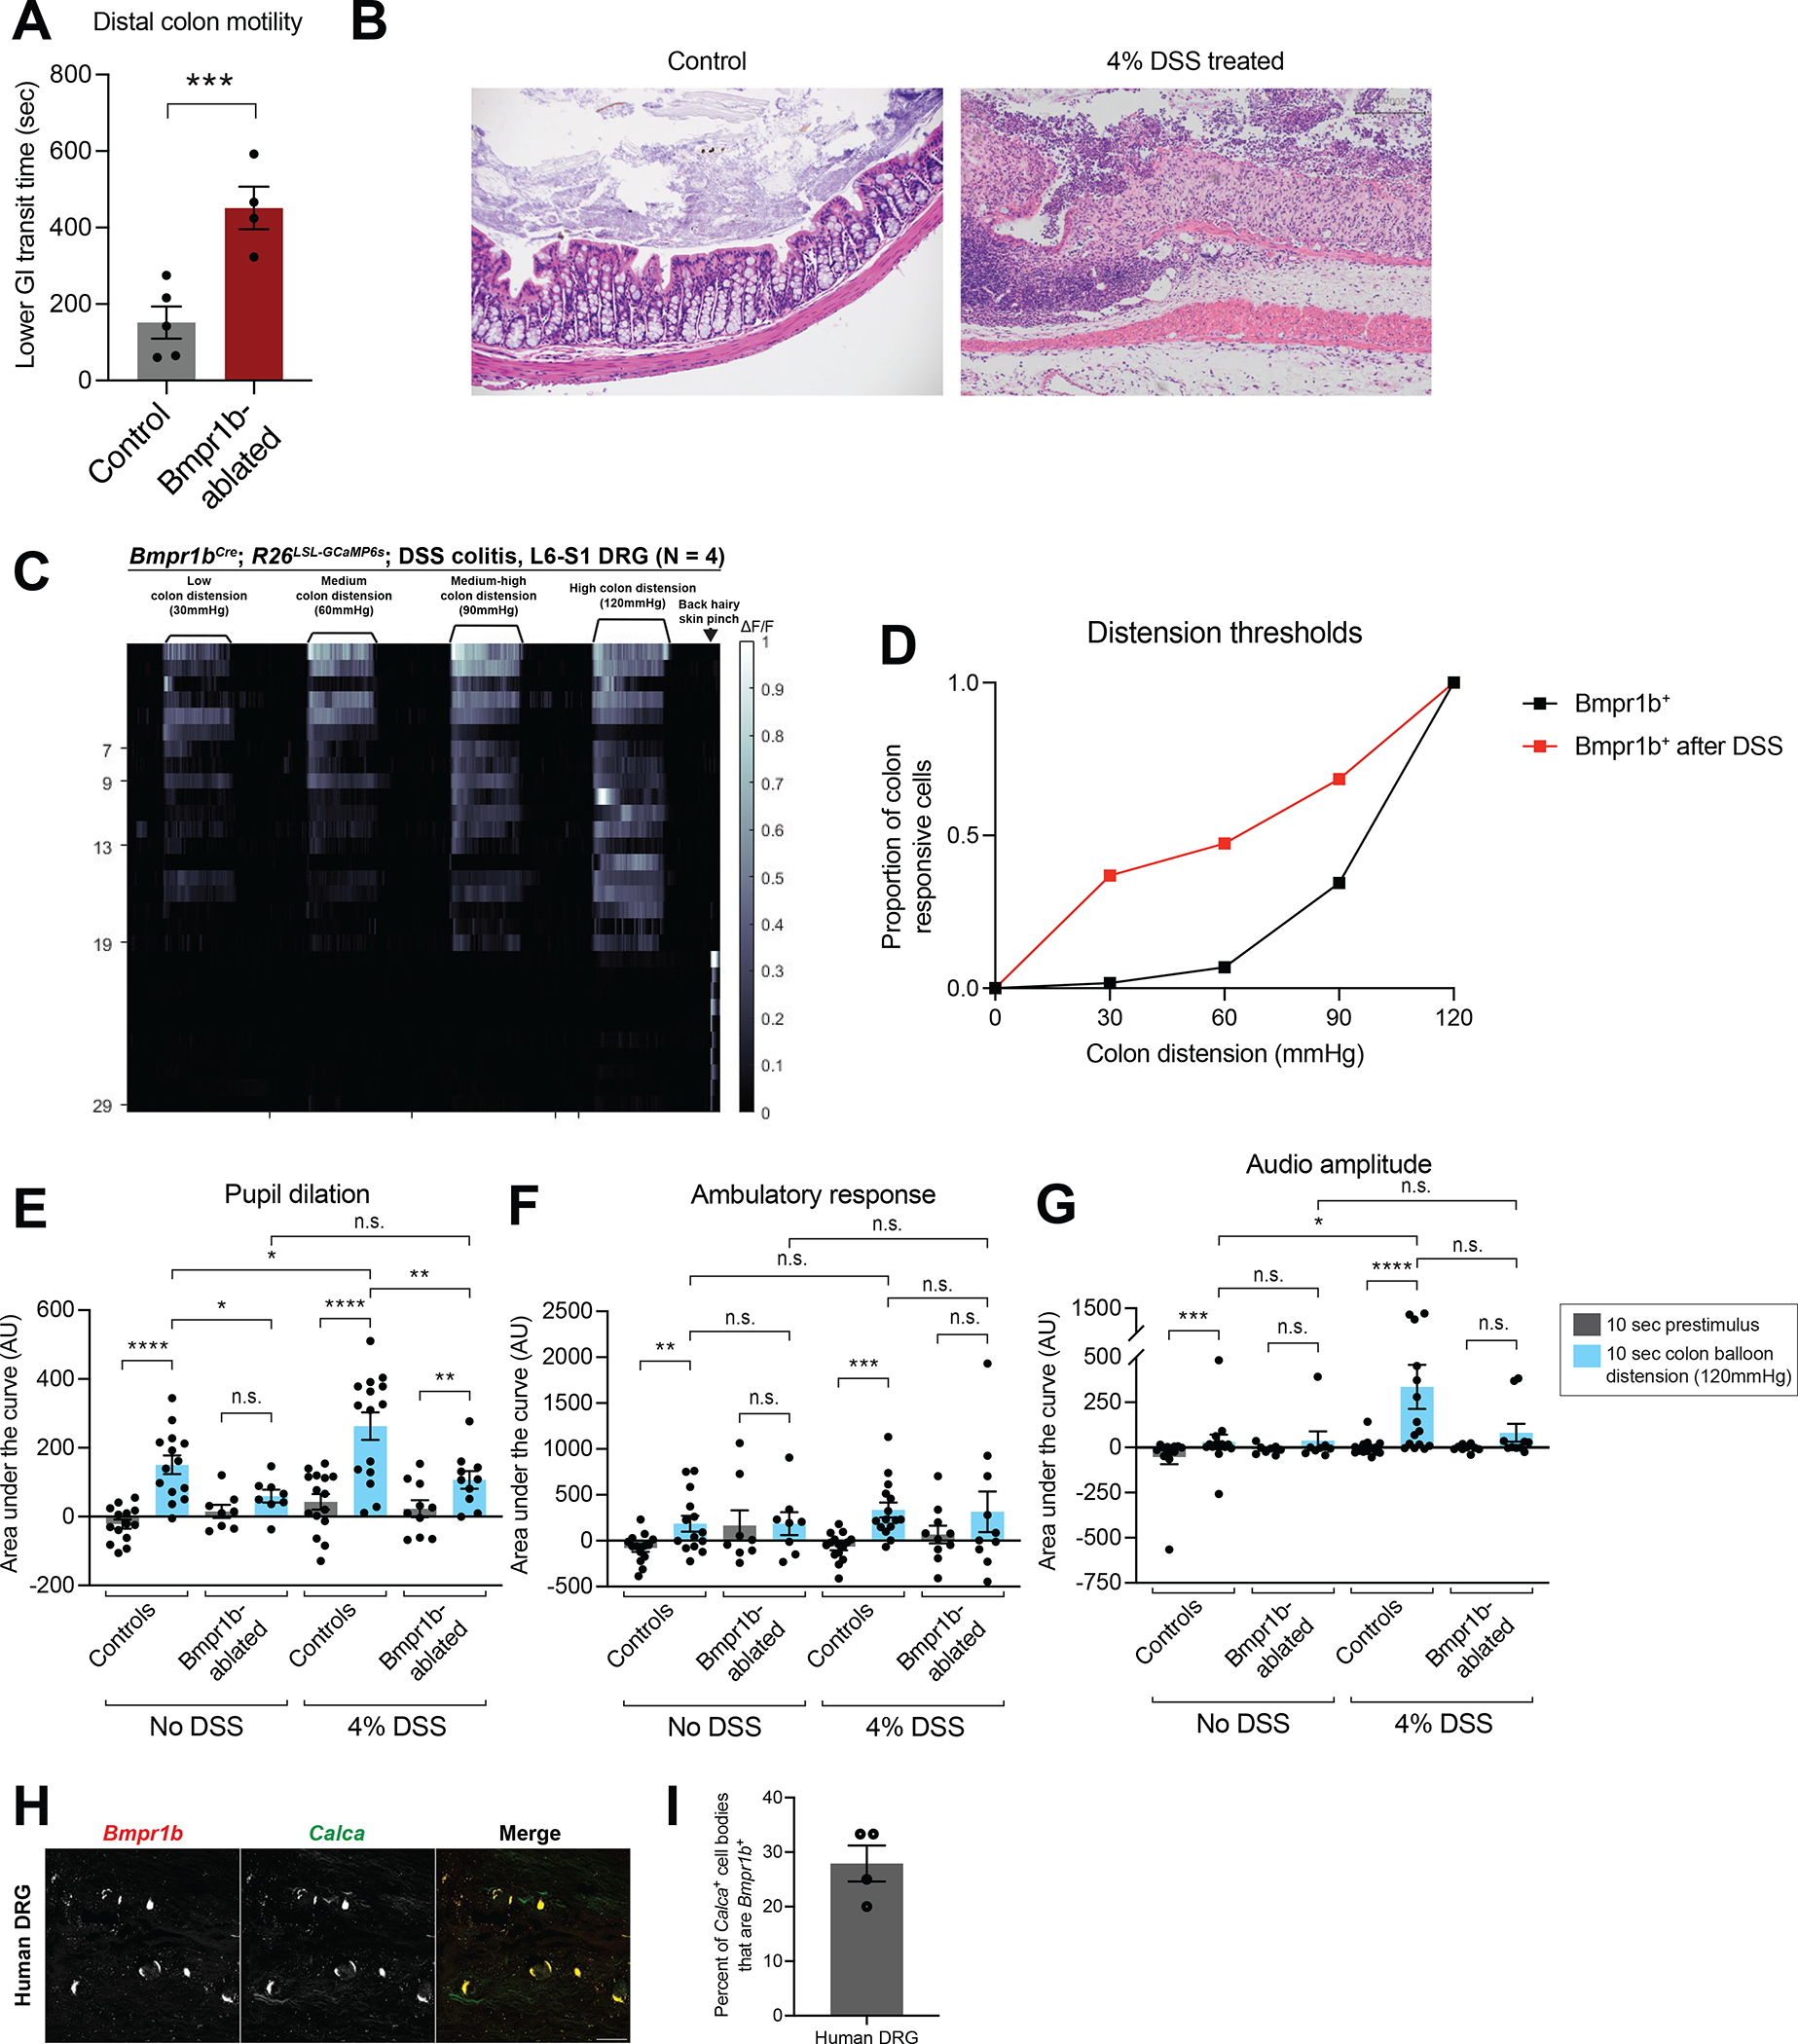
The properties of dorsal root ganglia (DRG) neurons that innervate the distal colon are poorly defined, hindering our understanding of their roles in normal physiology and gastrointestinal (GI) disease. Here, we report genetically defined subsets of colon-innervating DRG neurons with diverse morphologic and physiologic properties. Four colon-innervating DRG neuron populations are mechanosensitive and exhibit distinct force thresholds to colon distension. The highest threshold population, selectively labeled using Bmpr1b genetic tools, is necessary and sufficient for behavioral responses to high colon distension, which is partly mediated by the mechanosensory ion channel Piezo2. This Aδ-HTMR population mediates behavioral over-reactivity to colon distension caused by inflammation in a model of inflammatory bowel disease. Thus, like cutaneous DRG mechanoreceptor populations, colon-innervating mechanoreceptors exhibit distinct anatomical and physiological properties and tile force threshold space, and genetically defined colon-innervating HTMRs mediate pathophysiological responses to colon distension, revealing a target population for therapeutic intervention.

Keywords: colon; dorsal root ganglia; inflammatory pain; mechanosensation; sensory physiology.


Conflict of interest statement

Declaration of interests The authors declare no competing interests.

Figures

Figure 1:
Figure 1:. DRG afferents with distinct morphological and physiological properties innervate the distal colon and mediate Piezo2-dependent behavioral responses to colon distension
A: Whole mount immunostaining of skin and distal colon from Advillin-CreER; Phox2B-Flp; R26FRT-LSL-ChR2-YFP-FRT mice (1mg tamoxifen at P10; sacrificed at 6 weeks). Note that the GFP antibody labels YFP-expressing cells. B: AAV2-retro-hSyn-FlpO virus injection into the L6 dorsal horn (DH) of Advillin-CreER; R26FSF-LSL-tdTomato mice to sparsely label DRG afferent terminals in the distal colon (1mg tamoxifen at P5; sacrificed at 6 weeks). All scale bars are 100 μm unless otherwise specified. C: Example raster plots of single units from L6-S1 DRG multielectrode array (MEA) recordings. The top unit is classified as low-threshold rapidly adapting, followed by a low-threshold slowly adapting unit; the third unit is high-threshold rapidly adapting; the bottom unit is high-threshold slowly adapting. D: Quantification of the number of units in each category from L6-S1 DRG MEA recordings (data from N = 14 mice, ~4 MEA penetrations per DRG per mouse). E-G: The behavioral response to intracolonic high-threshold balloon distension in Cdx2-Cre; Piezo2fl/fl animals, measured by pupil dilation (E), movement (F), and vocalizations (G) (N = 9 mice per group; paired and unpaired t test for pupil dilation and accelerometer data; Mann-Whitney and Wilcoxon matched-pairs signed rank test for vocalization data). The following symbols are used in this and subsequent figures for P values: n.s., not significant; *, P < 0.05; **, P < 0.01; ***, P < 0.001; ****, P < 0.0001.
Figure 2:
Figure 2:. Five transcriptionally distinct DRG afferent subtypes that innervate the colon
Whole mount immunostaining in skin, stomach, duodenum, distal colon, or DRGs from (A) MrgprdCreER; Phox2B-Flp; R26FRT-LSL-tdTomato-FRT mice (1mg tamoxifen at P7); (B) TrkBCreER; AdvillinFlp; R26FSF-LSL-tdTomato mice (0.5mg tamoxifen at P5); (C) THCreER; Phox2B-Flp; R26FRT-LSL-tdTomato-FRT mice (0.5mg tamoxifen at P23); (D) CalcaCreER; R26LSL-tdTomato mice (1mg tamoxifen at P11); (E) Mrgpra3-Cre; AdvillinFlp; R26FSF-LSL-tdTomato mice; (F) Mrgprb4Cre; AdvillinFlp; R26FSF-LSL-tdTomato mice; (G) Smr2Cre; R26FRT-LSL-tdTomato-FR mice T; (H) Bmpr1bCre; Calca-Flp; R26FSF-LSL-tdTomato mice; (I) Sstr2CreER; Calca-Flp; R26FSF-LSL-ReaChR-mCitrine mice (2mg tamoxifen at P21) (top 2 panels); Sstr2CreER; Calca-Flp; R26FSF-LSL-tdTomato mice (0.5mg tamoxifen at P22) (bottom 2 panels); and (J) Adra2aCreER; Calca-Flp; R26FSF-LSL-tdTomato mice (4mg tamoxifen at P14 and P16). Animals were sacrificed at 3–6 weeks. All scale bars are 100 μm unless otherwise specified. K: Quantification of density of fibers labeling the stomach, duodenum, or colon (at the level of either the myenteric or submucosal plexus) in the five colon-innervating populations. Quantified from at least 3 images from at least N = 2 animals. Comparisons are stomach, duodenum, or colon (submucosal plexus) each compared to colon (myenteric plexus) using an unpaired t test.
Figure 3:
Figure 3:. Five DRG neuron subtypes with distinct morphologies innervate the distal colon
A-E: Tracings of whole mount immunofluorescence from (A) TrkBCreER; AdvillinFlp; R26FSF-LSL-tdTomato mice (0.005mg tamoxifen at P5); (B) THCreER; Phox2B-Flp; R26FRT-LSL-tdTomato-FRT mice (0.1mg tamoxifen at P24); (C) Bmpr1bCreER; Calca-Flp; R26FSF-LSL-tdTomato mice (1–3mg tamoxifen at P21); (D) Sstr2CreER; Calca-Flp; R26FSF-LSL-tdTomato mice (0.05mg tamoxifen at P21); and (E) Adra2aCreER; Calca-Flp; R26FSF-LSL-tdTomato mice (1mg tamoxifen P21–25 and 4mg 8 weeks), all treated with low amounts of tamoxifen to achieve sparse labeling. Animals were sacrificed after P21 and at least 2 weeks after last tamoxifen dose. All scale bars are 100 μm unless otherwise specified. F: Graph summarizing ending termination location in the colon wall for the genetically labeled subtypes. G: Graph quantifying myenteric cell body wrappings observed with individual IGVEs by genetic subtype. Each point represents an individual ending. H-J: Graphs quantifying total ending length (H), width (I), or branches (J). Each point represents an individual ending. K: Diagram showing the colonic morphologies of distinct DRG afferent subtypes.
Figure 4:
Figure 4:. Four DRG neuron subtypes display distinct responses to colon distension and collectively tile force threshold space
A: A schematic for the DRG calcium imaging set up. B-F: In vivo DRG calcium imaging responses to colon distension in (B) TrkBCreER; R26LSL-GCaMP6s mice (N = 3; 0.5mg tamoxifen at P5); (C) THCreER; Igs7LSL-GCaMP6f mice (N = 8; 1–2mg tamoxifen at P21); (D) CalcaCreER; Igs7LSL-GCaMP6f mice (N = 7; 0.5 mg tamoxifen at P8–9); (E) Bmpr1bCre; R26LSL-GCaMP6s mice (N = 7); (F) and Sstr2CreER; Igs7LSL-GCaMP6f mice (N = 7; 1mg tamoxifen at P24). G: Graph depicting the distension thresholds of all colon innervating populations based on calcium imaging. H: Mean calcium activation (ΔF/F) during the distension stimulus for each cell type from calcium imaging experiments. Analyses were performed using repeated-measures ANOVAs and comparisons between low (30mmHg) and high (120mmHg) forces are plotted. See Table S1 for additional statistical details.
Figure 5:
Figure 5:. In vivo electrophysiological response properties of four colon innervating DRG neuron populations
A: A schematic of the DRG multielectrode array (MEA) set up. B: Example raster plot showing light-evoked responses of an opto-tagged neuron. C: Percent of neurons with different electrophysiological responses to colon distension in each genetic subtype. D: In vivo electrophysiological responses of one representative example neuron from each genetic class. Raster plot on the left; normalized extracellular action potential waveform on the right. E: Graph depicting the distension thresholds of all colon innervating populations based on MEA recordings. F: Optogenetic latency by genetic subtype. Each point represents one neuron. TrkB+ units in green (n = 7 cells from N = 6 mice); TH+ units in red (n = 4 cells from N = 8 mice); Bmpr1b+ units in black (n = 10 cells from N = 5 mice); and Sstr2+ units in blue (n = 5 cells from N = 5 mice). Comparisons performed using a one-way ANOVA [F(3, 26)= 4.518, p <0.0001] with post-hoc Holm-Šídák’s tests. G: Cell size quantification of each of the colon-innervating from ISH. TrkB+ (n = 16 cells from N = 3 DRG), TH+ (n = 48 cells from N = 3 DRG), Bmpr1b+ (n = 18 cells from N = 3 DRG), Sstr2+ (n = 41 cells from N = 3 DRG), and TH+ (n = 42 cells from N = 3 DRG). Analyses were performed using a one-way ANOVA and relevant comparisons are plotted. See Table S1 for additional statistical details.
Figure 6:
Figure 6:. The Bmpr1b+ Aδ-HTMR population is necessary and sufficient to drive a behavioral response to colon stimulation
A-C: Behavioral responses (pupil dilation (A), movement (B), and vocalizations (C)) to colonic optogenetic stimulation of wild-type mice (N = 3), Phox2B-Flp; R26FSF-mCitrine-ReaChR mice (N = 6), Calca-Flp; R26FSF-ReaChR or CalcaCreER; R26FRT-LSL-ChR2-YFP-FRT (1mg tamoxifen at P12) mice (N = 8), Bmpr1bCre; Calca-Flp; R26FSF-LSL-mCitrine-ReaChR mice (N = 6), Sstr2CreER; Calca-Flp; R26FSF-LSL-mCitrine-ReaChR or Sstr2CreER; R26LSL-mCitrine-ReaChR mice (N = 6; 2mg tamoxifen at P21), TrkBCreER; AdvillinFlp; R26FSF-LSL-mCitrine-ReaChR mice (N = 6; 0.5mg tamoxifen at P5), and THCreER; Phox2B-Flp; R26FRT-LSL-ChR2-YFP-FRT mice (N = 3; 1mg tamoxifen at P9). All comparisons are paired t tests except for the vocalization data for the Phox2B-Flp; R26FSF-mCitrine-ReaChR mice, Calca-Flp; R26FSF-ReaChR or CalcaCreER; R26FRT-LSL-ChR2-YFP-FRT mice, Bmpr1bCre; Calca-Flp; R26FSF-LSL-mCitrine-ReaChR mice, and Sstr2CreER; Calca-Flp; R26FSF-LSL-mCitrine-ReaChR or Sstr2CreER; R26LSL-mCitrine-ReaChR mice, which were analyzed using the Wilcoxon matched-pairs signed rank test. D: DRG whole mount immunofluoresence in control and CGRP-ablated animals (either AdvillinCre; CalcaLSL-hDTR, DTX treated or AdvillinFlp; CalcaCreER; R26FSF-LSL-Caspase3, 2mg tam daily P21-P23). Quantification of the percent CGRP ablation with the two methods shown in the right panel (N = 5 animals for AdvillinCre; CalcaLSL-hDTR, DTX treated and N = 6 animals for AdvillinFlp; CalcaCreER; R26FSF-LSL-Caspase3, 2mg tam daily P21-P23, unpaired t test for comparison). E-G: Behavioral responses (pupil dilation (E), movement (F), and vocalizations (G)) to high force colon balloon distension in CGRP-ablated animals, compared to controls. Each point represents the average of data from an individual animal. (N = 15 for controls for pupil dilation and accelerometer and 10 for vocalization; N = 10 for CGRP-ablated (6 of which are AdvillinCre; CalcaLSL-hDTR, DTX treated (black circles) and 4 of which AdvillinFlp; CalcaCreER; R26FSF-LSL-Caspase3, 2mg tam daily P21-P23 (black squares) for pupil dilation and accelerometer and N = 6 for CGRP-ablated (2 of which are AdvillinCre; CalcaLSL-hDTR, DTX treated (black circles) and 4 of which AdvillinFlp; CalcaCreER; R26FSF-LSL-Caspase3, 2mg tam daily P21-P23 (black squares) for vocalization (note there are fewer animals for the vocalization data because a subset of the animals were run in a previous version of the setup with a different microphone). Comparisons for the pupil dilation and accelerometer data are paired t tests for the control, Wilcoxon matched-pairs signed rank tests for the CGRP-ablated, and Mann Whitney tests for the unpaired comparisons. Comparisons for the vocalization data are Wilcoxon matched-pairs signed rank tests for the paired comparisons and a Mann Whitney test for the unpaired comparison). H-J: Behavioral responses (pupil dilation (H), movement (I), and vocalizations (J)) to high force colon balloon distension in Bmpr1b-ablated or Bmpr1bCre; Piezo2fl/fl animals, compared to controls. Each point represents the average of data from an individual animal. (N = 21 for controls; N = 9 for Bmpr1b-ablated; N = 7 for Bmpr1bCre; Piezo2fl/fl. Comparisons for pupil dilation data are Wilcoxon matched-pairs signed rank tests for the control and Bmpr1bCre; Piezo2fl/fl paired groups, a t test for the Bmpr1b-ablated paired groups, and Mann Whitney tests for unpaired groups. Comparisons for accelerometer and vocalization data are Wilcoxon matched-pairs signed rank test for paired groups and Mann Whitney tests for unpaired groups).
Figure 7:
Figure 7:. Bmpr1b+ Aδ-HTMRs are necessary for colon physiology and inflammation-induced colonic mechanical hypersensitivity
A: Distal colon motility in controls and Bmpr1b+ neuron-ablated animals. B: Colon hematoxylin and eosin (H&E) staining in an example control and DSS treated animal. Scale bar is 200 μm. C: In vivo DRG calcium imaging responses to colon distension in Bmpr1bCre; R26LSL-GCaMP6s mice following DSS treatment (N = 4). D: Distension thresholds based on DRG calcium imaging of the Bmpr1b+ population in control or DSS treated animals. Data from Bmpr1bCre; R26LSL-GCaMP6s (N = 7 for control; N = 4 for DSS treated). The control data are replotted from the data shown in Figure 4G. E-G: Behavioral responses (pupil dilation (E), movement (F), and vocalizations (G)) to high force colon balloon distension in Bmpr1b+ neuron-ablated mice or controls. Each point represents the average of data from an individual animal. (N = 14 control without DSS; N = 8 Bmpr1b-ablated without DSS; N = 15 control DSS-treated; N = 10 Bmpr1b-ablated DSS-treated. Comparisons for pupil dilation and accelerometer data are paired and unpaired t tests. Comparisons for vocalization data are Wilcoxon matched-pairs signed rank test for paired groups and Mann Whitney tests for unpaired groups.) H: ISH of a human DRG reveals that some Calca+ DRG neurons are Bmpr1b+. The white arrow indicates a Bmpr1b+; Calca+ cell body. Note that the bright signal in all channels represents lipofuscin, which is commonly observed in ISH of human DRGs. I: Quantification of the percent of Calca+ cell bodies in the human DRG that are Bmpr1b+. Data from N = 4 images.

Comment in

References

    1. Heitmann PT, Vollebregt PF, Knowles CH, Lunniss PJ, Dinning PG, and Scott SM (2021). Understanding the physiology of human defaecation and disorders of continence and evacuation. Nat Rev Gastroenterol Hepatol 18, 751–769. 10.1038/s41575-021-00487-5. - DOI - PubMed
    1. Kim M, Heo G, and Kim SY (2022). Neural signalling of gut mechanosensation in ingestive and digestive processes. Nat Rev Neurosci 23, 135–156. 10.1038/s41583-021-00544-7. - DOI - PubMed
    1. Gebhart GF, and Bielefeldt K (2016). Physiology of Visceral Pain. Compr Physiol 6, 1609–1633. 10.1002/cphy.c150049. - DOI - PubMed
    1. Handler A, and Ginty DD (2021). The mechanosensory neurons of touch and their mechanisms of activation. Nat Rev Neurosci 22, 521–537. 10.1038/s41583-021-00489-x. - DOI - PMC - PubMed
    1. Bai L, Lehnert BP, Liu J, Neubarth NL, Dickendesher TL, Nwe PH, Cassidy C, Woodbury CJ, and Ginty DD (2015). Genetic Identification of an Expansive Mechanoreceptor Sensitive to Skin Stroking. Cell 163, 1783–1795. 10.1016/j.cell.2015.11.060. - DOI - PMC - PubMed

Publication types

LinkOut - more resources