. 2023 Aug 3;186(16):3400-3413.e20.
doi: 10.1016/j.cell.2023.06.010.

A widely distributed gene cluster compensates for uricase loss in hominids

Affiliations

A widely distributed gene cluster compensates for uricase loss in hominids

Yuanyuan Liu et al. Cell. .

Erratum in

  • A widely distributed gene cluster compensates for uricase loss in hominids.
    Liu Y, Jarman JB, Low YS, Augustijn HE, Huang S, Chen H, DeFeo ME, Sekiba K, Hou BH, Meng X, Weakley AM, Cabrera AV, Zhou Z, van Wezel G, Medema MH, Ganesan C, Pao AC, Gombar S, Dodd D. Liu Y, et al. Cell. 2023 Sep 28;186(20):4472-4473. doi: 10.1016/j.cell.2023.08.036. Cell. 2023. PMID: 37774682 Free PMC article.

Abstract

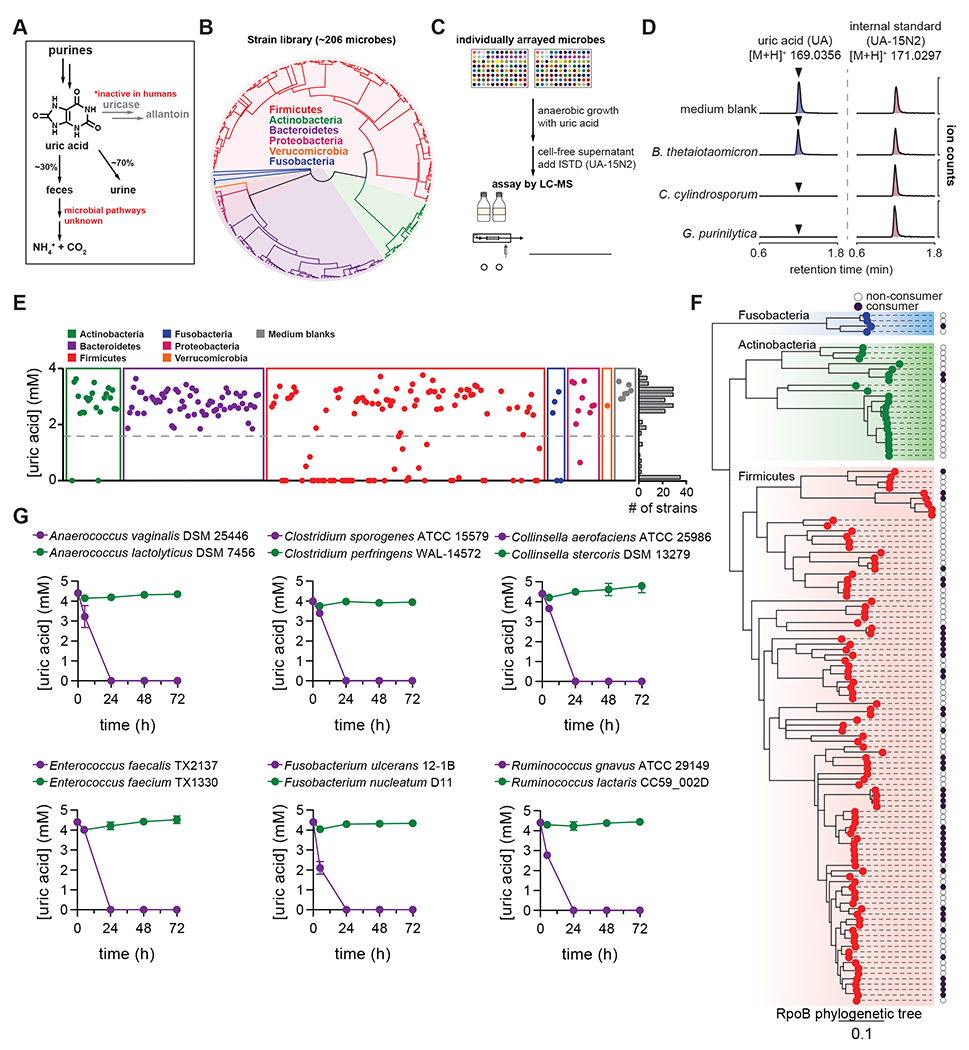
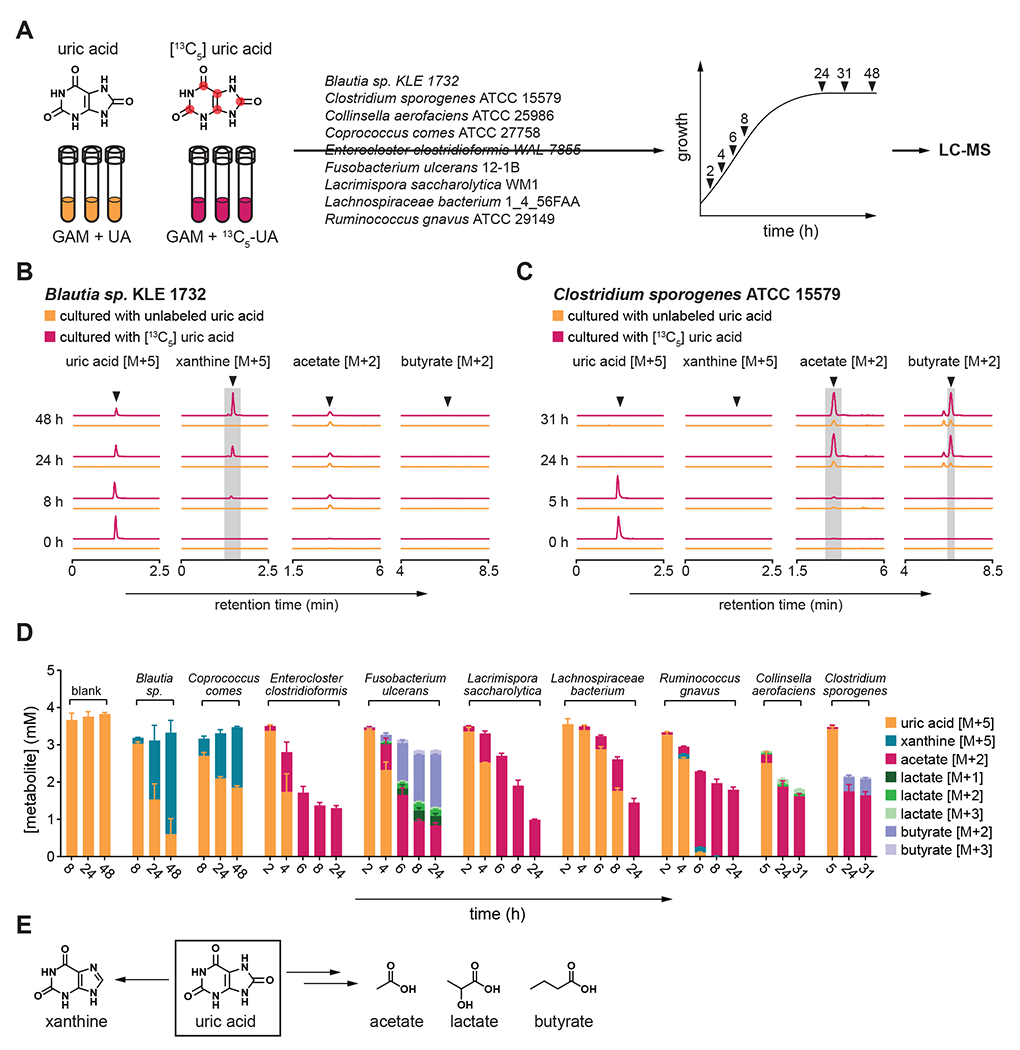
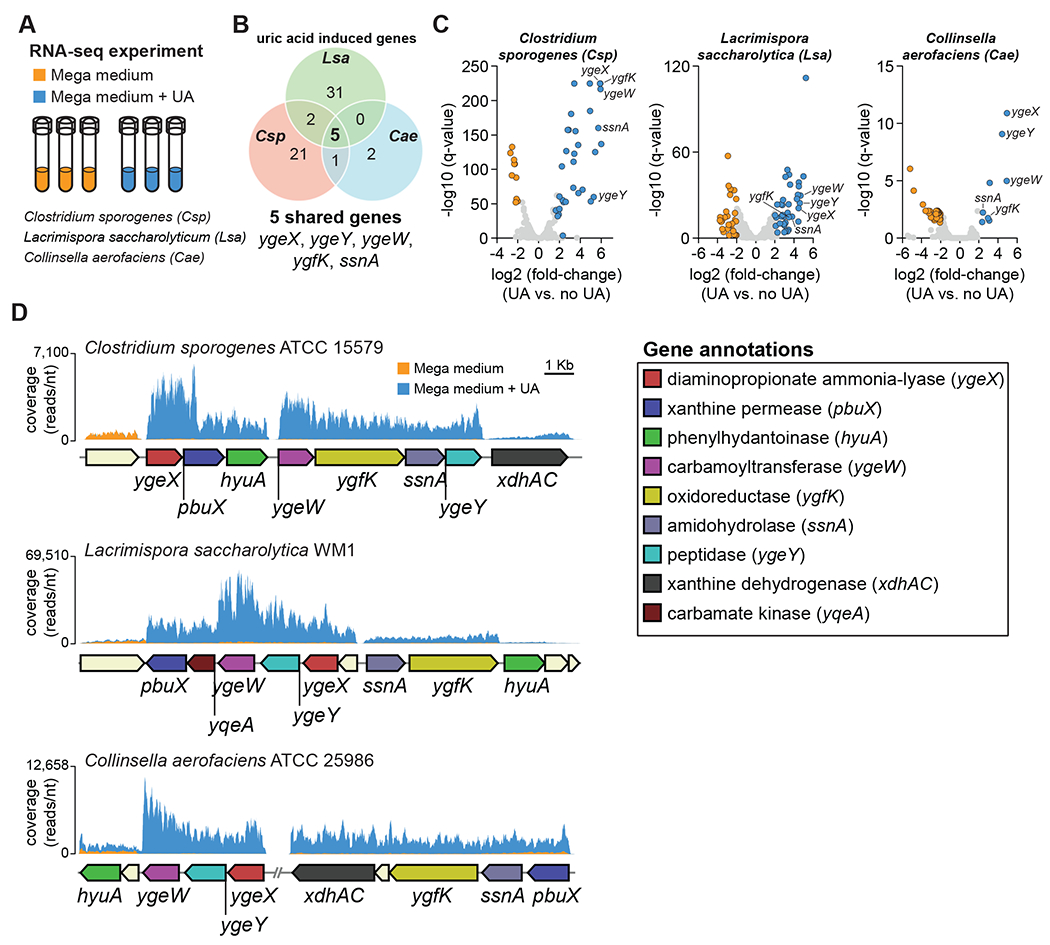
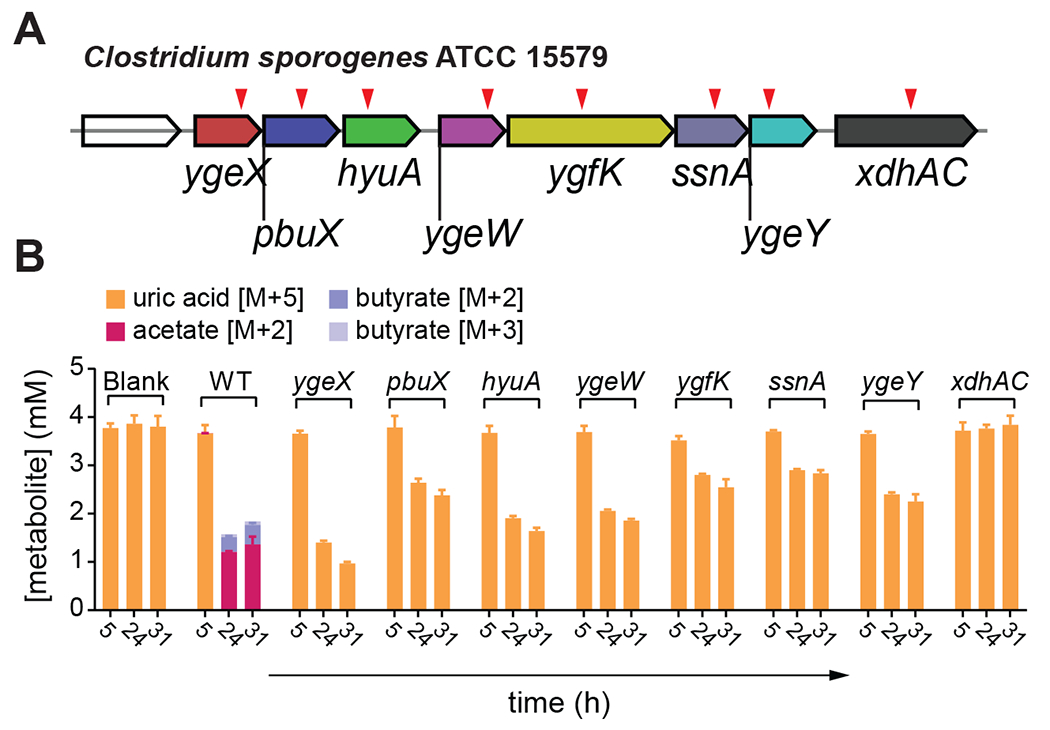
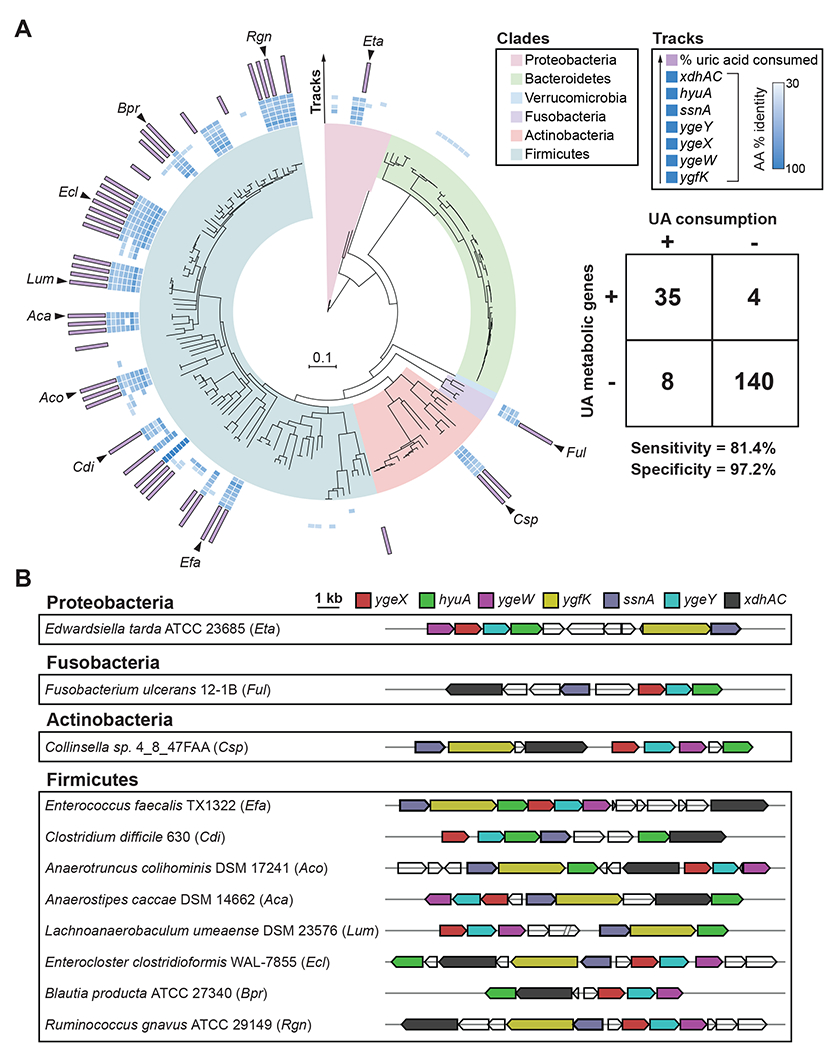
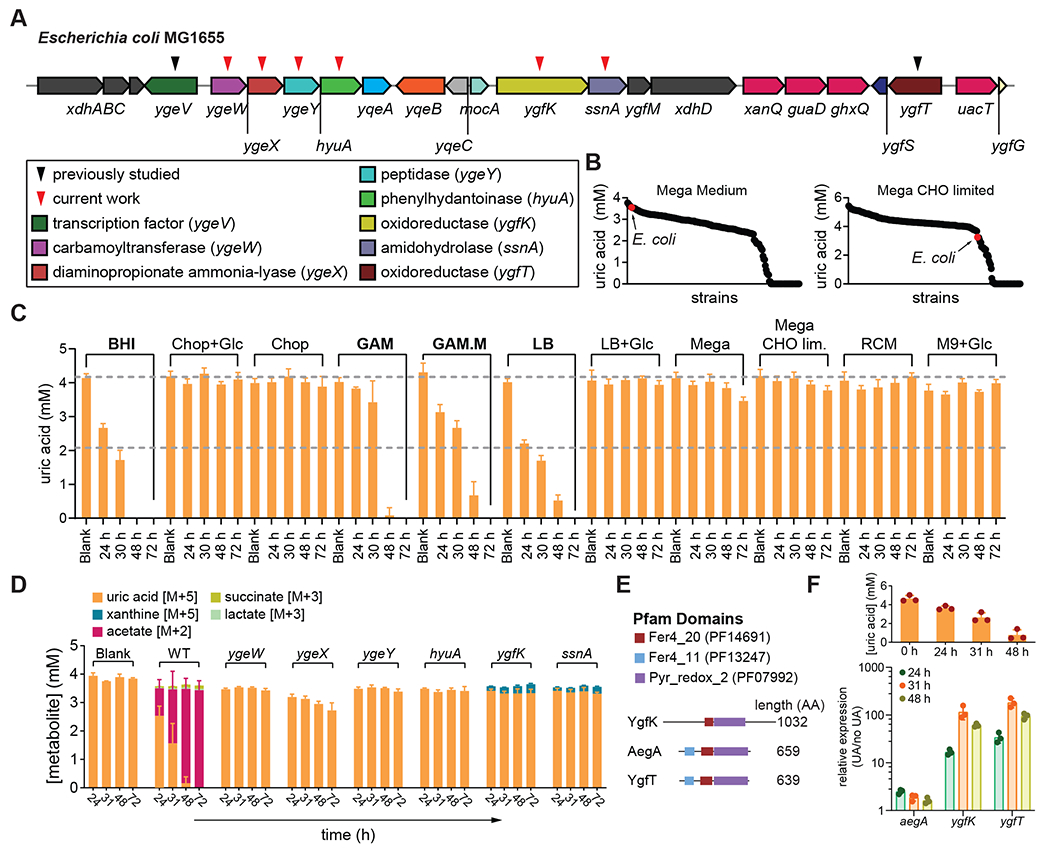
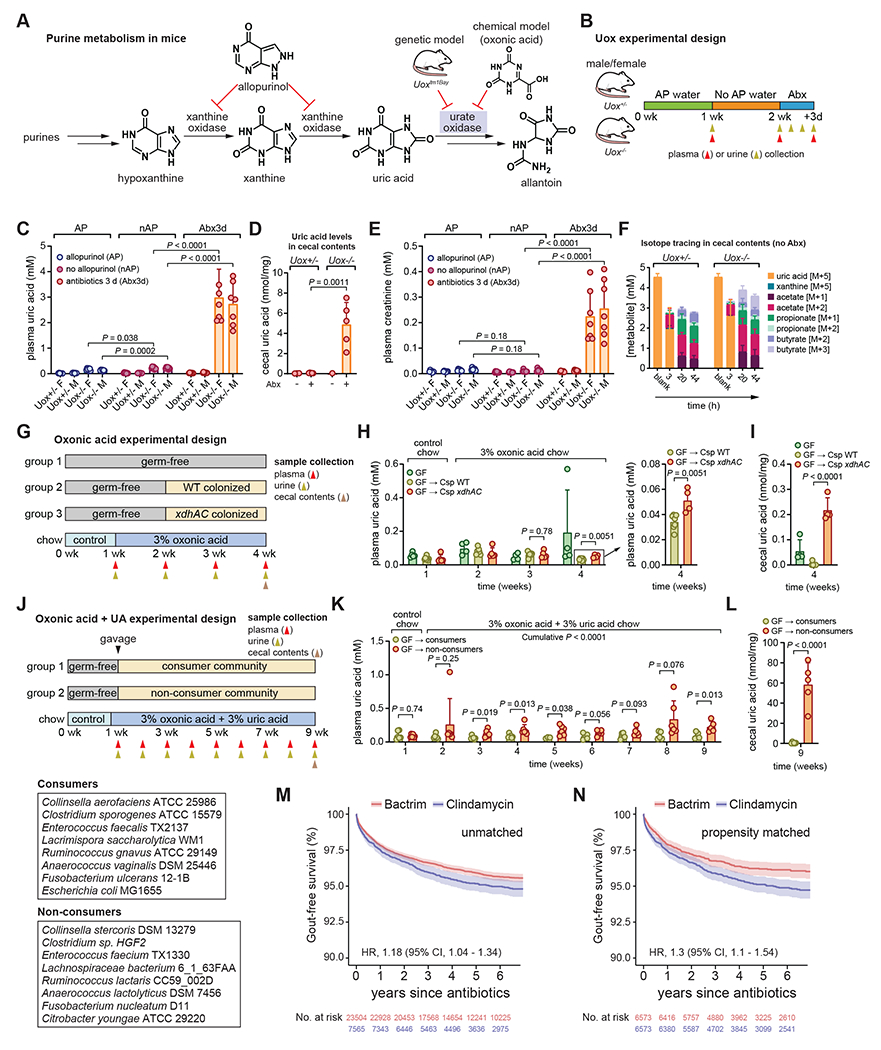
Approximately 15% of US adults have circulating levels of uric acid above its solubility limit, which is causally linked to the disease gout. In most mammals, uric acid elimination is facilitated by the enzyme uricase. However, human uricase is a pseudogene, having been inactivated early in hominid evolution. Though it has long been known that uric acid is eliminated in the gut, the role of the gut microbiota in hyperuricemia has not been studied. Here, we identify a widely distributed bacterial gene cluster that encodes a pathway for uric acid degradation. Stable isotope tracing demonstrates that gut bacteria metabolize uric acid to xanthine or short chain fatty acids. Ablation of the microbiota in uricase-deficient mice causes severe hyperuricemia, and anaerobe-targeted antibiotics increase the risk of gout in humans. These data reveal a role for the gut microbiota in uric acid excretion and highlight the potential for microbiome-targeted therapeutics in hyperuricemia.

Keywords: gout; hyperuricemia; microbiome; microbiota; uric acid; uricase.


Conflict of interest statement

Declaration of interests D.D. is a co-founder of Federation Bio. M.H.M. is a member of the Scientific Advisory Board of Hexagon Bio and co-founder of Design Pharmaceuticals.

Figures

Figure 1.
Figure 1.. Anaerobic uric acid metabolism is widespread among human gut bacteria.
A) Overview of purine metabolism in humans. B) Phylogenetic distribution of human gut bacteria in the strain library used for this study. C) Overview of experimental approach to screen for uric acid metabolism. D) Extracted ion chromatograms for uric acid and the uric acid internal standard (ISTD; [15N2]-uric acid) in medium blank and after incubation with a non-consumer (B. thetaiotaomicron) and two known purine-consuming bacteria (C. cylindrosporum and G. purinilytica). E) Results from uric acid screen in rich medium, grouped by phylum. Each dot represents a single bacterial strain. The frequency of strains is shown on the right of the plot. F) Phylogenetic distribution of uric acid consuming bacteria within the Actinobacteria, Fusobacteria, and Firmicutes phyla. Dark purple dots represent strains that consume >50% of the uric acid. Only those strains for which assembled genomes are available were included. G) Uric acid consumption in closely related bacteria during growth in rich media. For D and E, data represent the results from a single experiment. For G, data represent the means ± standard deviations of n = 3 biological replicates.
Figure 2.
Figure 2.. Gut bacteria convert uric acid into xanthine or lactate and short chain fatty acids.
A) Overview of stable isotope tracing. Bacteria were cultured in rich media containing either unlabeled or uniformly labeled [13C5] uric acid and metabolites were quantified at indicated times by LC-MS. B-C) Extracted ion chromatograms for labeled substrates or products when (B) Blautia sp. KLE 1732 or (C) Clostridium sporogenes ATCC 15579 was cultured with labeled or unlabeled uric acid. D) Labeled substrates and products detected in cell-free culture supernatants of all nine bacteria studied. E) Uric acid is converted either to xanthine or lactate and the SCFAs acetate and butyrate. For B and C, arrows indicate expected retention times for indicated compounds. For C, the peak eluting 0.3 min before butyrate [M+2] was identified as isobutyrate [M+2]. For B and C, experiments were performed in triplicate and representative data are shown. For D, data represent the means ± standard deviations of n = 3 biological replicates. Strains include: Blautia sp. KLE 1732, Coprococcus comes ATCC 27758, Enterocloster clostridioformis WAL-7855, Fusobacterium ulcerans 12-1B, Lacrimispora saccharolytica WM1, Lachnospiraceae bacterium 1_4_56FAA, Ruminococcus gnavus ATCC 29149, Collinsella aerofaciens ATCC 25986, and Clostridium sporogenes ATCC 15579. GAM, Gifu anaerobic medium.
Figure 3.
Figure 3.. RNA-seq reveals a uric acid-inducible gene cluster in gut bacteria.
A) Overview of experimental design. Three organisms (C. sporogenes, L. saccharolytica, and C. aerofaciens) were cultured in rich medium with and without supplemental uric acid and transcriptomes were analyzed by RNA-seq. B) Venn diagram showing significantly induced genes for all three organisms (FDR corrected P-value (q-value) < 0.05, fold-change > 4). C) Volcano plots showing differentially regulated genes in the three organisms. Cut-offs include FDR corrected P-value (q-value) < 0.05 and |fold-change| > 4. Each dot represents a single gene. Blue dots represent genes that are induced and orange dots represent genes that are repressed when uric acid is present. D) Genomic context and RNA-seq coverage for conserved uric acid-inducible genes. For RNA-seq experiments, three biological replicates were performed for each condition. For D, representative data are shown.
Figure 4.
Figure 4.. Uric acid-inducible genes are required for conversion of uric acid to short chain fatty acids.
A) Individual mutants (indicated by red triangles) were generated in C. sporogenes using the ClosTron system. B) Stable isotope tracing in wild-type and mutant C. sporogenes strains. For B, data represent the means ± standard deviations of n = 3 biological replicates.
Figure 5.
Figure 5.. Uric acid gene cluster is conserved across uric acid consuming gut bacteria.
A) RpoB phylogenetic tree for strains screened for uric acid metabolism in this study. Only those strains with assembled genomes are included (n = 187). Clades are colored by phylum. Inner blue shaded tracks represent the % amino acid identity of protein homologs identified from BLASTp searches using C. sporogenes proteins as queries. The outer most track represents the % uric acid consumed by each strain. Uric acid consumption values are only shown for strains with ≥ 50% uric acid consumption. Table shows number of bacteria positive or negative for genes (cut-off ≥ 5 of 7 genes) vs. positive or negative for uric acid consumption (cut-off ≥ 50% uric acid consumption). The cut-off of ≥ 5 of 7 genes was determined by analyzing sensitivity and specificity at different gene cut-off values (Table S2). B) Genomic context of uric acid metabolic genes from representative uric acid consuming strains corresponding to black arrows in Figure 5A.
Figure 6.
Figure 6.. Nutrient dependence of E. coli uric acid metabolism and role of genes in conversion of uric acid to acetate.
A) Genomic context for uric acid metabolic genes in E. coli. Black triangles indicated previously studied genes, and red triangles indicate genes targeted in the current study. B) Results from uric acid metabolism screens under carbohydrate (CHO) replete (left) or CHO limited (right) conditions. Strains are ordered by amount of uric acid remaining and E. coli is indicated by a red dot. C) Uric acid metabolism by E. coli under different nutrient conditions. D) Stable isotope tracing in wild-type and mutant E. coli strains. Strains were cultured in modified Gifu anaerobic medium containing either labeled or unlabeled uric acid. Labeled substrates and products were quantified by LC-MS. E) Pfam domains for YgfK and two gene products (AegA and YgfT) previously shown to be involved in uric acid metabolism by E. coli. F) Relative expression of ygfK, aegA, and ygfT in uric acid supplemented vs. non-supplemented conditions. Uric acid remaining in the medium is shown in the upper panel. For B, data in the two panels represent the results from a single experiment per condition. For C, D, and F, data represent the means ± standard deviations of n = 3 biological replicates.
Figure 7.
Figure 7.. Gut bacteria compensate for loss of uricase.
A) Overview of purine metabolism in mice. B) Overview of Uox mouse experimental design. C) Plasma uric acid levels in male and female Uox+/− or Uox−/− mice. D) Cecal uric acid levels in Uox+/− or Uox−/− mice with or without antibiotic treatment. E) Plasma creatinine levels in male and female Uox+/− or Uox−/− mice. F) Isotope tracing in cecal contents of non-antibiotic treated Uox+/− or Uox−/− mice. G) Overview of oxonic acid only experiment with gnotobiotic C57Bl/6 mice. WT, wild-type C. sporogenes; xdhAC, xanthine dehydrogenase mutant C. sporogenes. H) Plasma uric acid levels in GF, WT, or xdhAC colonized mice. Panel at right represents a zoomed in view of the final timepoint. I) Cecal uric acid levels in GF, WT, or xdhAC colonized mice. J) Overview of oxonic acid + uric acid experiment with gnotobiotic C57Bl/6 mice. Community members are indicated in the boxes. K) Plasma uric acid levels in non-consumer or consumer colonized mice. L) Cecal uric acid levels in non-consumer or consumer colonized mice. M) Kaplan-Meier survival curves for unmatched patients treated with oral Bactrim or Clindamycin (≥ 5 day course) with a diagnosis of gout as the end-point. N) Kaplan-Meier survival curves for propensity score matched patients treated with Bactrim or Clindamycin (≥ 5 day course) with a diagnosis of gout as the end-point. For B, G, J, timing of sample collection is indicated with gold (urine), red (plasma), or brown (cecal contents) arrows. For C and E, data represent means ± standard deviations from n = 7-8 mice per group. For D, data represent means ± standard deviations from n = 5 mice (antibiotic treated Uox+/− or Uox−/− mice) or pools for non-antibiotic treated mice (6 mice into 3 pools for Uox+/− and 3 mice into 1 pool for Uox−/−). For F, data represent means ± standard deviations from n = 4 mice (Uox+/−) or n = 8 mice (Uox−/−). For H-I, data represent means ± standard deviations from n = 5-7 mice per group. For K-L, data represent means ± standard deviations from n = 6 mice per group. P-values are from two-tailed unpaired Student’s t-tests. AP, allopurinol; nAP, no allopurinol; Abx, antibiotics.

References

    1. Kratzer JT, Lanaspa MA, Murphy MN, Cicerchi C, Graves CL, Tipton PA, Ortlund EA, Johnson RJ, and Gaucher EA (2014). Evolutionary history and metabolic insights of ancient mammalian uricases. Proc Natl Acad Sci U S A 111, 3763–3768. 10.1073/pnas.1320393111. - DOI - PMC - PubMed
    1. Chang BS (2014). Ancient insights into uric acid metabolism in primates. Proc Natl Acad Sci U S A 111, 3657–3658. 10.1073/pnas.1401037111. - DOI - PMC - PubMed
    1. Johnson RJ, Titte S, Cade JR, Rideout BA, and Oliver WJ (2005). Uric acid, evolution and primitive cultures. Semin Nephrol 25, 3–8. 10.1016/j.semnephrol.2004.09.002. - DOI - PubMed
    1. Singh G, Lingala B, and Mithal A (2019). Gout and hyperuricaemia in the USA: prevalence and trends. Rheumatology (Oxford) 58, 2177–2180. 10.1093/rheumatology/kez196. - DOI - PubMed
    1. Sorensen LB (1965). Role of the intestinal tract in the elimination of uric acid. Arthritis Rheum 8, 694–706. 10.1002/art.1780080429. - DOI - PubMed

Publication types