. 2023 Aug 3;186(16):3476-3498.e35.
doi: 10.1016/j.cell.2023.07.004.

Proteogenomic analysis of chemo-refractory high-grade serous ovarian cancer

Affiliations

Proteogenomic analysis of chemo-refractory high-grade serous ovarian cancer

Shrabanti Chowdhury et al. Cell. .

Erratum in

  • Proteogenomic analysis of chemo-refractory high-grade serous ovarian cancer.
    Chowdhury S, Kennedy JJ, Ivey RG, Murillo OD, Hosseini N, Song X, Petralia F, Calinawan A, Savage SR, Berry AB, Reva B, Ozbek U, Krek A, Ma W, da Veiga Leprevost F, Ji J, Yoo S, Lin C, Voytovich UJ, Huang Y, Lee SH, Bergan L, Lorentzen TD, Mesri M, Rodriguez H, Hoofnagle AN, Herbert ZT, Nesvizhskii AI, Zhang B, Whiteaker JR, Fenyo D, McKerrow W, Wang J, Schürer SC, Stathias V, Chen XS, Barcellos-Hoff MH, Starr TK, Winterhoff BJ, Nelson AC, Mok SC, Kaufmann SH, Drescher C, Cieslik M, Wang P, Birrer MJ, Paulovich AG. Chowdhury S, et al. Cell. 2024 Feb 15;187(4):1016. doi: 10.1016/j.cell.2024.01.016. Cell. 2024. PMID: 38364782 Free PMC article. No abstract available.

Abstract

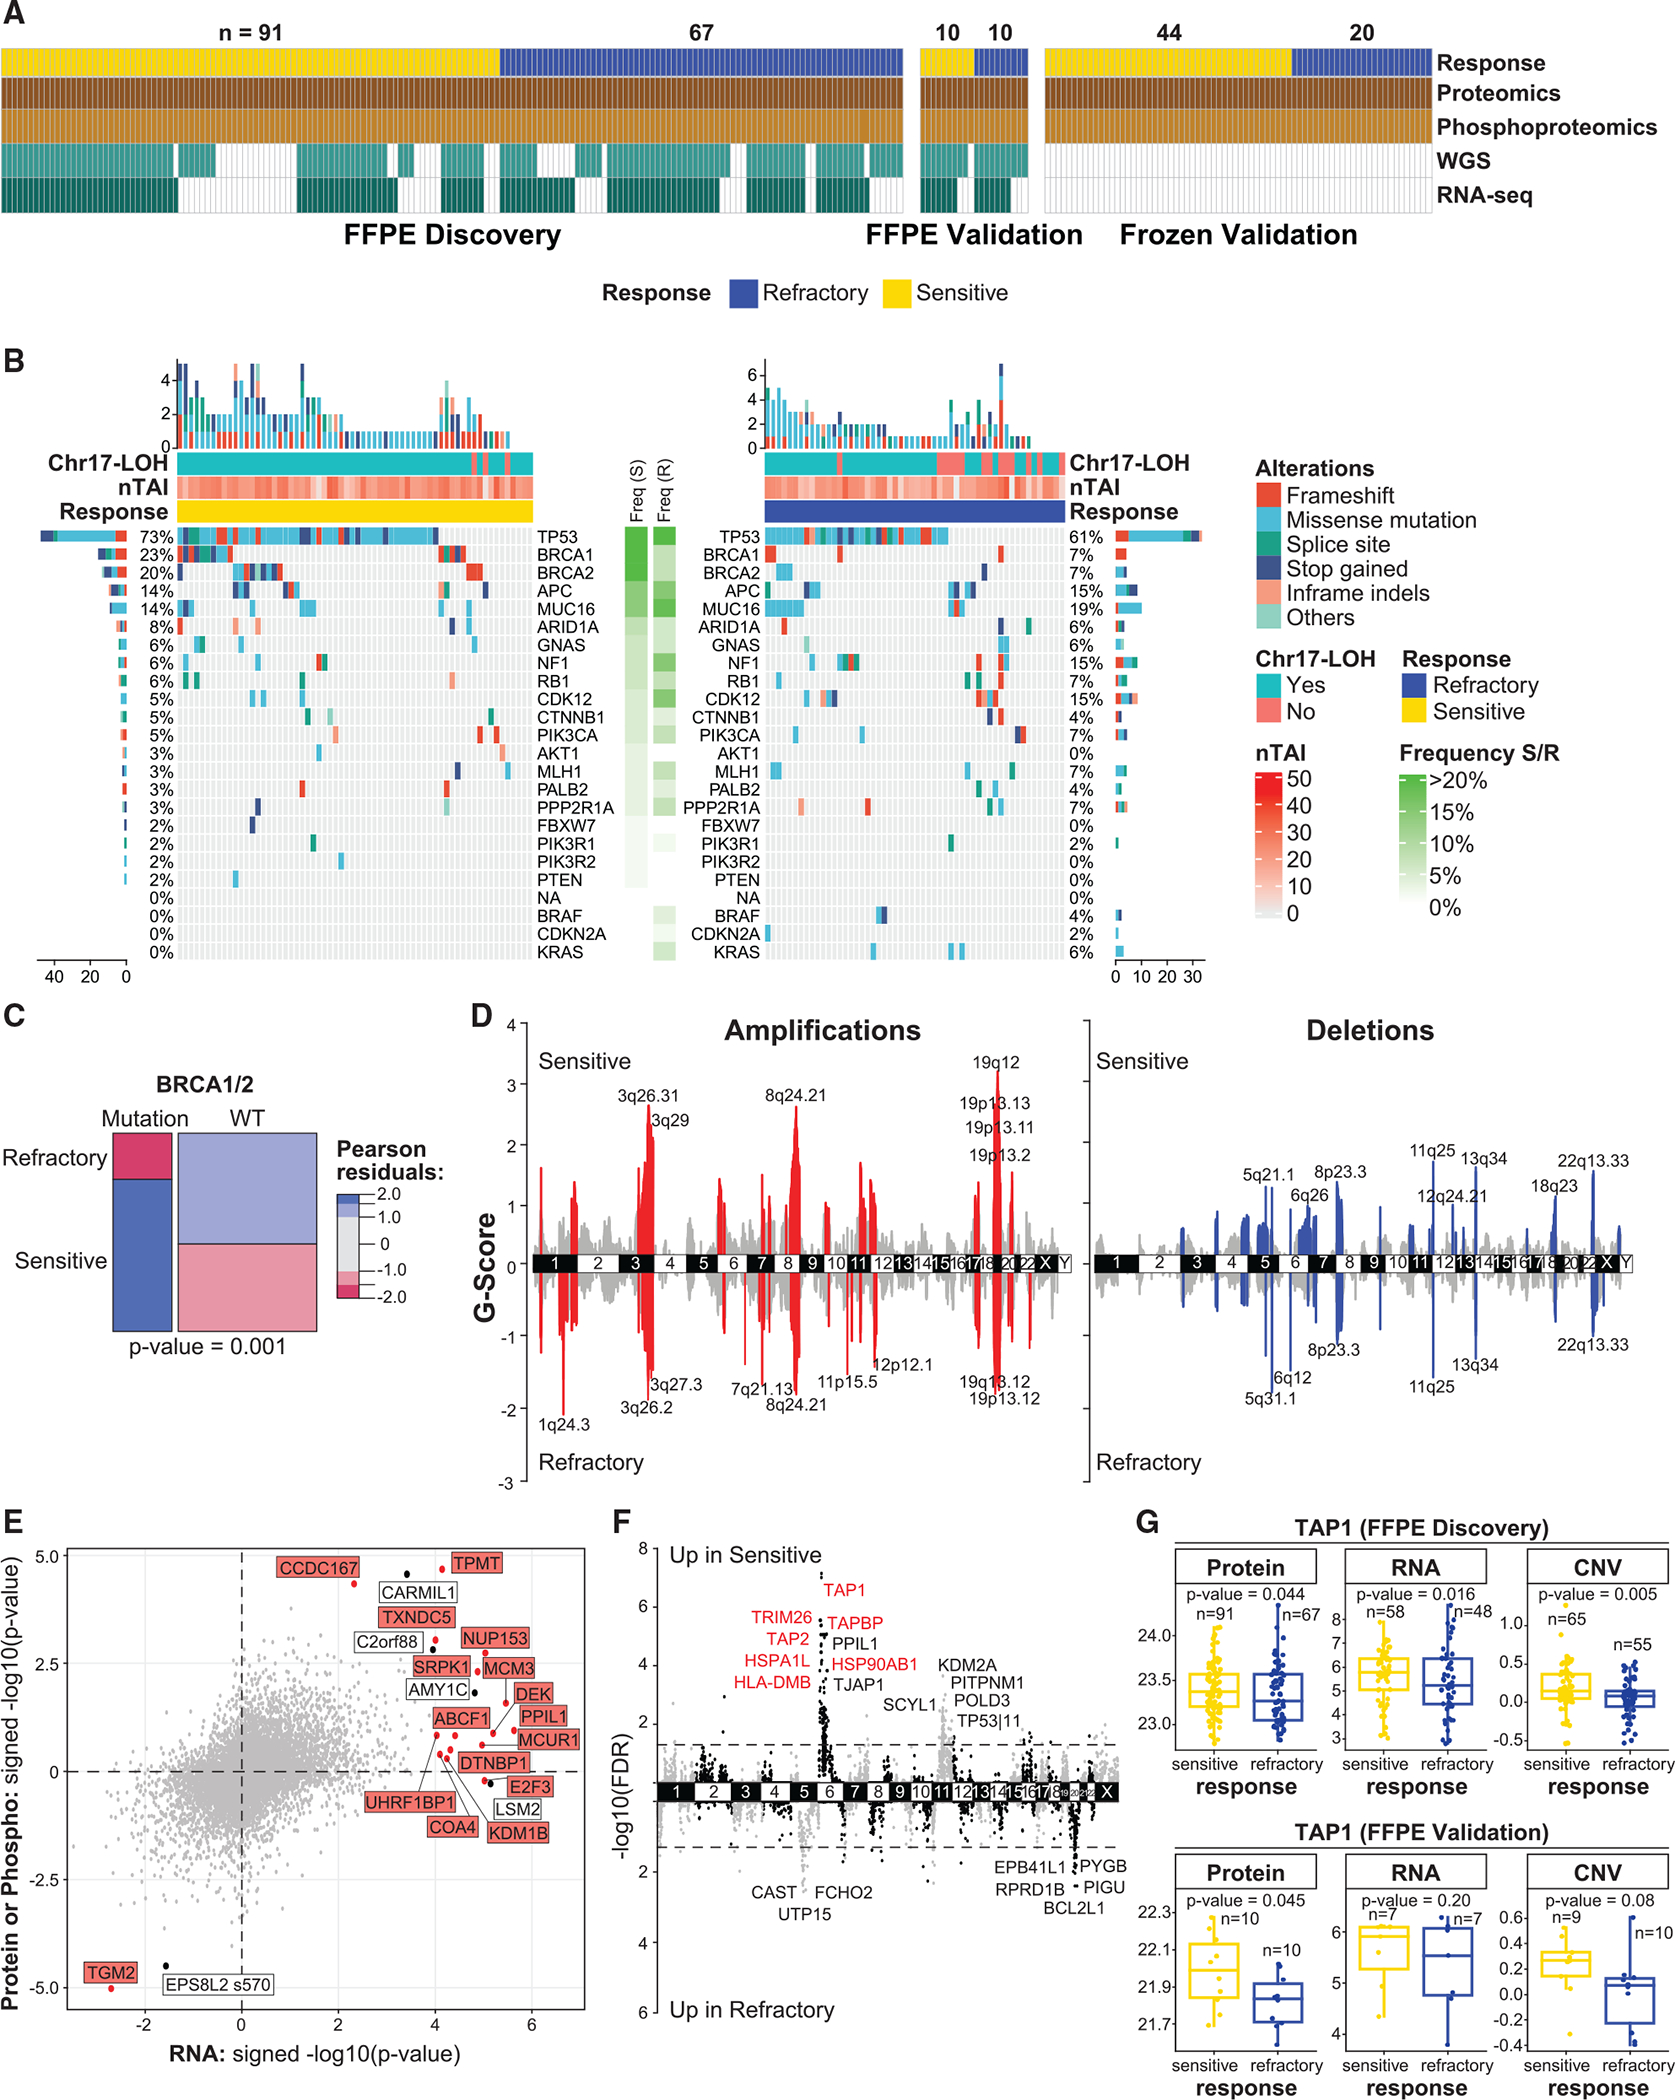
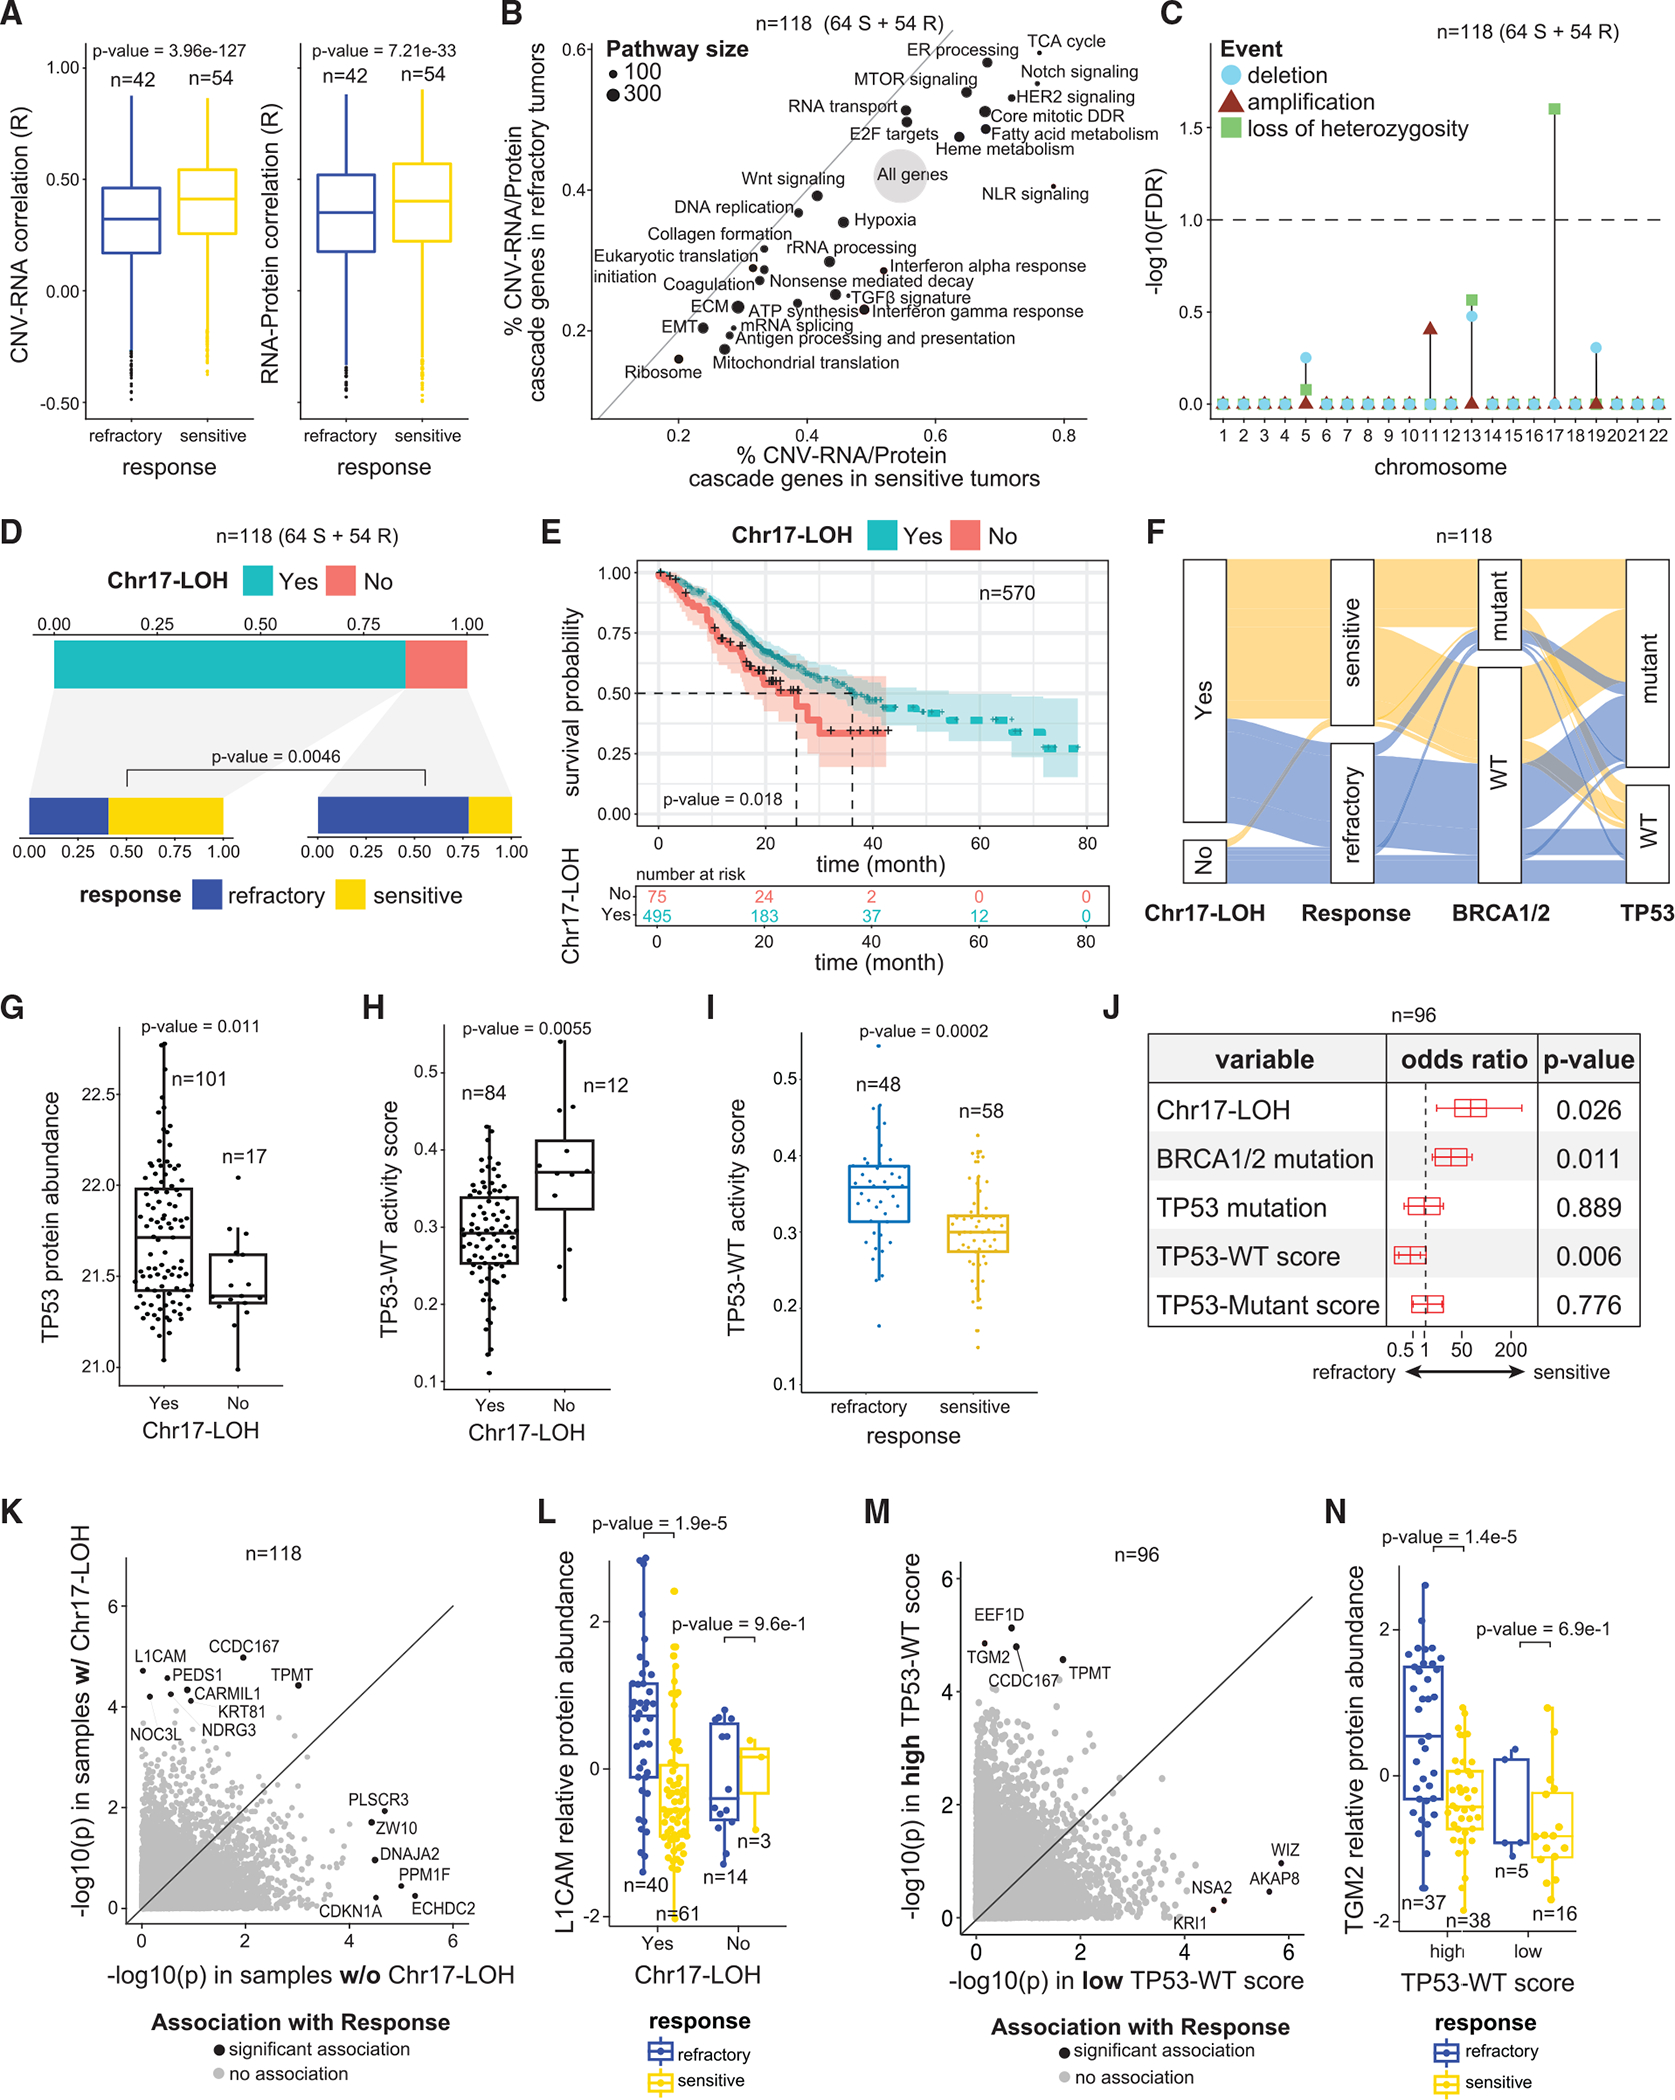
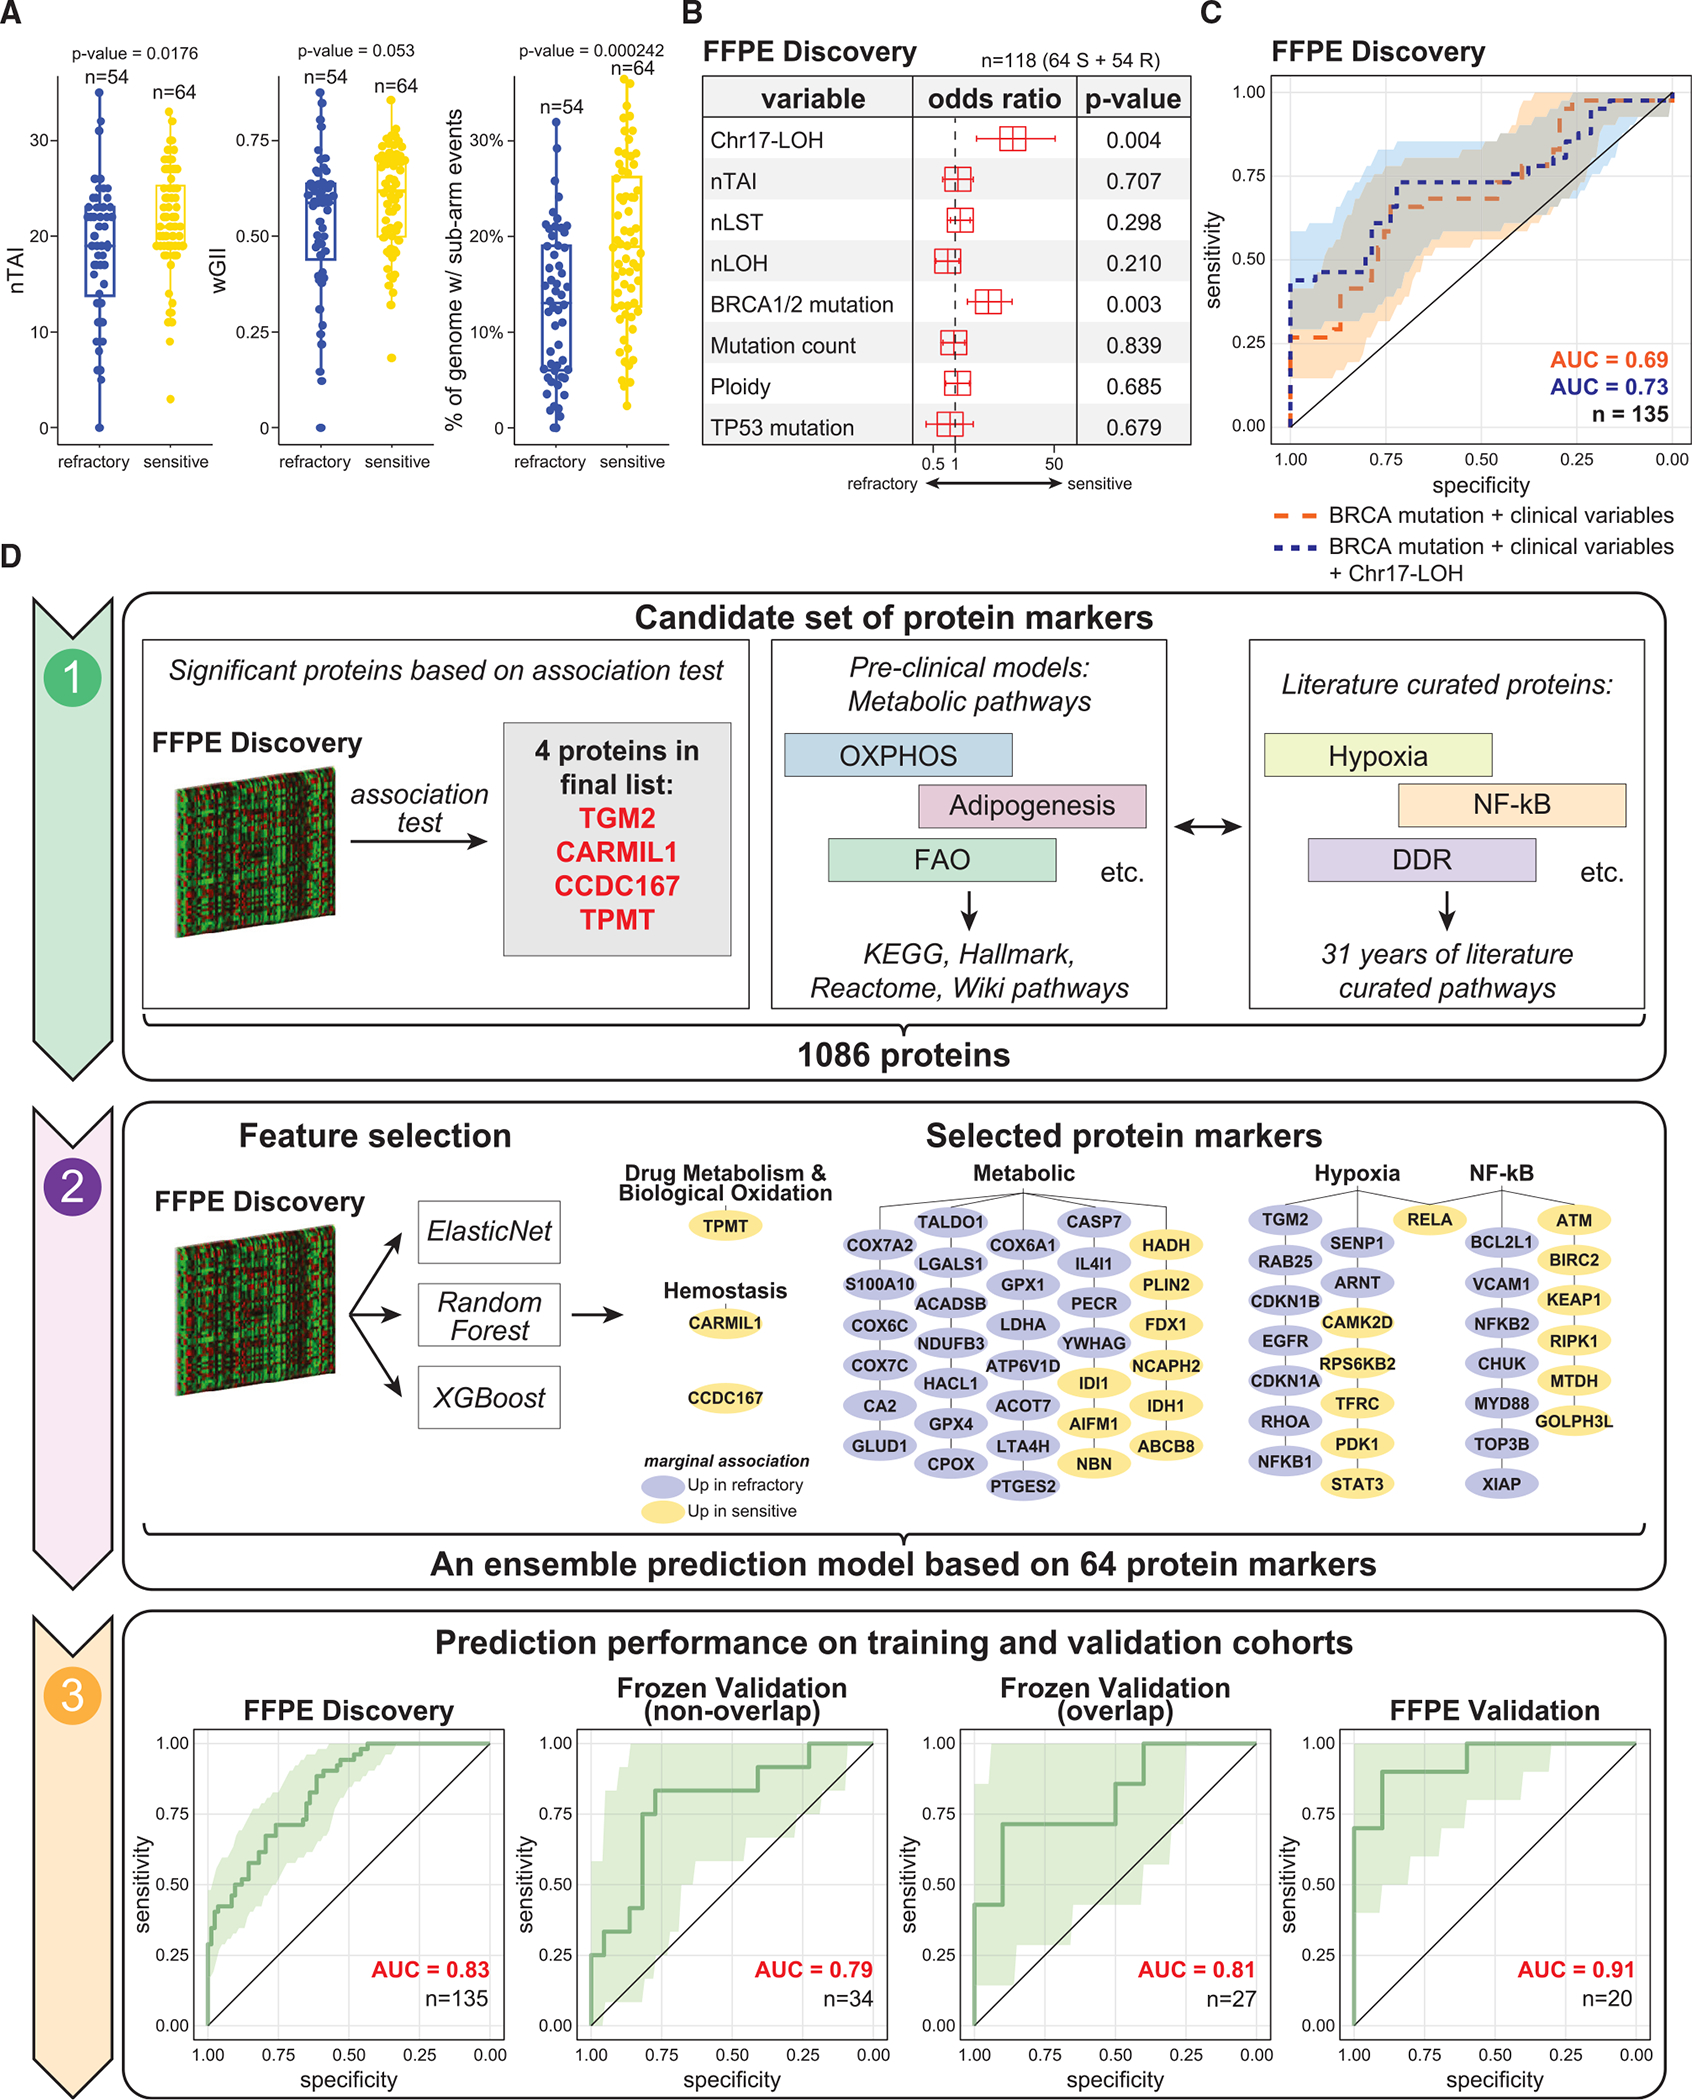
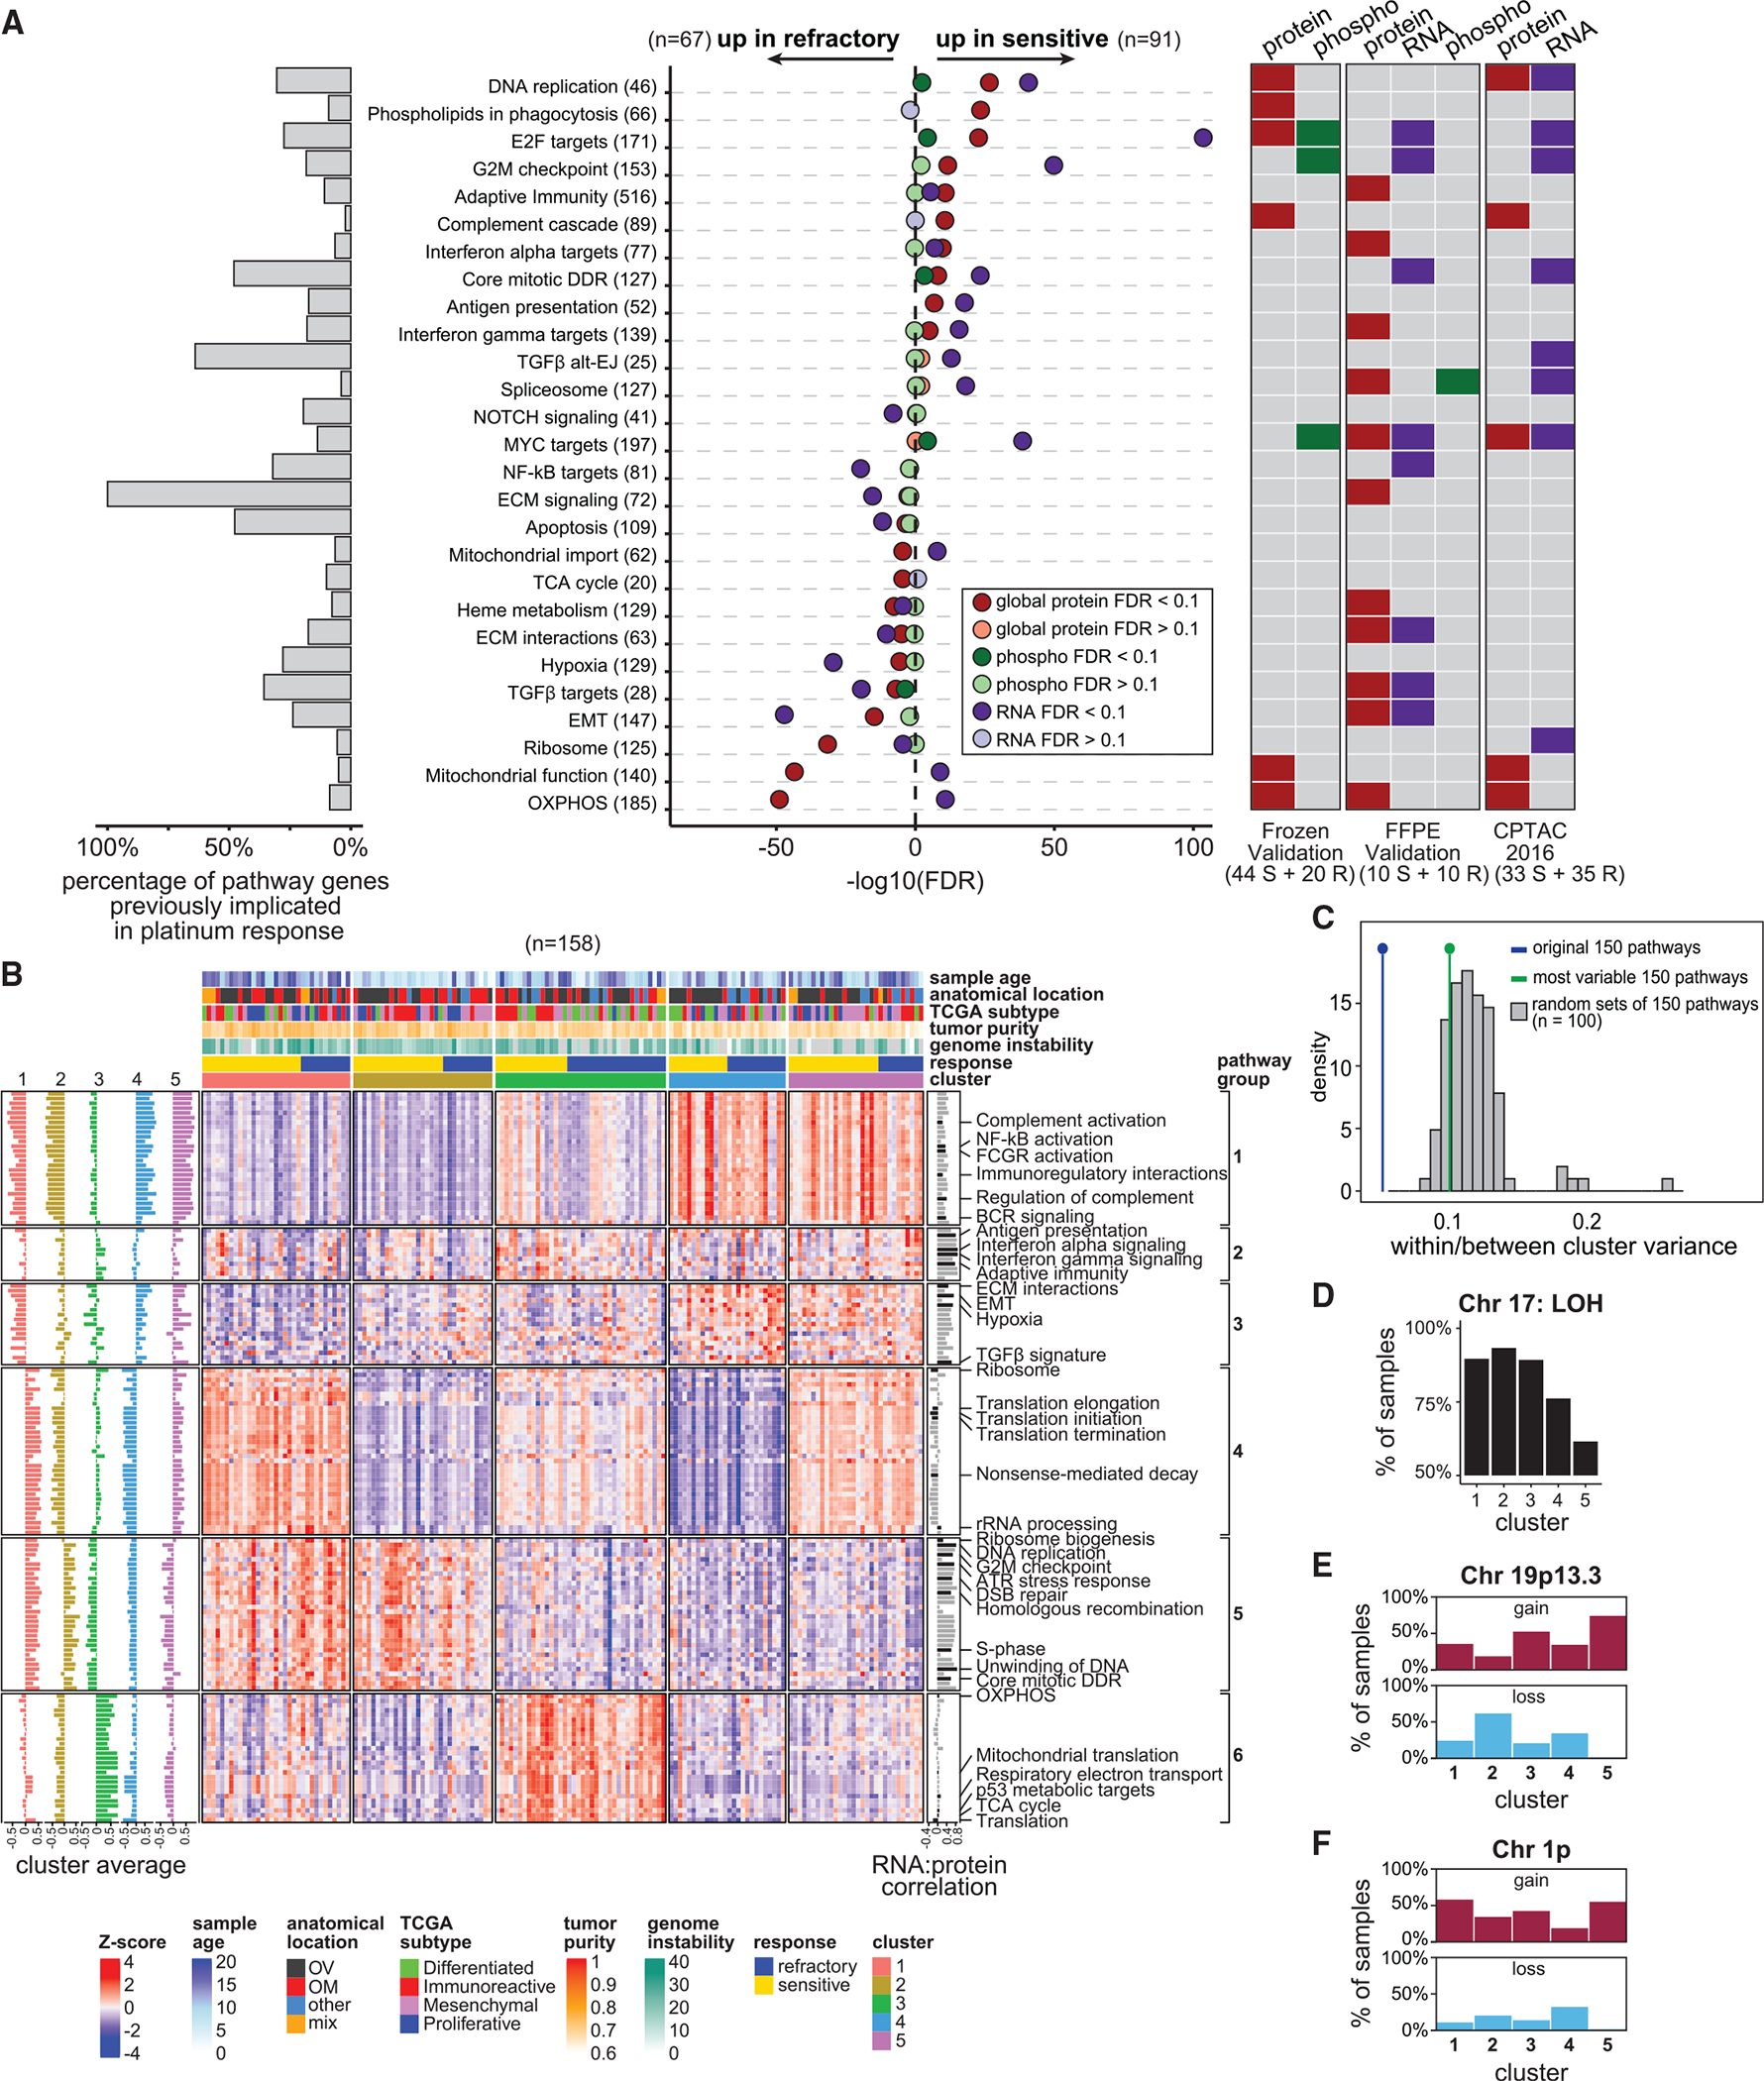
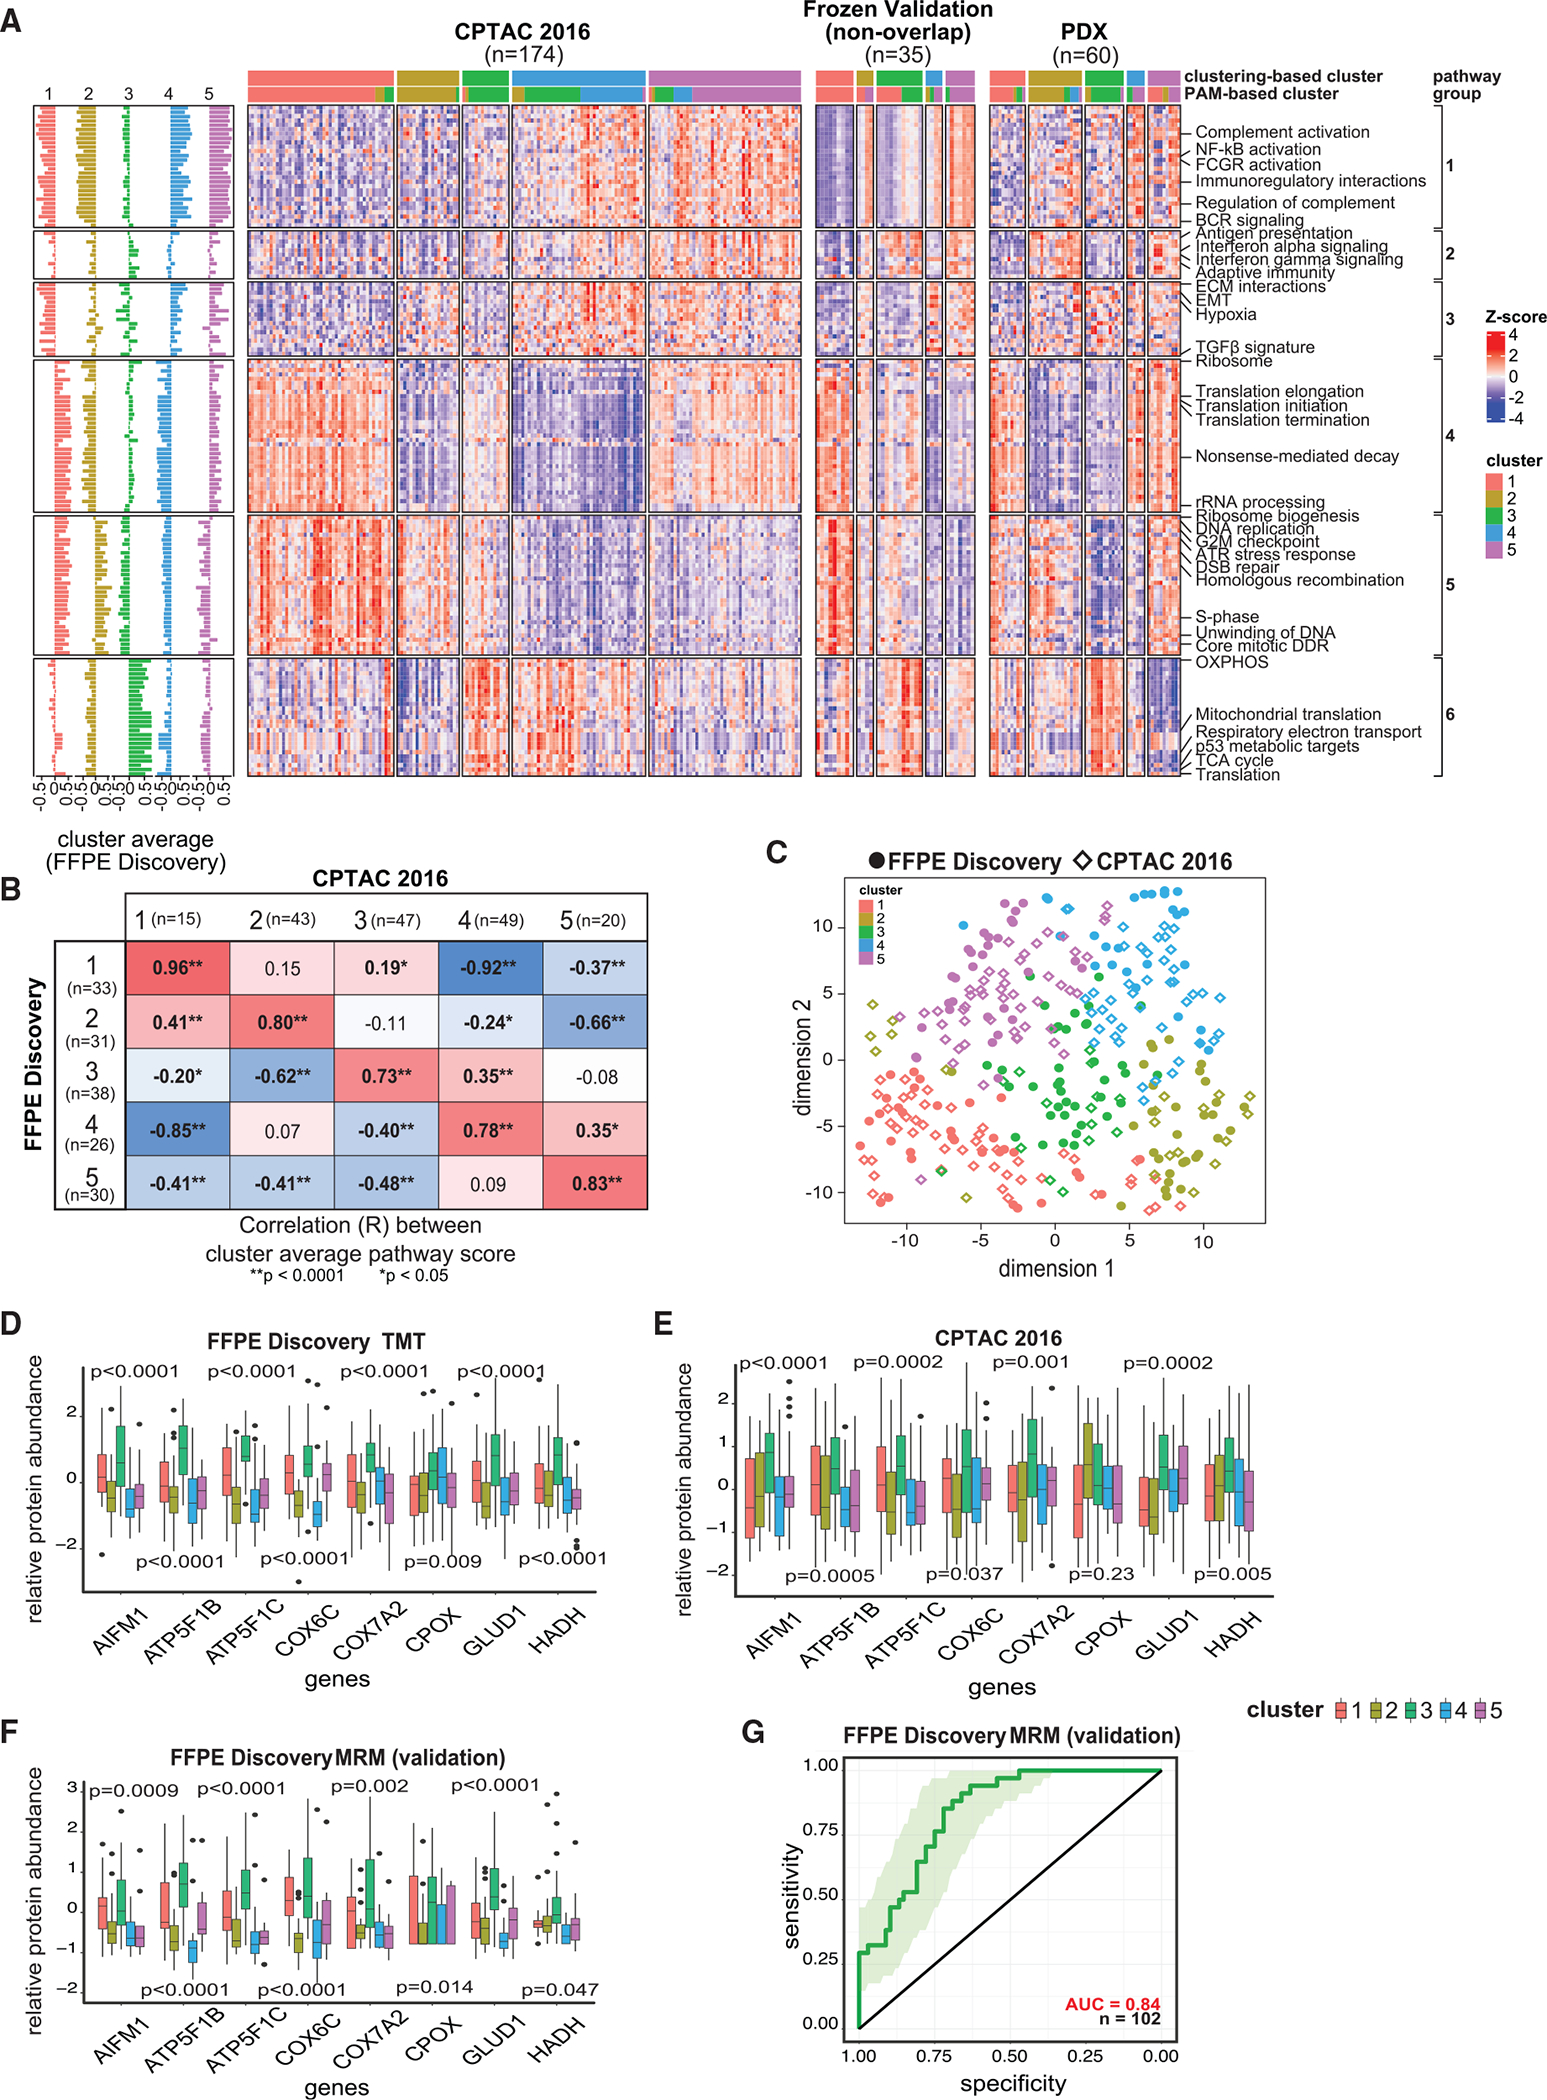
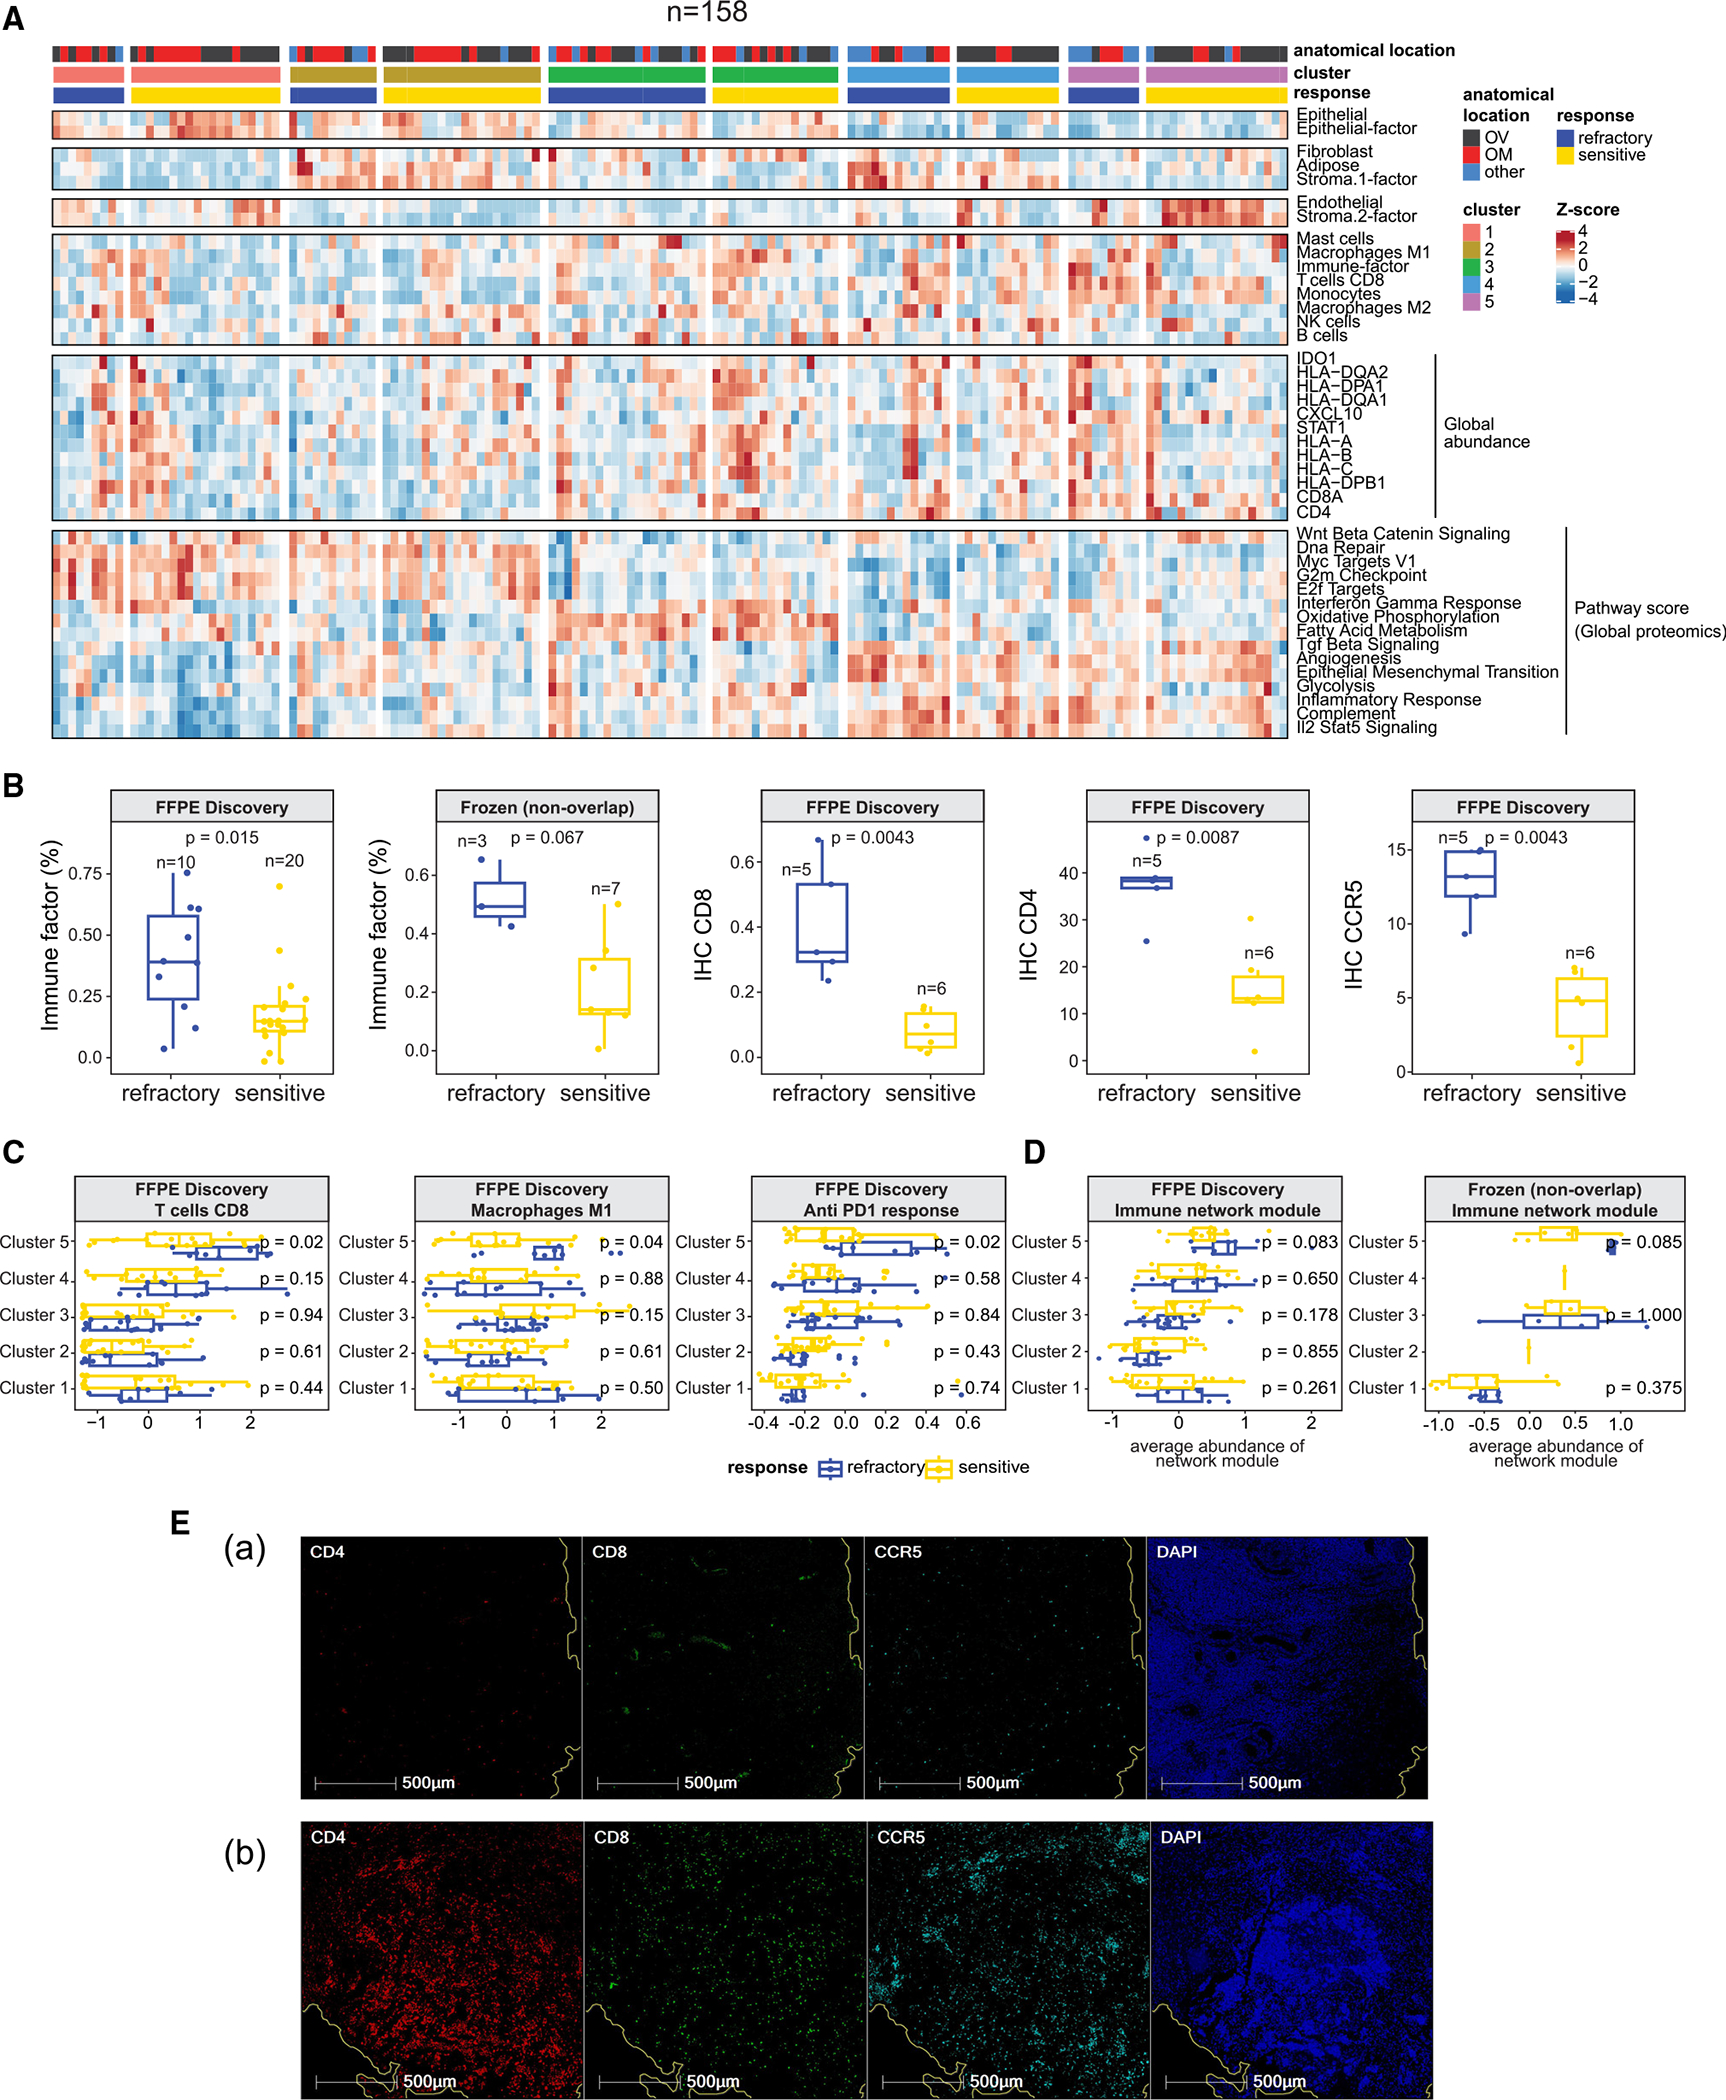
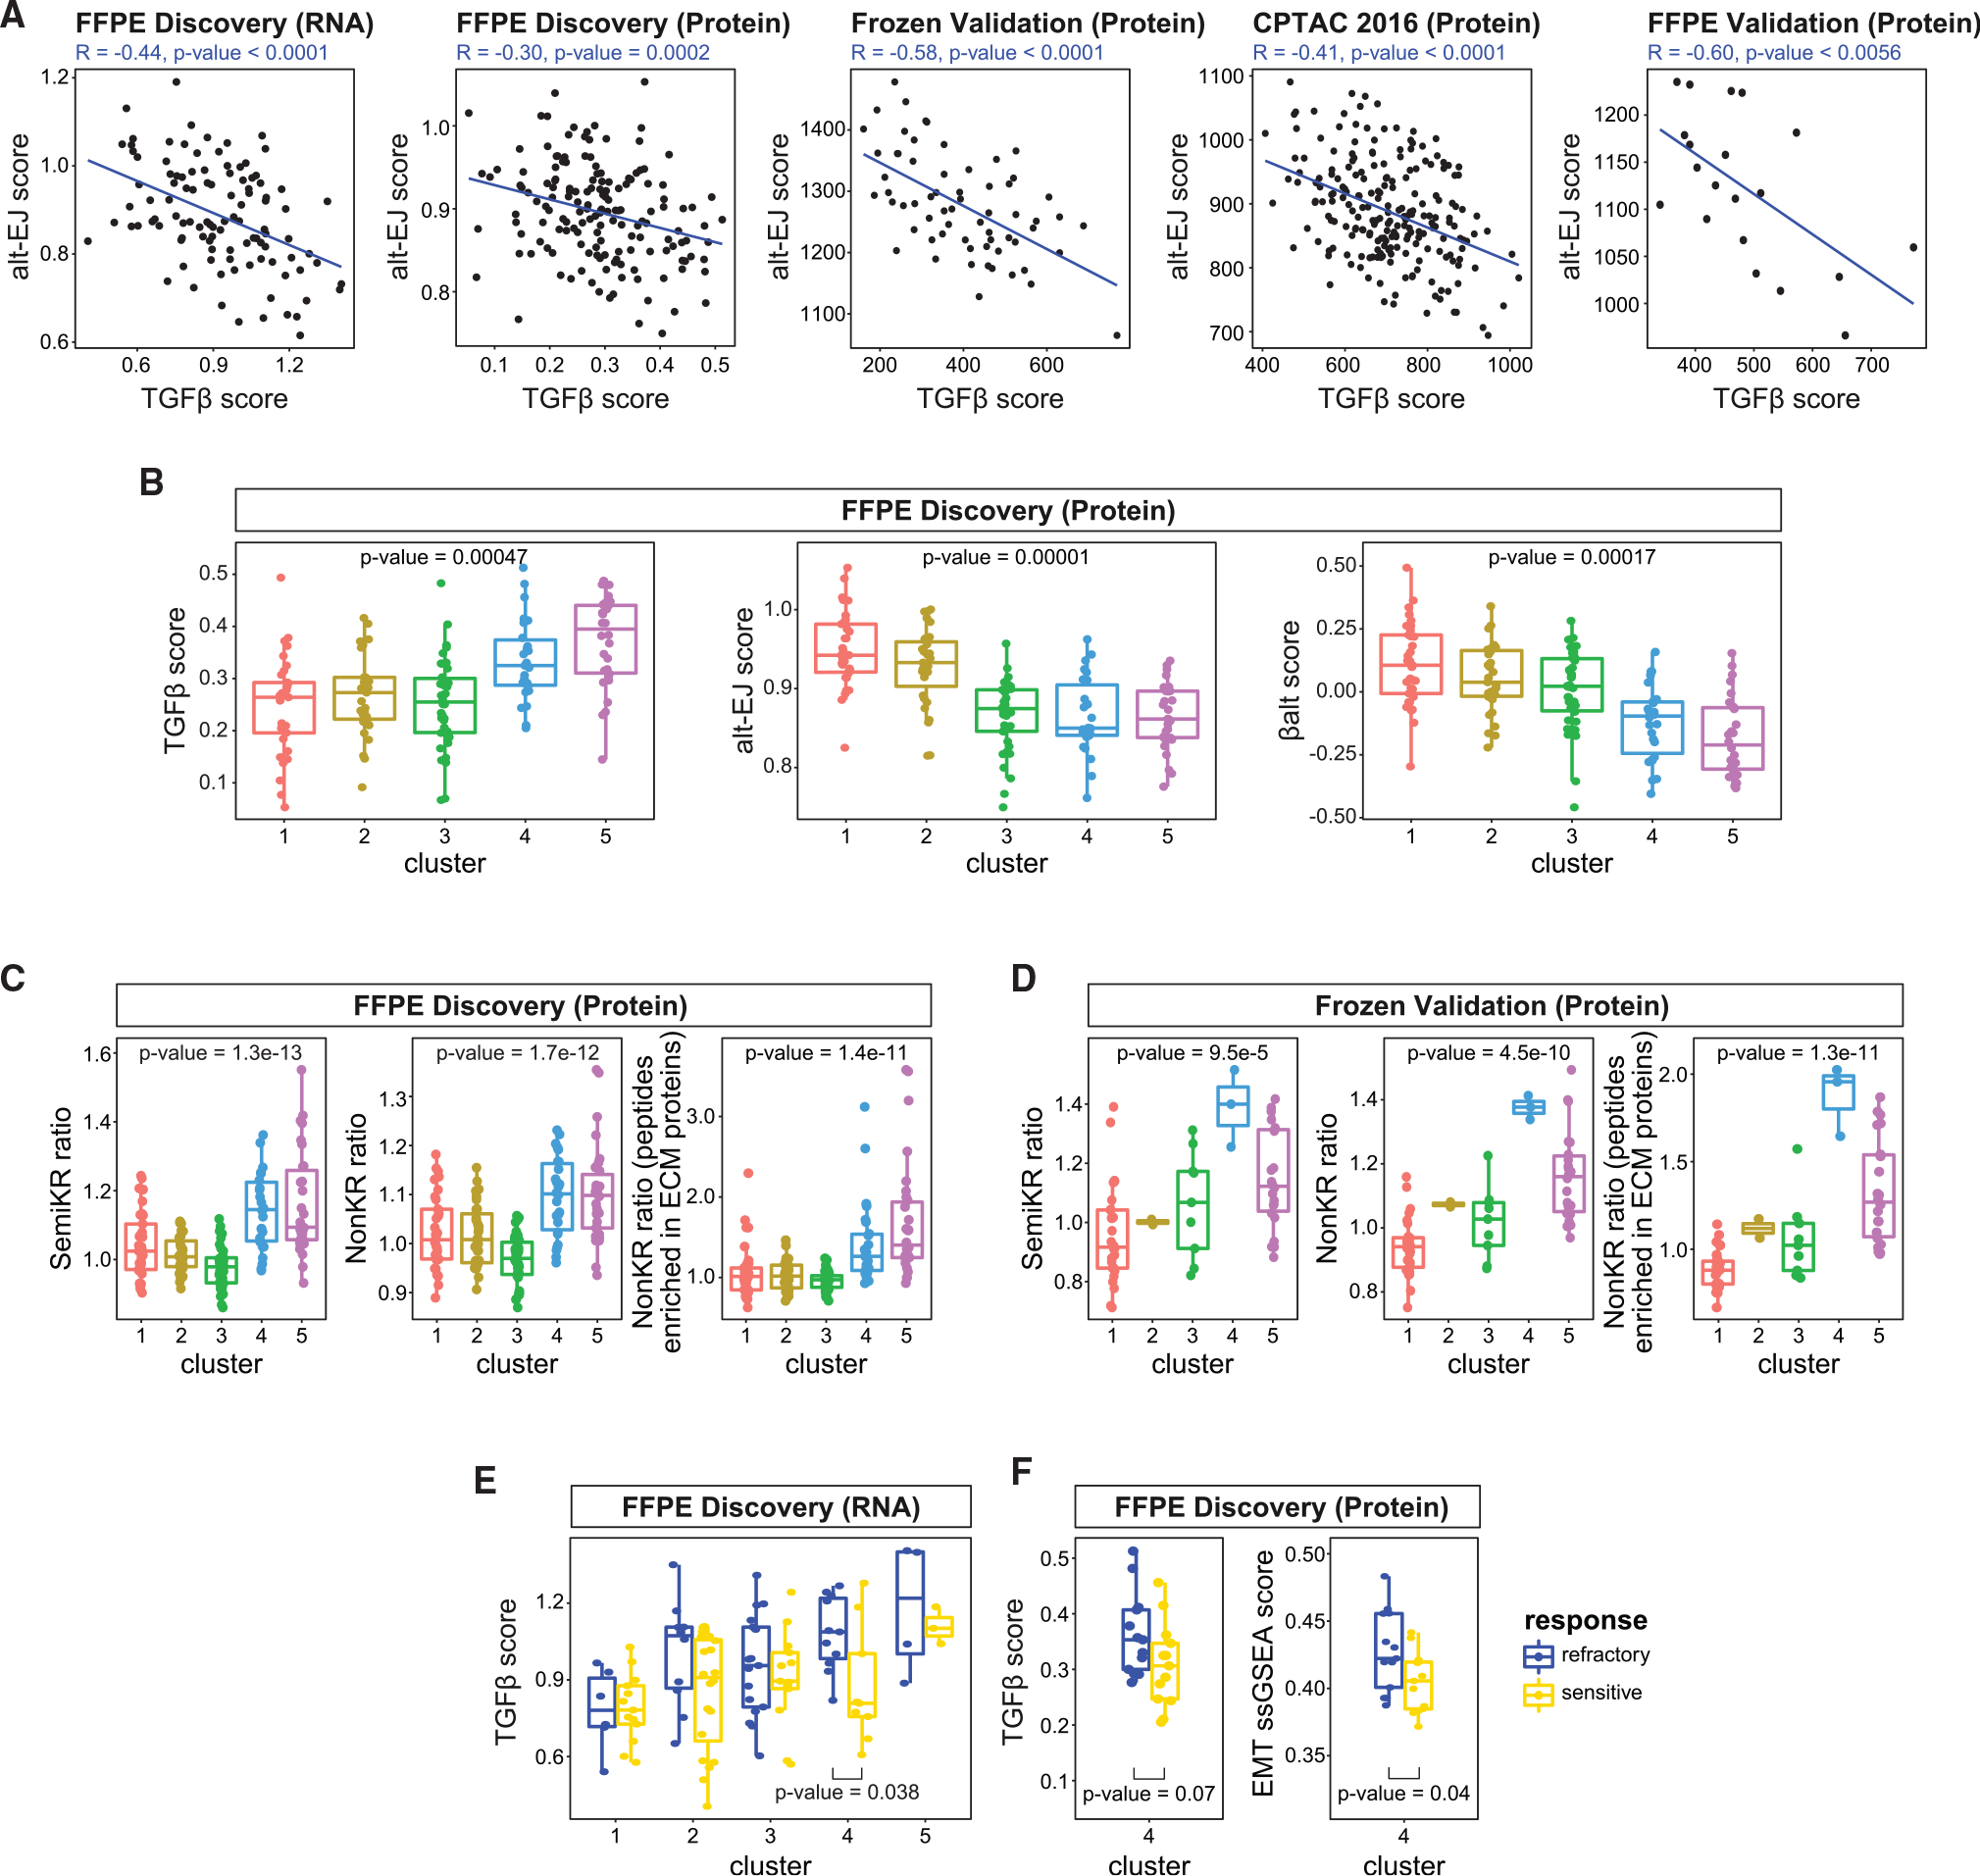
To improve the understanding of chemo-refractory high-grade serous ovarian cancers (HGSOCs), we characterized the proteogenomic landscape of 242 (refractory and sensitive) HGSOCs, representing one discovery and two validation cohorts across two biospecimen types (formalin-fixed paraffin-embedded and frozen). We identified a 64-protein signature that predicts with high specificity a subset of HGSOCs refractory to initial platinum-based therapy and is validated in two independent patient cohorts. We detected significant association between lack of Ch17 loss of heterozygosity (LOH) and chemo-refractoriness. Based on pathway protein expression, we identified 5 clusters of HGSOC, which validated across two independent patient cohorts and patient-derived xenograft (PDX) models. These clusters may represent different mechanisms of refractoriness and implicate putative therapeutic vulnerabilities.

Keywords: chemorefractory; high-grade serous ovarian cancer; machine learning; mass spectrometry; multiple reaction monitoring; platinum; precision oncology; predictive biomarker; prognostic biomarker; proteogenomic.


Conflict of interest statement

Declaration of interests M.J.B. has participated in advisory boards for the following companies: Clovis, Astra Zeneca, and GSK-Tesaro. A.N.H. is the Associate Editor of Clinical Chemistry and has a financial interest in the company Seattle Genetics. A.G.P. is the founder of Precision Assays, LLC. A.B.B. is employed by Synapse. S.Y. is an employee and shareholder of Sema4. B.J.W. has stock interests in Verastem and Exact Sciences.

Figures

Figure 1.
Figure 1.. Overview of multi-omics datasets
(A) Availability of the proteomic, phospho-proteomic, WGS, and RNA-seq data across the cohorts. (B) OncoPrint of likely pathogenic genetic variants in sensitive and refractory tumors. Genes are ordered by mutation frequency in sensitive tumors. Chr17-LOH binary variable indicates whether more than 25% of Chr17 has LOH. nTAI denotes the number of chromosome arms with telomeric allelic imbalance. (C) Association between mutations in BRCA1/2 and tumor response. The p value is based on the chi-square test. (D) Genomic regions with recurrent focal amplifications (left) and deletions (right) in sensitive (top) and refractory (bottom) tumors. The G score is proportional to −log(probability|background). Cytobands of the most significant peaks are annotated. (E) Concordance of genes associated with refractoriness across global proteomic (y axis), phospho-proteomic (y axis), and RNA-seq data (x axis) (FFPE discovery cohort). Labeled genes/proteins/phosphosites are significantly associated with refractoriness (FDR < 0.1). Genes/proteins highlighted in red also showed association with refractoriness based on CNV data. (F) Association between genes and refractoriness from the integrated CNV, RNA, and protein analysis (FFPE discovery cohort). Highlighted genes survivecombined FDR < 0.1 (FFPE discovery cohort) and are validated (marginal p value < 0.05) using the proteomic data from R1 validation cohort. (G) Protein, RNA, and copy-number levels for TAP1 in the FFPE discovery and validation cohorts. p values are determined by covariate-adjusted regressions(Table S1). See also Figure S1.
Figure 2.
Figure 2.. Association between treatment response and CNV-RNA/protein cis-regulations, chromosome-arm-level alterations, and TP53 signatures
(A) Genome-wide distributions of correlation coefficients between DNA copy-number variations and RNA levels (left), as well as RNA and protein abundances(right) of the same genes. p values are based on Wilcoxon Rank Sum test. (B) Scatter plot showing the proportion of CNV-RNA/protein cascade genes in each pathway in sensitive (x axis) vs. refractory (y axis) tumors. Pathway sizeindicates the number of genes in the pathway. (C) Associations between refractoriness and chromosome losses, gains, and LOH. At the chromosome level, only Chr17-LOH is associated with refractoriness (FDR < 0.1). (D) Association between Chr17-LOH and refractoriness. Among the 15% of samples without Ch17-LOH, more than 75% are refractory, whereas most sampleswith Chr17-LOH are sensitive (p value = 0.0046, Fisher’s Exact test). (E) MSK-IMPACT cohort HGSOC samples stratified by Chr17-LOH status. The group enriched with Chr17-LOH samples shows a better survival than the group without Chr17-LOH (p = 0.018, based on Cox regression model). (F) Distributions of genomic features and treatment response. (G and H) Samples with Chr17-LOH have significantly higher p53 protein abundance (p = 0.011, Wilcoxon Rank Sum test) and significantly lower TP53-WT activity scores (p = 0.006, Wilcoxon Rank Sum test), vs. samples without Chr17-LOH. (I) Refractory samples have higher TP53-WT activity scores (p = 0.0002, Wilcoxon Rank Sum test), vs. sensitive tumors. (J) Results of the multivariate logistic regression model with refractory status as the response variable and genomic features as predictor variables. (K) Associations (p values) between protein abundances and treatment response among tumors with (y axis) vs. without (x axis) Chr17-LOH. (L) L1CAM protein abundances stratified by Chr17-LOH status and treatment response. p values are determined by covariate-adjusted regressions. (M) Associations (p values) between protein abundances and refractoriness among tumors with high (y axis) vs. low (x axis) TP53-WT activity scores. (N) TGM2 protein abundances stratified by TP53-WT activity scores and treatment responses. p values are determined by covariate-adjusted regressions. See also Figure S2.
Figure 3.
Figure 3.. Proteogenomics-based predictive models
(A) Association between genomic instability scores and chemo-response. p values are determined by Wilcoxon Rank Sum test. (B) Forest plot of a multivariate logistic regression model predicting refractoriness based on HRD and genetic variables. (C) ROC curves showing the prediction performance of models based on (1) BRCA1/2 mutation status + clinical variables (patient age and tumor location) and (2) BRCA1/2 mutation status + clinical variables + Chr17-LOH status. (D) Workflow and results for the proteomic prediction model: (D1) the initial candidate set of protein markers was the union of multiple information sources, including 4 proteins significantly associated with treatment response (based on the FFPE discovery cohort global proteomic data), protein pathways associated with treatment response (based on cell line and PDX models), and platinum-response-relevant proteins curated from the literature. (D2) Feature selection was performed using non-linear machine learning models based on FFPE discovery cohort global proteomic data, and 64 proteins were selected. (D3) An ensemble prediction model based on the 64 protein markers was derived and tested in independent cohorts. See also Figure S3.
Figure 4.
Figure 4.. Pathway enrichment analysis shows diverse processes associated with refractoriness and reveals sample clusters
(A) Top pathways associated with treatment response (FDR < 0.1) (FFPE discovery cohort). The left barplot indicates the percentage of genes in each of the pathways overlapping with the literature-curated genes. The heatmap on the right indicates if the associations were also observed in the frozen validation, FFPE validation, and the CPTAC-2016 cohorts. (B) Heatmap showing 5 clusters of tumors based on the 150 pathways associated with refractoriness. Color scale represents the ssGSEA pathway scores derived from global proteomic data. The bars on the left represent mean pathway ssGSEA scores of each cluster. The bar on the right represents the correlation between proteomic- and transcriptomic-based pathway scores. (C) The tumor clusters (in B) are not likely due to chance. Shown are the within/between variances for the proposed clustering result (blue line), that based on the 150 most variable pathways (green line), and that based on the 100 random sets of 150 pathways (gray histogram). (D) Percentage of samples with Chr17-LOH among the 5 clusters, with significantly more frequent Chr17-LOH in tumors in clusters 1–3 than in clusters 4 and 5 (p = 0.020, Fisher’s Exact Test). (E) Percentage of samples with gains/losses in Chr9p13.3 (791681–6199529) in the 5 clusters. Deletions of this region in cluster 2 tumors is significantly lower than that in other samples (p value = 0.0003, Wilcoxon Rank Sum test). (F) Percentage of samples with gains/losses in Chr1p (32013868–121575702) in the 5 clusters. Deletions of this region in cluster 4 tumors is significantly lower thanthat in other samples (p value = 0.023, Wilcoxon Rank Sum test). See also Figure S4.
Figure 5.
Figure 5.. Validation of the proteomic clusters using independent cohorts
(A) Heatmaps showing proteomic ssGSEA scores of 150 pathways across the 5 clusters for the samples from the CPTAC-2016 cohort, frozen validation cohort, and PDX proteomic dataset. (B) Heatmap of the Pearson correlations between the average pathway scores of each cluster in the FFPE discovery cohort vs. the CPTAC-2016 study (based on consensus clustering). p values are based on R function cor.test. (C) Concordance among the 5 clusters in the FFPE discovery and the CPTAC-2016 cohorts. Sample sizes of the clusters in FFPE discovery cohort are respectively 33, 31, 38, 26, and 30; while those in CPTAC-2016 (based on consensus clustering) are 15, 43, 47, 49, and 20. (D) Protein abundances of 8 metabolic protein markers showing upregulation in cluster 3 vs. other clusters. The sample sizes of the 5 clusters in FFPE discovery cohort are 33, 31, 38, 26, and 30. p values are based on Student’s t test. (E) Protein abundances of 8 metabolic protein markers (as in D) showing upregulation in cluster 3 vs. other clusters in the CPTAC-2016 cohort. Sample sizes of the 5 clusters in the CPTAC-2016 cohort (based on PAM clustering) are 43, 28, 41, 26, and 36. p values are based on Student’s t tests. (F) Protein abundances of 8 metabolic protein markers (as in D) showing upregulation in cluster 3 vs. other clusters based on MRM data. The sample sizes of the 5 clusters in FFPE discovery cohort for which MRM experiment was done are respectively 17, 27, 34, 15, and 9. p values are based on R function cor.test. (G) ROC showing the prediction performance of the 8 metabolic protein markers (as in D) based on the average abundance of their Z scores determined by MRM. See also Figure S5.
Figure 6.
Figure 6.. Tumor microenvironment landscape
(A) Heatmap illustrating cell-type compositions of the FFPE discovery cohort (n = 158). The first four sections display cell-type proportions estimated by XDec and BayesDebulk. The fifth section includes the normalized global abundance of key immune cell markers. The last section illustrates ssGSEA pathway scores of pathways that corroborate the estimated cell-type composition. (B) First two boxplots show the comparison of the estimated immune proportions by XDec among cluster 5 refractory and sensitive tumors. p values are based on Student’s t tests. The remaining three boxplots show comparison of IHC staining levels of CD8, CD4, and CCR5 between refractory and sensitive tumors. p values based on two-sided Wilcoxon Rank Sum test. (C) Comparison of the estimated proportions by BayesDebulk for several immune subtypes (CD8 T cells and M1 macrophages), and anti-PD1 (programmed cell death 1) response signature across all 5 clusters and treatment response status (FFPE discovery cohort). p values are based on two-sided Wilcoxon Rank Sum test. The sample sizes of the 5 clusters stratified by response are cluster 1 (22S + 11R), cluster 2 (20S + 11R), cluster 3 (16S + 22R), cluster 4 (13S + 13R), and cluster 5 (20S + 10R). (D) Module abundance scores (averaged Z scores of proteins mapping to the network module) across different protein clusters and response groups in the FFPE discovery and frozen validation (non-overlapping) cohorts. p values are based on two-sided Wilcoxon Rank Sum test. Sample sizes of the 5 clusters stratified by response in FFPE discovery cohort are cluster 1 (22S + 11R), cluster 2 (20S + 11R), cluster 3 (16S + 22R), cluster 4 (13S + 13R), and cluster 5 (20S + 10R); sample sizes in the frozen validation (non-overlapping) cohort are cluster 1 (10S + 7R), cluster 3 (4S + 3R), and cluster 5 (7S + 3R). (E) Evaluation of CD8, CD4, and CCR5 expression by fluorescent multiplex immunohistochemistry. A representative chemo-sensitive HGSOC (Ea) and chemo-refractory (Eb) HGSOC were stained using the Akoya Opal Multiplex IHC assay. Tissues were counterstained offline with 4′,6-diamidino-2-phenylindole (DAPI) to identify the nuclei. Representative areas show CD4 (red), CD8 (green), CCR5 (cyan), and nuclei (blue). See also Figure S6.
Figure 7.
Figure 7.. Association of TGF-β, alt-EJ, and βAlt scores with treatment response and clusters
(A) TGF-β and alt-EJ scores are negatively correlated with each other across independent cohorts. p values are for testing the Pearson correlation between the two variables (R function cor.test). (B) The TGF-β, alt-EJ, and βAlt scores are significantly correlated with proteomic clusters. The sample sizes of the 5 clusters are 33, 31, 38, 26, and 30. p values are derived from an ANOVA test based on regression analyses. (C and D) SemiKR (semi-tryptic peptides) ratio, NonKR (non-tryptic peptides) ratio, and NonKR ECM-related ratio are elevated in clusters 4 and 5 in both the FFPE discovery (C) and the frozen validation (D) cohorts. Sample sizes of the 5 clusters in FFPE discovery cohort are 33, 31, 38, 26, and 30, while in the frozen validation cohort (based on PAM clustering) are 28, 2, 9, 3, and 22. p values are derived from an ANOVA test based on regression analyses. (E) Based on the RNA data, the TGF-β score is higher (p = 0.038, Student’s t test) in cluster 4 refractory vs. sensitive tumors. The sample sizes of the 5 clusters in FFPE discovery cohort (based on the 106 samples in RNA data) stratified by response are cluster 1 (13S + 6R), cluster 2 (20S + 10R), cluster 3 (13S + 17R), cluster 4 (9S + 11R), and cluster 5 (3S + 4R). (F) TGF-β score and EMT pathway ssGSEA scores are significantly higher in cluster 4 refractory vs. cluster 4 sensitive tumors. p values are determined by Student’s t test. The sample size of cluster 4 stratified by response is (13S + 13R). See also Figure S7.

References

    1. Matulonis UA, Sood AK, Fallowfield L, Howitt BE, Sehouli J, and Karlan BY (2016). Ovarian cancer. Nat. Rev. Dis. Prim. 2, 1–22. - PMC - PubMed
    1. Bast RC Jr., Matulonis UA, Sood AK, Ahmed AA, Amobi AE, Balkwill FR, Wielgos-Bonvallet M, Bowtell DDL, Brenton JD, and Brugge JS (2019). Critical questions in ovarian cancer research and treatment: report of an American Association for Cancer Research Special Conference. Cancer 125, 1963–1972. - PMC - PubMed
    1. Vergote I, Coens C, Nankivell M, Kristensen GB, Parmar MKB, Ehlen T, Jayson GC, Johnson N, Swart AM, and Verheijen R (2018). Neoadjuvant chemotherapy versus debulking surgery in advanced tubo-ovarian cancers: pooled analysis of individual patient data from the EORTC 55971 and CHORUS trials. Lancet Oncol. 19, 1680–1687. - PubMed
    1. Cass I, Baldwin RL, Varkey T, Moslehi R, Narod SA, and Karlan BY (2003). Improved survival in women with BRCA-associated ovarian carcinoma. Cancer 97, 2187–2195. - PubMed
    1. Muggia FM (2003). Sequential single agents as first-line chemotherapy for ovarian cancer: a strategy derived from the results of GOG-132. Int. J. Gynecol. Cancer 13, 156–162. - PubMed

Publication types