. 2023 Aug 14;41(8):1516-1534.e9.
doi: 10.1016/j.ccell.2023.07.005. Epub 2023 Aug 3.

Mammalian SWI/SNF chromatin remodeling complexes promote tyrosine kinase inhibitor resistance in EGFR-mutant lung cancer

Affiliations

Mammalian SWI/SNF chromatin remodeling complexes promote tyrosine kinase inhibitor resistance in EGFR-mutant lung cancer

Fernando J de Miguel et al. Cancer Cell. .

Abstract

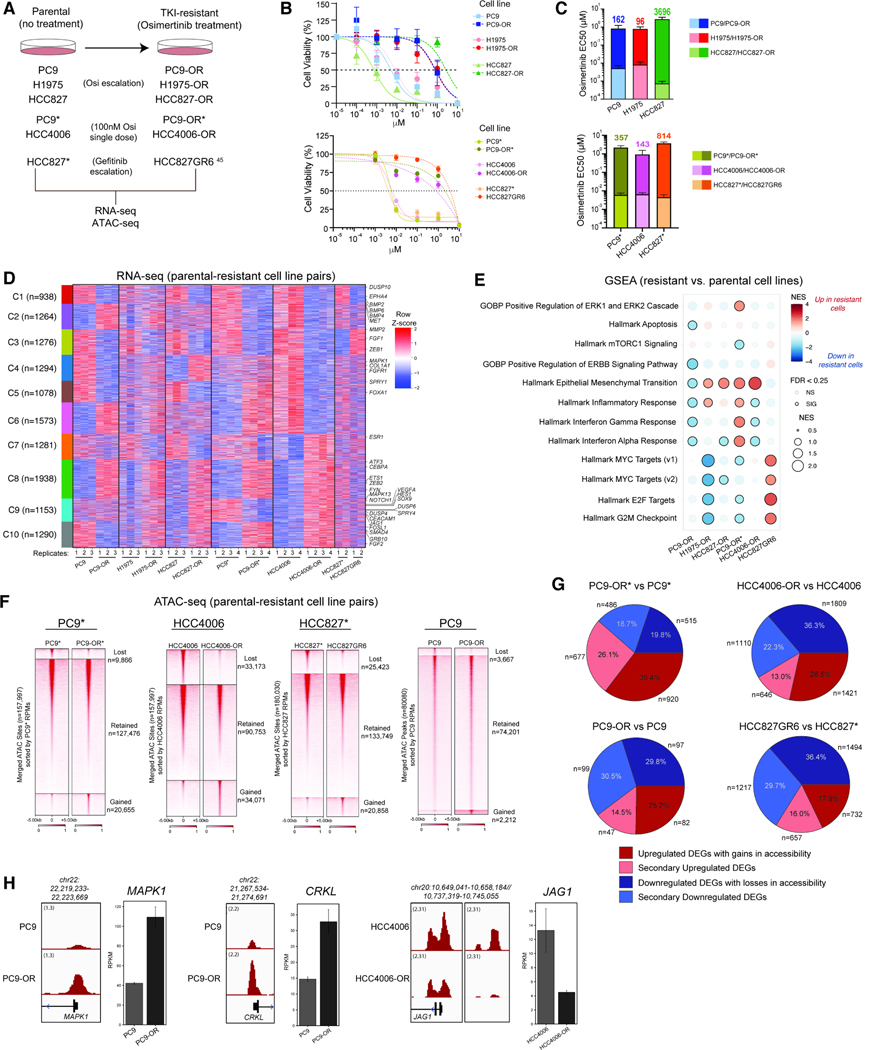
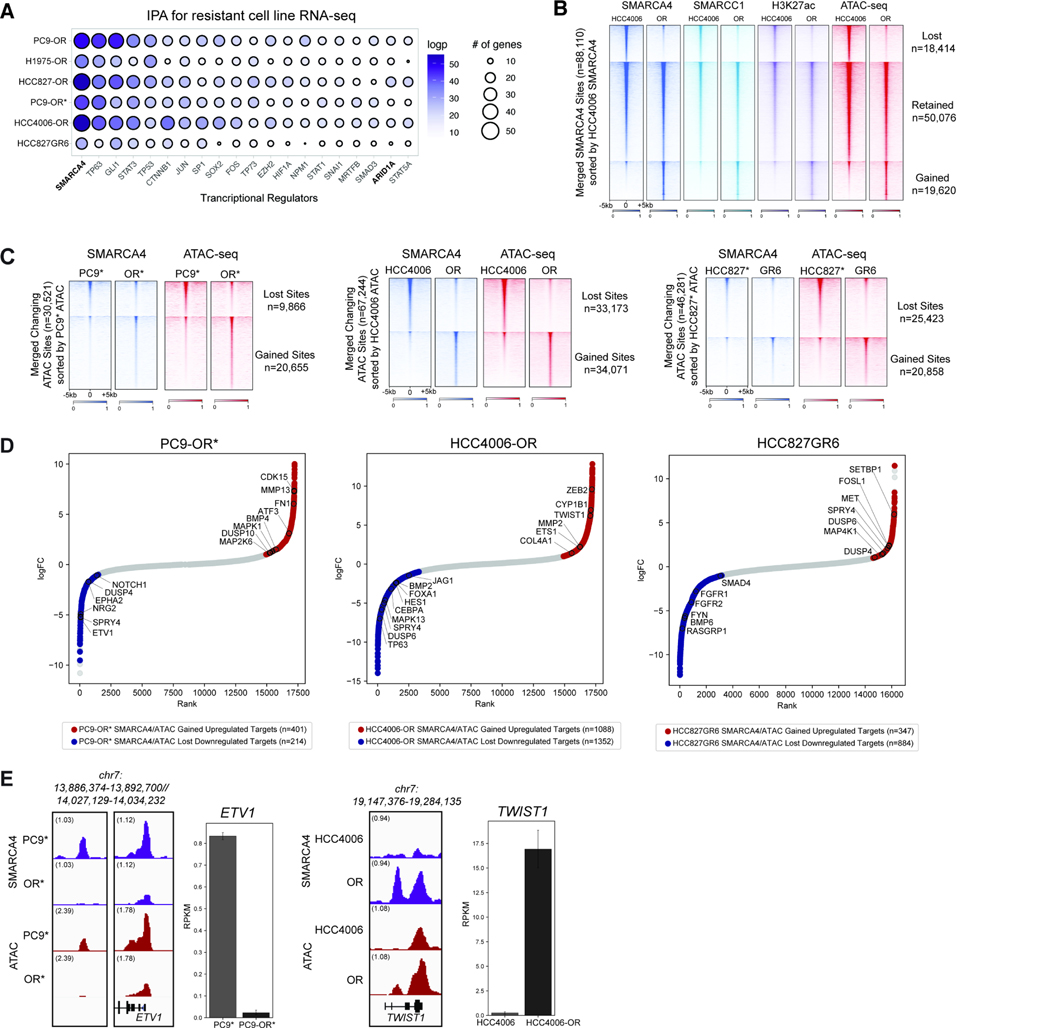
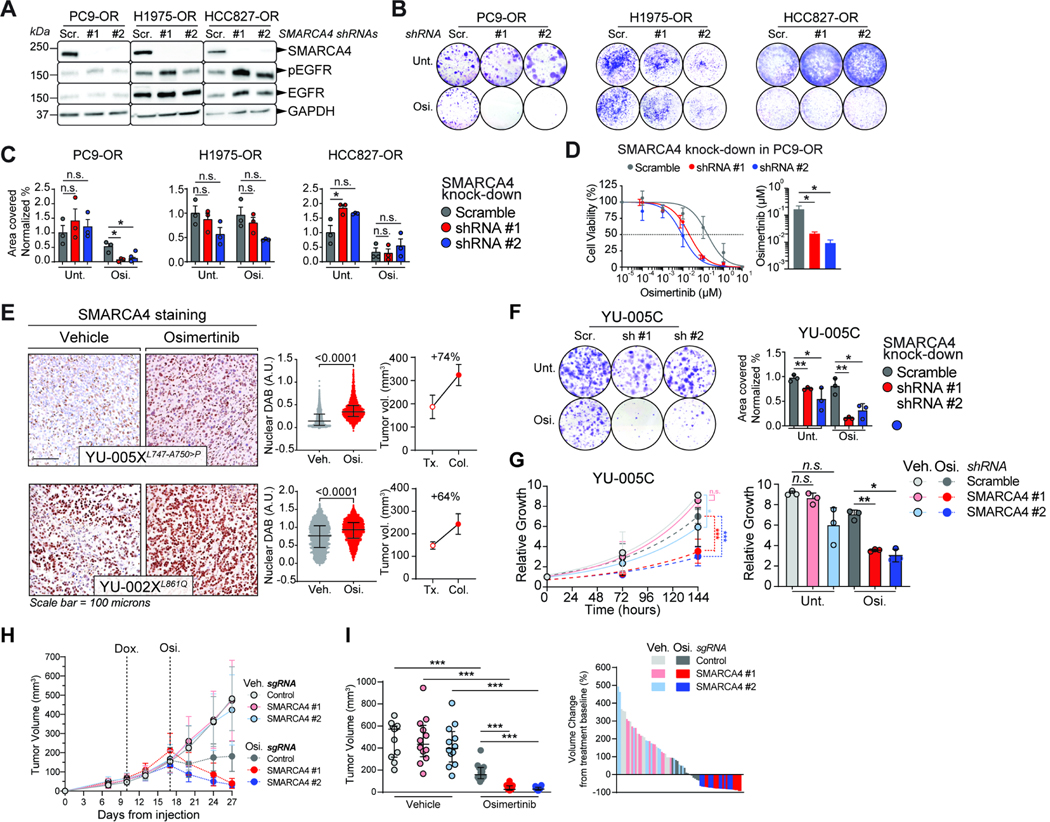
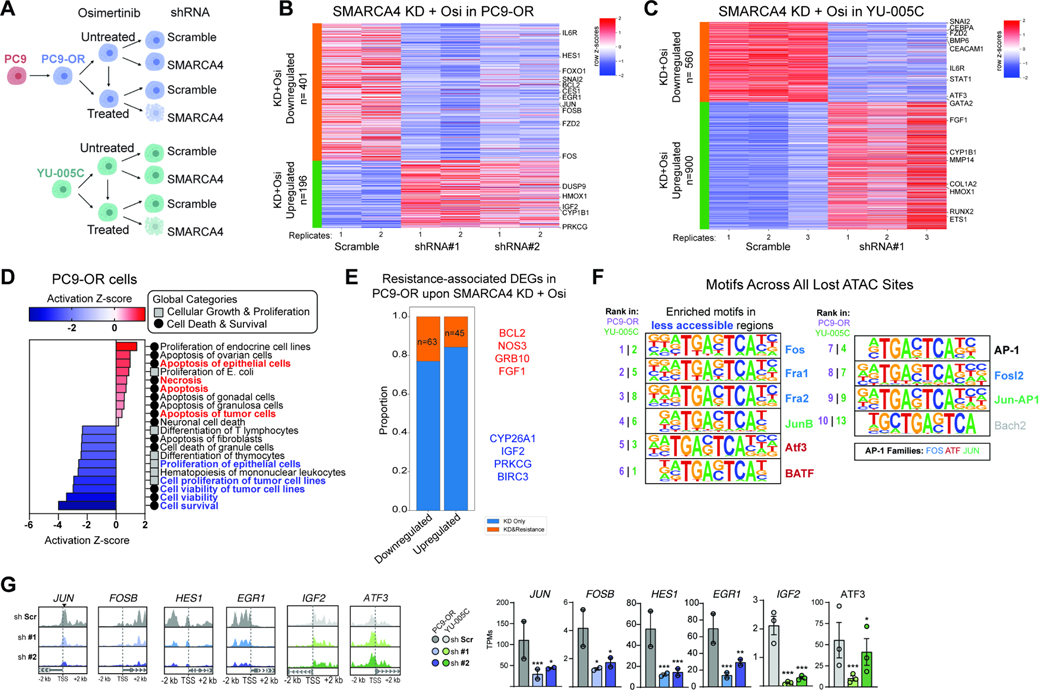
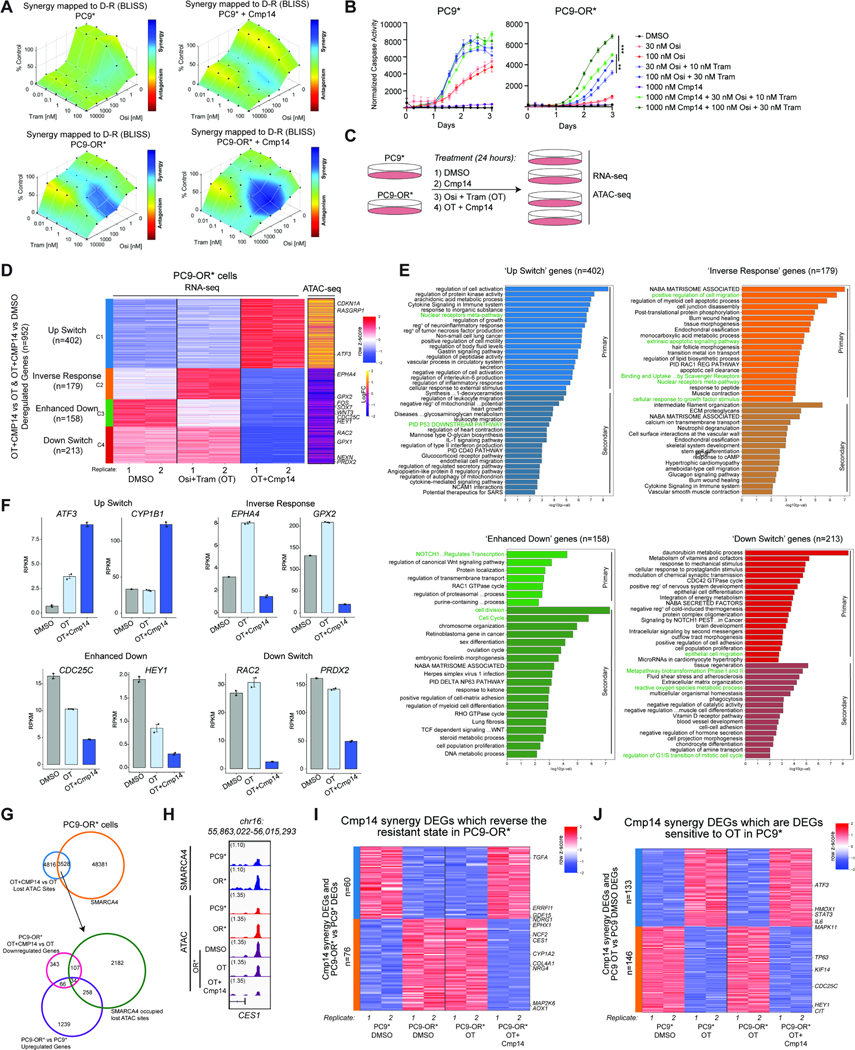
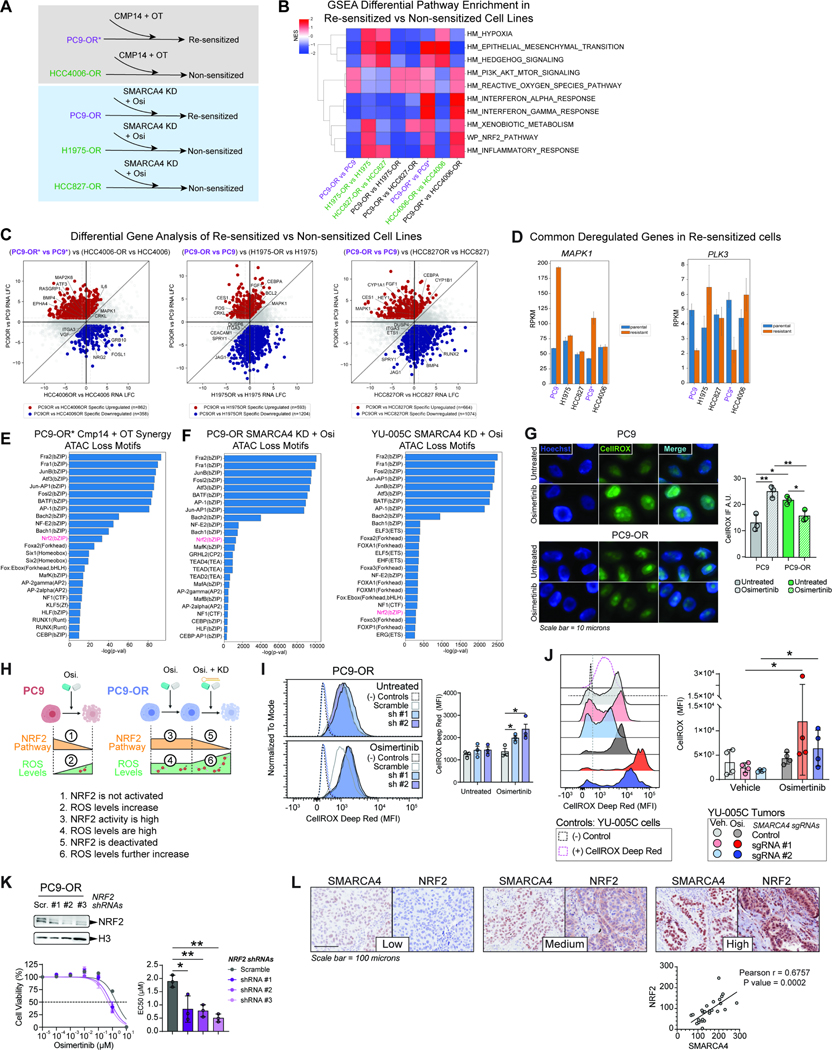
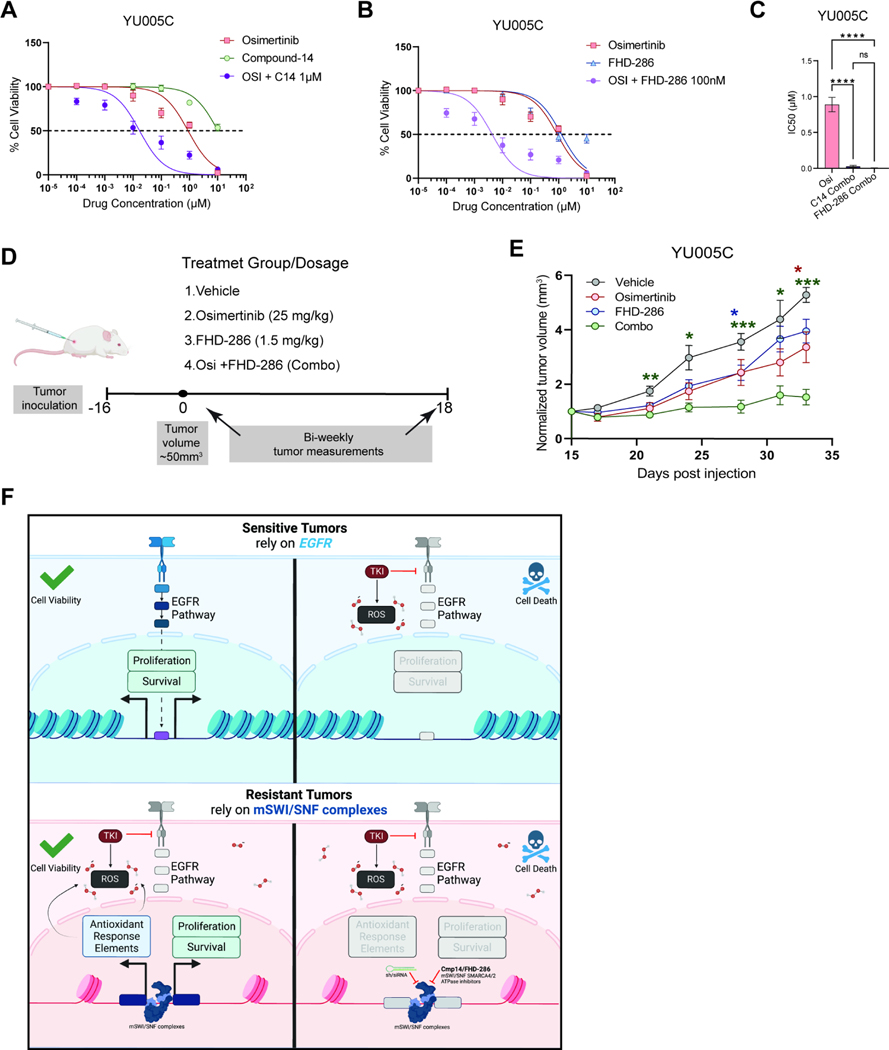
Acquired resistance to tyrosine kinase inhibitors (TKI), such as osimertinib used to treat EGFR-mutant lung adenocarcinomas, limits long-term efficacy and is frequently caused by non-genetic mechanisms. Here, we define the chromatin accessibility and gene regulatory signatures of osimertinib sensitive and resistant EGFR-mutant cell and patient-derived models and uncover a role for mammalian SWI/SNF chromatin remodeling complexes in TKI resistance. By profiling mSWI/SNF genome-wide localization, we identify both shared and cancer cell line-specific gene targets underlying the resistant state. Importantly, genetic and pharmacologic disruption of the SMARCA4/SMARCA2 mSWI/SNF ATPases re-sensitizes a subset of resistant models to osimertinib via inhibition of mSWI/SNF-mediated regulation of cellular programs governing cell proliferation, epithelial-to-mesenchymal transition, epithelial cell differentiation, and NRF2 signaling. These data highlight the role of mSWI/SNF complexes in supporting TKI resistance and suggest potential utility of mSWI/SNF inhibitors in TKI-resistant lung cancers.


Conflict of interest statement

Declaration of interests C.K. is the Scientific Founder, Scientific Advisor to the Board of Directors, Scientific Advisory Board member, shareholder, and consultant for Foghorn Therapeutics, Inc. (Cambridge, MA), serves on the Scientific Advisory Boards of Nereid Therapeutics, Nested Therapeutics, Accent Therapeutics, and Fibrogen, Inc. and is a consultant for Cell Signaling Technologies and Google Ventures. C.K. is also a member of the Molecular Cell and Cell Chemical Biology Editorial Boards. D.L. Rimm reports grants and personal fees from Amgen, Astra Zeneca, Cepheid, Konica – Minolta, Lilly, NextCure and personal fees from Cell Signaling Technology, Danaher, Fluidigm, GSK, Merck, Monopteros, NanoString, Odonate, Paige.AI, Regeneron, Roche, Sanofi, Ventana, Verily. K. Politi reports grants from the NCI/NIH; grants and personal fees from AstraZeneca; grants from Kolltan, Roche/Genentech, Boehringer Ingelheim, D2G Oncology and Symphogen; and personal fees from Janssen, Dynamo Therapeutics, Halda, Maverick Therapeutics, and Tocagen; and a patent for EGFR(T790M) mutation testing issued, licensed, and with royalties paid from Molecular Diagnostics/Memorial Sloan Kettering Cancer Center. P.A.J. is an equity owner in Gatekeeper Pharmaceuticals; consults for AstraZeneca, Boehringer Ingelheim, Pfizer, Roche/Genentech, Chugai Pharmaceuticals, Eli Lilly Pharmaceuticals, Araxes Pharmaceuticals, SFJ Pharmaceuticals, Voronoi, Daiichi Sankyo, Biocartis, Novartis, Sanofi, Takeda Oncology, Mirati Therapeutics, Transcenta, Silicon Therapeutics, Syndax, Nuvalent, Bayer, Esai, Allorion Therapeutics, Accutar Biotech, and Abbvie; receives research support from AstraZeneca, Daiichi Sankyo, PUMA, Eli Lilly, Boehringer Ingelheim, Revolution Medicines, and Takeda Oncology and is a co-inventor and receives postmarketing royalties on a DFCI owned patent on EGFR mutations licensed to LabCorp. Q.Y. reports grants and personal fees from AstraZeneca, and is a Scientific Advisory Board member of AccuraGen Inc. D.X.N received research funding from AstraZeneca. The other authors declare no competing interests.

Figures

Figure 1.
Figure 1.. Chromatin accessibility and gene regulatory underpinnings of osimertinib resistance in EGFR-mutant lung cancer cell lines.
A. Schematic representation of the generation of the TKI- resistant cell lines. B. Osimertinib dose-response curves for the parental cell lines and their TKI-resistant counterparts (n=3 experimental replicates; mean ± SEM is shown). C. Bar graphs (mean ± SEM) of EC50 values for parental and TKI-resistant isogenic cell line pairs. The fold-change in osimertinib EC50 values between resistant and parental cells is indicated. D. Clustered heatmap performed on n=2–4 RNA-seq profiles (raw RPKM) from all parental and resistant cell line pairs. Examples of significant genes are labeled. RPKM signals were z-scored separately within each cell line pair and combined horizontally to highlight differences between parental and resistant states. E. GSEA for pathway enrichment using DEGs from parental and resistant cell line pairs. F. Heatmap representation of ATAC-seq peaks in PC9*, HCC4006, HCC827* and PC9 parental cell lines and their resistant counterparts sorted by RPKM values over all accessible genomic sites. G. Pie chart representation of proportion of DEGs (resistant cell line vs parental) near concordantly changed ATAC-seq peaks in PC9*, HCC4006, HCC827* and PC9 cell line pairs. H. ATAC-seq tracks over the MAPK1, CRKL and JAG1 loci in the PC9 and HCC4006 cell line pairs. Gene expression RPKM values are shown in bar graphs. Error bars represent the 95% confidence interval around the mean expression level for each cell line. See also Figure S1.
Figure 2.
Figure 2.. Mammalian SWI/SNF (BAF) complexes as critical regulators of resistance-associated gene loci.
A. Ingenuity Pathway Analysis (IPA) performed on differentially-regulated genes in parental versus resistant cell line pairs. Top 20 most significant transcriptional upstream regulators are shown; Circle size indicates the number of genes regulated. Circle color represents significance as measured by logpvalue <0.05. B. Heatmap for SMARCA4, SMARCC1, and H3K27ac occupancy (CUT&RUN) levels and ATAC-seq chromatin accessibility in HCC4006/HCC4006-OR cell lines across merged SMARCA4 sites. C. Heatmap displaying SMARCA4 occupancy levels and ATAC-seq chromatin accessibility in PC9*/PC9-OR*, HCC4006/HCC4006-OR and HCC827*/HCC827GR6 cell lines, across merged differential ATAC-seq sites. D. Hockey-stick plots representing the normalized rank and signals of RNA-seq in PC9-OR*, HCC4006-OR and HCC827GR6 cell lines. Representative SMARCA4/ATAC gained-associated genes that are upregulated are in red and representative BAF/ATAC lost-associated genes that are downregulated are in blue. E. SMARCA4 and ATAC-seq tracks at the ETV1 (in PC9*/OR*) and TWIST1 (in HCC4006/OR) loci. RNA-seq expression signal (RPKM) is shown for each; error bars represent the 95% confidence interval around the mean expression level. See also Figure S2.
Figure 3.
Figure 3.. SMARCA4 loss sensitizes a subset of resistant tumors to osimertinib.
A. Western blots of OR cells transduced with SMARCA4-targeting shRNAs. Scramble (Scr.); SMARCA4 knockdown (#1 and #2). B-C. Representative colony formation assay in OR cells. (B). Quantification of the results for independent triplicates (C). Osimertinib doses: 750 nM (PC9-OR, HCC827-OR); 1500 nM (H1975-OR). D. Osimertinib dose-response curves for PC9-OR cells after 7 days of SMARCA4 knockdown. Significance was calculated using a paired t test and the Mean ± SEM is shown. *P<0.05. E. IHC staining for SMARCA4 on PDXs treated either with vehicle or osimertinib (left). Quantification of diaminobenzidine (DAB) intensity (middle) A.U., arbitrary units. Tumor volume change from the start of treatment (Tx.) to the day the tumor was collected (Col.) (right). F. Representative colony formation assay in YU-005C cells after one-week of SMARCA4 knock-down (left). Quantification of data from independent triplicates is shown (right). G. Proliferation curves of YU-005C cells one week after shRNA induction (left). Plot of the relative growth of the cells at the proliferation assay end-point. Data from three independent replicates are shown (right). H-I. Tumor volume of YU-005C cells injected subcutaneously in mice (left). ime-Dox., initiation of doxycycline to knock-out SMARCA4. Osi., start of osimertinib treatment. Tumor volume after two weeks of osimertinib treatment (middle). Waterfall plot after 2 weeks of osimertinib treatment (right). Significance was calculated using a Mann-Whitney test and the Median ± IQR for C, F-G. Significance was calculated using a paired t test and the Mean ± SEM is shown in I. ***P<0.001, **P<0.01, *P<0.05. See also Figure S3.
Figure 4.
Figure 4.. SMARCA4 suppression in osimertinib-resistant cell lines regulates resistance-associated genes.
A. Experimental design for SMARCA4 knockdown (KD) in PC9-OR and YU-005C cells. Seven days after knockdown the cells were treated with osimertinib for 72 hours. B-C. Heatmaps reflecting row Z-score values for up- and- down- regulated genes in PC9-OR and YU-005C cells following SMARCA4 knockdown and osimertinib treatment. Top gene hits are indicated. D. Heatmap generated by IPA reflecting Z-scored enrichment of gene pathways affected in osimertinib treated PC9-OR cells upon SMARCA4 knockdown. E. Stacked bar graph depicting number of resistance-associated genes impacted by SMARCA4 knockdown + osi treatment in PC9-OR cells. Key up- and down-regulated genes are in red and blue, respectively. F. Motifs under differentially-accessible sites genome-wide in osimertinib treated PC9-OR (purple rank) and YU-005C (green rank) cells upon SMARCA4 KD. G. Representative ATAC-seq tracks and bar graphs showing altered gene expression for key resistance-associated genes. Mean ± SEM. Significance was calculated using DESeq2. ***P<0.001, *P<0.05. See also Figure S4.
Figure 5.
Figure 5.. Pharmacologic targeting of mSWI/SNF complex ATPase activity reverses the TKI resistance program in a subset of EGFR-mutant cancer cell lines.
A. Drug synergy plots in PC9* and PC9-OR* cells as assayed by Combenefit software. Bliss synergy scores were calculated for each drug combination, osimertinib (osi) and trametinib (Tram) in the absence or presence of Compound14 (Cmp14) after 72 hours. One representative experiment out of N=3 independent experiments is shown. B. Caspase-3/7 activity assays performed in PC9* and PC9-OR* cells across 3 days of drug treatment. A low and high concentration of osi and tram were used in these assays to highlight enhanced sensitization effects. Graphs represent fluorescent signals normalized to cellular confluency at each timepoint. One representative experiment out of N=5 independent experiments is shown. Data presented as Mean ± SEM with significance calculated at the last timepoint using an unpaired t test ***P<0.0005, **P<0.005. C. Experimental design for ATAC-seq and RNA-seq performed in PC9* and PC9-OR* cells following 24 hours of each treatment. D. RNA-seq clustered heatmap of Cmp14 synergy genes in PC9-OR* cells. Biological replicates are represented for DMSO, OT and OT+Cmp14 treatments. Expression signals were z-scored across the samples. Genes were k-means clustered (k=4) and clusters were reordered. The greatest coordinated ATAC-seq changes (in logFCs) between OT+CMP14 and OT in PC9-OR* for each gene are shown as a yellow/purple heatmap. Select genes are labeled. E. Metascape analysis of genes from each cluster of Cmp14 synergy genes separated by correlation to ATAC-seq signal. Primary analysis represents DEGs which have a closest associated change in ATAC peak while secondary analysis represents DEGs without an associated ATAC peak change. Cluster specific or common terms are highlighted. F. Bar graphs of key deregulated Cmp14 synergy genes from each RNA-seq cluster from (D) showing average RPKM values for each condition with one SEM for the error bars. G. Venn diagram representation of SMARCA4 occupied sites in PC9-OR* cells which overlap with lost ATAC sites at Cmp14 synergy DARs (upper). A subset of these sites overlap with upregulated DEGs which characterize the resistant state (PC9-OR* vs PC9*) and are subsequently downregulated by Cmp14 synergy treatment (lower). H. IGV tracks of SMARCA4 occupancy (Cut&Run) and accessibility (ATAC-seq) at the CES1 locus. I. RNA-seq heatmap of RPKM values of Cmp14 Synergy DEGs at resistant-state associated genes. Values are shown for PC9* and PC9-OR* cells under DMSO treatment as compared to PC9-OR* cells under OT and OT+Cmp14 treatments. J. RNA-seq heatmap of RPKM values of Cmp14 Synergy DEGs in PC9* cells under DMSO and OT treatments and in PC9-OR* cells under OT and OT+Cmp14 treatments. See also Figure S5.
Figure 6.
Figure 6.. Resensitization of osimertinib-resistant cell lines reveals attenuation of reactive oxygen species by SMARCA4.
A. Schematic overview of cell lines which are responsive (resensitized; purple) and non-responsive (green) to osimertinib treatment upon inhibition or knock down of SMARCA4. B. GSEA pathway enrichment analysis of differentially expressed genes (DEGs) between each parental and osimertinib-resistant cell line pair as well as sensitized cell line DEGs vs. non sensitized cell line DEGs. C. Quadrant plots of differentially expressed genes specific to the resistant PC9-OR* state as compared to HCC4006-OR and specific to the resistant PC9-OR state as compared to H1975-OR and HCC827-OR. Upregulated genes (red), downregulated genes (blue). Gene examples are labelled. D. Bar graphs of key gene examples that are specifically upregulated and downregulated common to PC9-OR* and PC9-OR showing RPKM values across cell lines. E-F. Motif analysis of lost ATAC sites attributed to Cmp14+OT treatment in PC9-OR* cells (E) and attributed to SMARCA4 knock down in PC9-OR and YU-005C cells (F). G. Immunofluorescence images (IF) of cells stained using CellROX to quantify ROS in PC9 and PC9-OR cells in the presence and absence of 750 nM osimertinib. Hoechst staining was used to detect nuclear DNA (left). CellROX IF quantification of three independent replicates is shown (right). A.U., arbitrary units. H. Schematic model of ROS levels, NRF2 pathway activity, SMARCA4 regulation and osimertinib sensitivity. Upon osimertinib treatment NRF2 targets are downregulated, and ROS levels increase in PC9 cells (1 and 2). In treated PC9-OR cells NRF2 targets are activated, and ROS levels are high (3 and 4); upon SMARCA4 knockdown, NRF2 targets are downregulated and ROS levels further increase causing cellular toxicity. I-J. Flow cytometry using CellROX to measure ROS in PC9-OR cells (I) and in YU-005C tumors (J) in the presence and absence of osimertinib and with or without SMARCA4 knockdown. (−) Controls are from PC9-OR and YU-005C unstained cells respectively and (+) CellROX Deep Red control in (J) is from stained YU-005C cells. CellROX MFI was assessed in RFP+/shRNA-containing cells (I) and GFP+/sgRNA-containing cells (J). Representative MFI profile of CellROX+ cells (I:, J: left). Quantification of three independent replicates (I: right) and four tumors (J: right). K. Western blot of PC9-OR cells transduced with three NRF2 shRNAs as indicated (upper). Osimertinib dose-response curves for PC9-OR cells after NRF2 knock-down (bottom left). Bar graph of EC50 values (bottom right). L. IHC staining for SMARCA4 and NRF2 in three representative cores of a TMA containing EGFR-mutant TKI-treated tumors (upper). Correlation plot of NRF2 and SMARCA4 H-Scores for all the tumors (lower). Significance was calculated using the Pearson r correlation test. Scr.: Scramble shRNA, sh #1: SMARCA4 shRNA #1; sh #2: SMARCA4 shRNA #2. Significance was calculated using a paired t test and the Mean ± SEM is shown in D, E and H. Significance was calculated using a Mann-Whitney test and the Median ± IQR is shown in F. **P<0.01, *P<0.05. See also Figure S6.
Figure 7.
Figure 7.. Pharmacological inhibition of mSWI/SNF ATPase activity sensitizes a patient-derived tumor to osimertinib.
A. Osimertinib, compound-14, and combination (titrated osimertinib + 1μM of Compound-14) dose-response curves for YU-005C cells. B. Osimertinib, FHD-286, and combination (titrated osimertinib + 100nM of FHD-286) dose-response curves for YU-005C cells. (A,B) N=4. The mean ± standard deviation is shown. C. Bar graph of IC50 values for YU-005C cells treated with osimertinib (alone), or in combination with compound-14 or FHD-286. The mean ± SEM is shown. Significance was calculated using the one-way repeated measures ANOVA test and Tukey’s multiple comparisons test. ***P<0.001, **P<0.01, *P<0.05. D. Experimental design. YU-005C cells were injected subcutaneously in mice that were treated with either vehicle, osimertinib, FHD-286 or the combination of both. E. Normalized tumor volume of YU-005C cells treated with either vehicle, osimertinib, FHD-286 or the combination. Individual tumor volumes reflect the change in volume from treatment baseline. Tumor volume mean and ± standard error of the mean is shown. Significance was calculated using the two-way repeated measures ANOVA test and Dunnett’s multiple comparisons test, with a single pooled variance. ***P<0.001, **P<0.01, *P<0.05. G. Schematic representation of the mechanistic model by which SMARCA4 promotes osimertinib resistance. Sensitive tumors rely on EGFR signaling pathway. Osimertinib blocks EGFR and generates ROS killing the cells. Resistant tumors rely on SMARCA4 to keep proliferating and neutralizing the accumulated ROS. Blocking SMARCA4 activity generates stress killing the cells. Created with Biorender.com. See also Figure S7.

References

    1. Bedard PL, Hyman DM, Davids MS, and Siu LL (2020). Small molecules, big impact: 20 years of targeted therapy in oncology. Lancet 395, 1078–1088. 10.1016/S0140-6736(20)30164-1. - DOI - PubMed
    1. Cohen P, Cross D, and Janne PA (2021). Kinase drug discovery 20 years after imatinib: progress and future directions. Nat Rev Drug Discov 20, 551–569. 10.1038/s41573-021-00195-4. - DOI - PMC - PubMed
    1. Kim G, McKee AE, Ning YM, Hazarika M, Theoret M, Johnson JR, Xu QC, Tang S, Sridhara R, Jiang X, et al. (2014). FDA approval summary: vemurafenib for treatment of unresectable or metastatic melanoma with the BRAFV600E mutation. Clin Cancer Res 20, 4994–5000. 10.1158/1078-0432.CCR-14-0776. - DOI - PubMed
    1. Tan AC, and Tan DSW (2022). Targeted Therapies for Lung Cancer Patients With Oncogenic Driver Molecular Alterations. J Clin Oncol 40, 611–625. 10.1200/JCO.21.01626. - DOI - PubMed
    1. Robson M, Im SA, Senkus E, Xu B, Domchek SM, Masuda N, Delaloge S, Li W, Tung N, Armstrong A, et al. (2017). Olaparib for Metastatic Breast Cancer in Patients with a Germline BRCA Mutation. N Engl J Med 377, 523–533. 10.1056/NEJMoa1706450. - DOI - PubMed

Publication types