. 2023 Sep 5;35(9):1630-1645.e5.
doi: 10.1016/j.cmet.2023.07.003. Epub 2023 Aug 3.

Neddylation of phosphoenolpyruvate carboxykinase 1 controls glucose metabolism

Affiliations

Neddylation of phosphoenolpyruvate carboxykinase 1 controls glucose metabolism

María J Gonzalez-Rellan et al. Cell Metab. .

Abstract

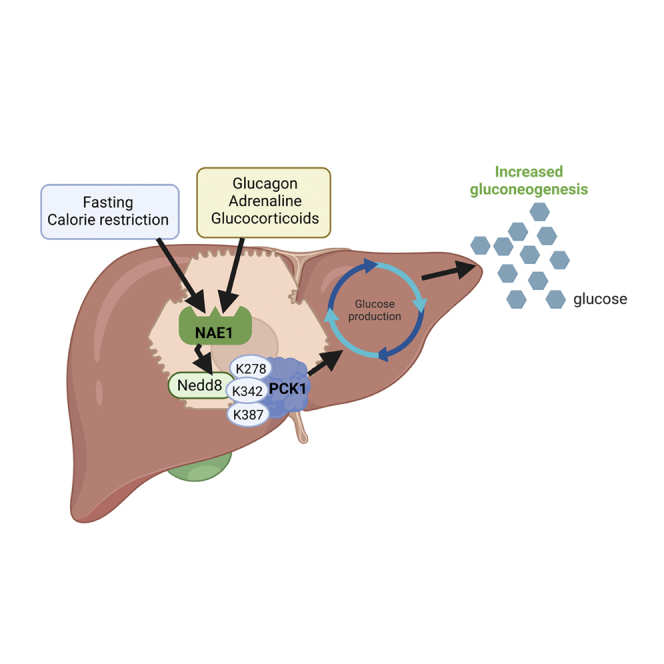
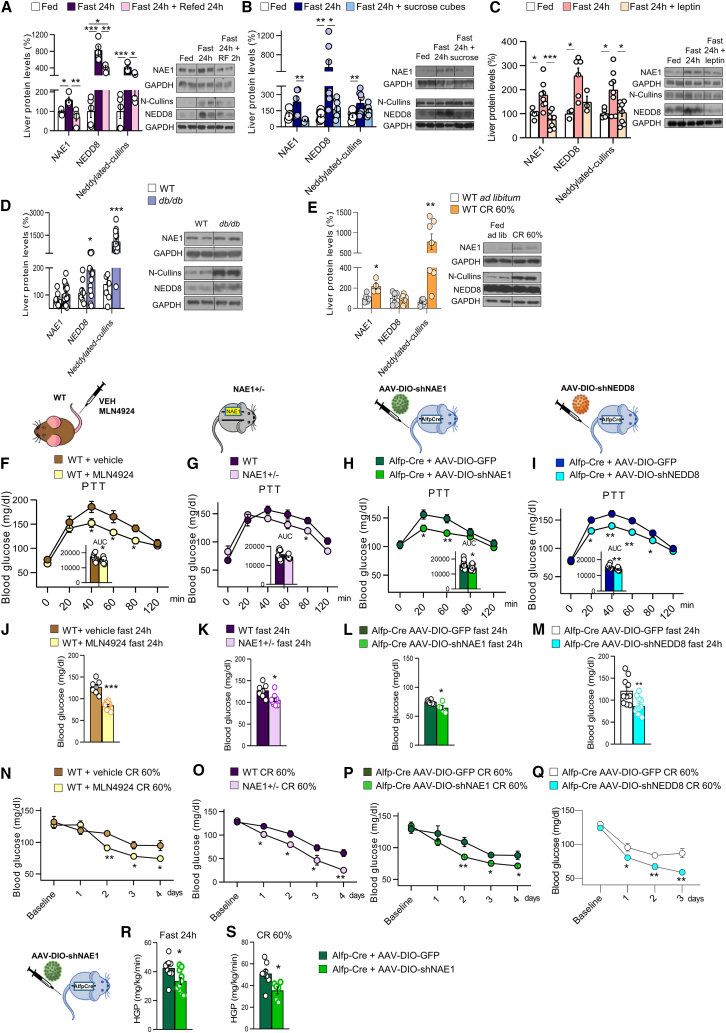
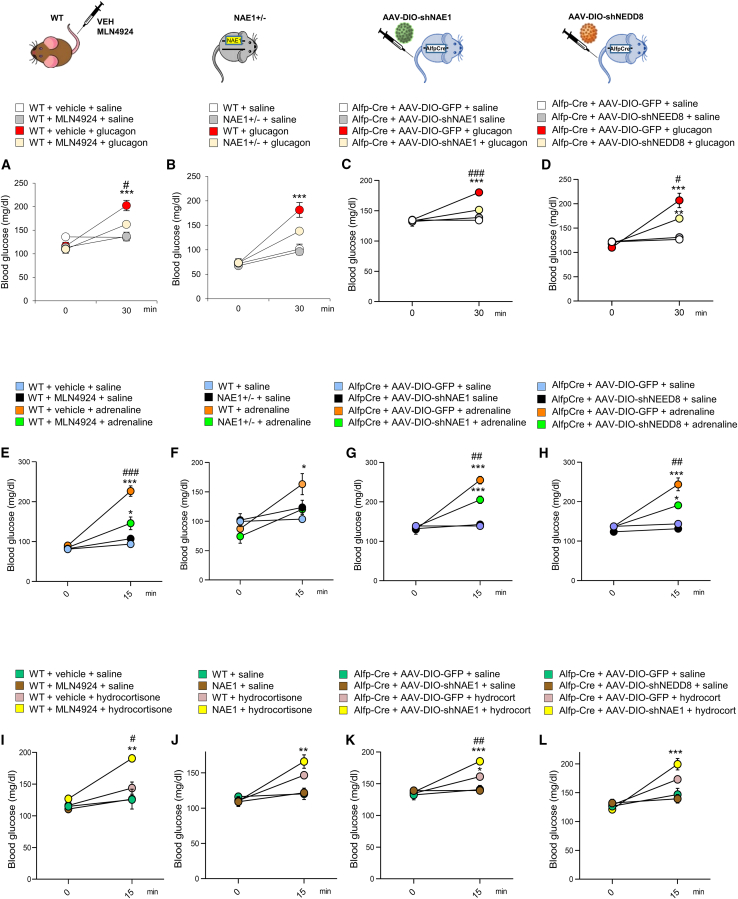
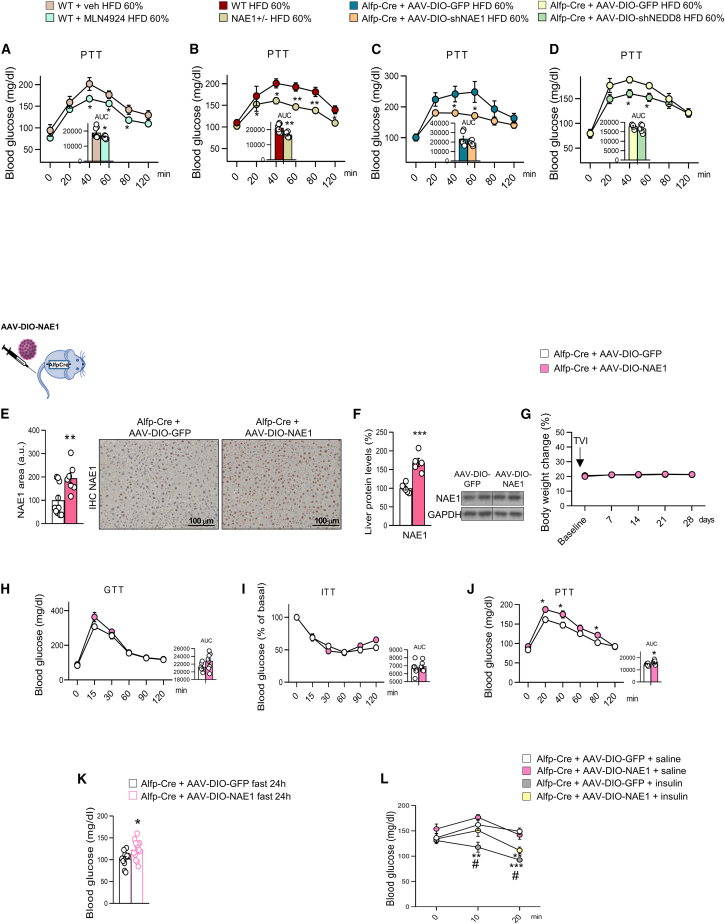
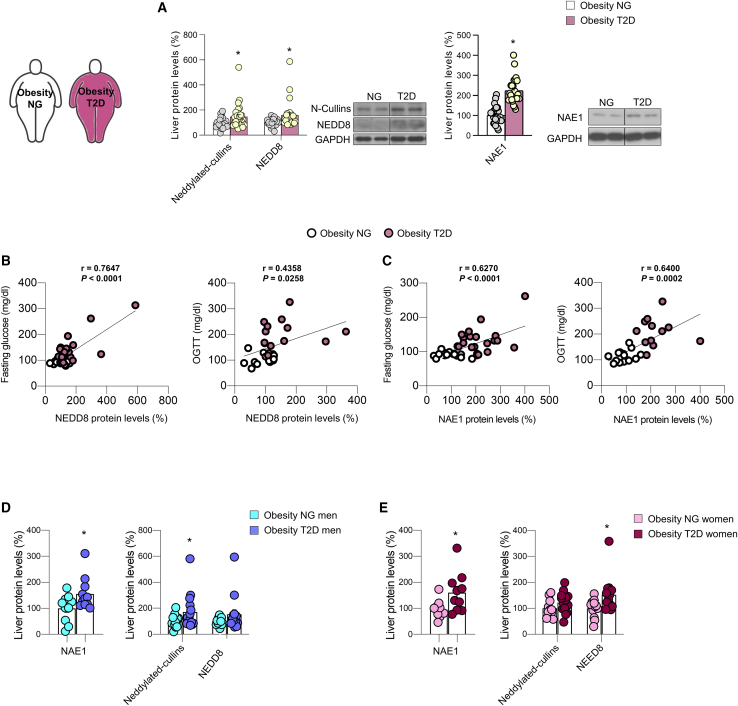
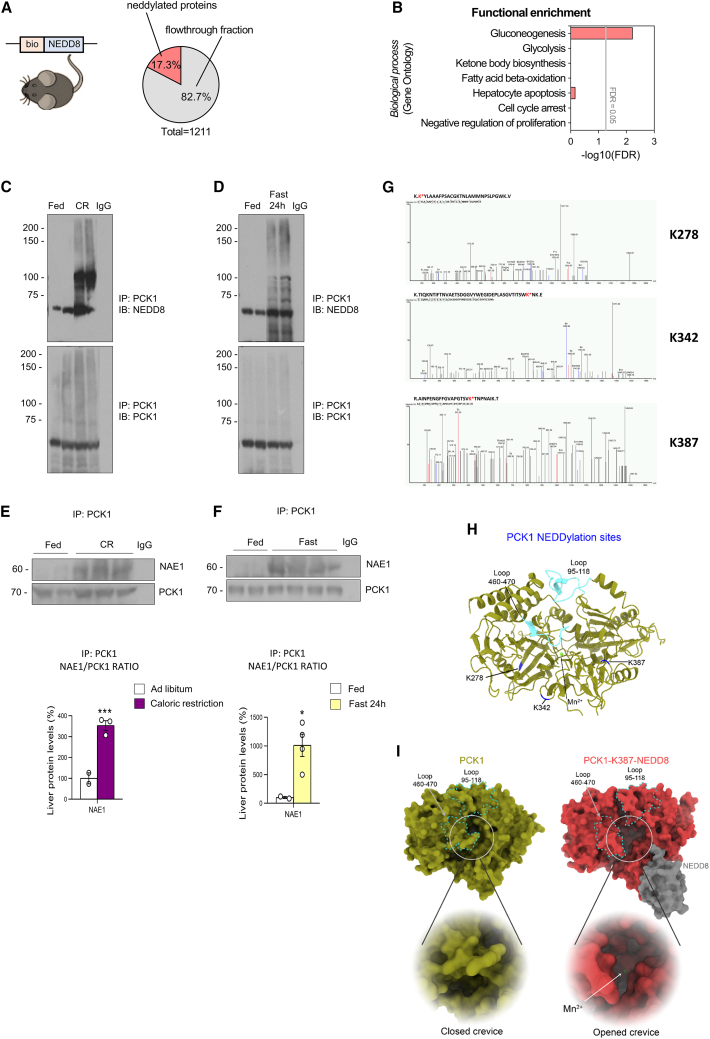
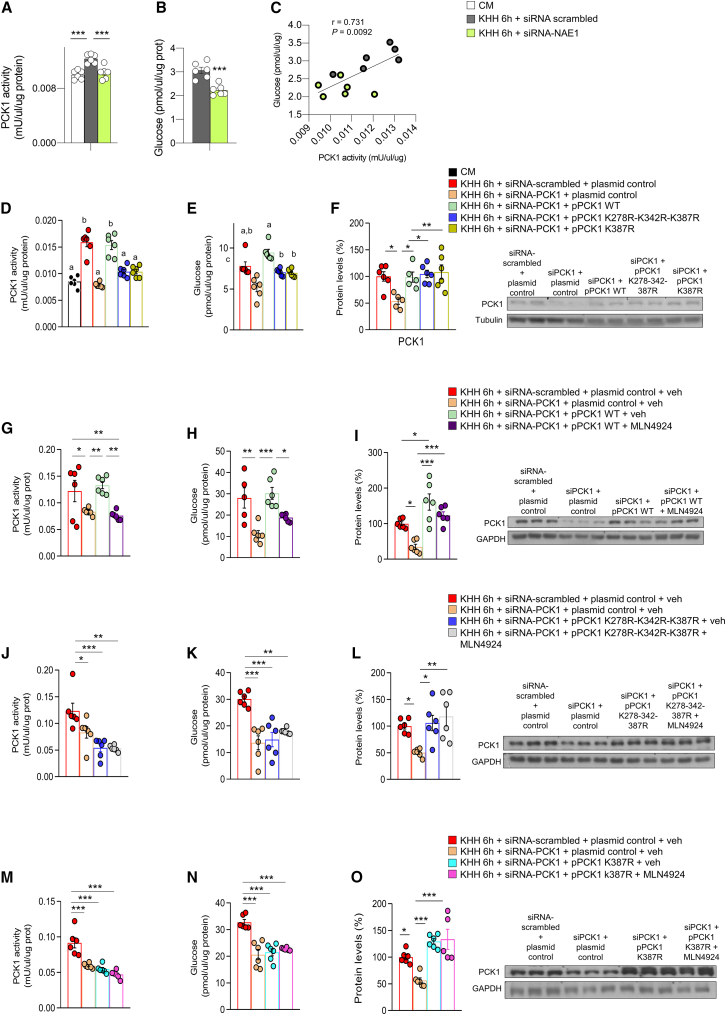
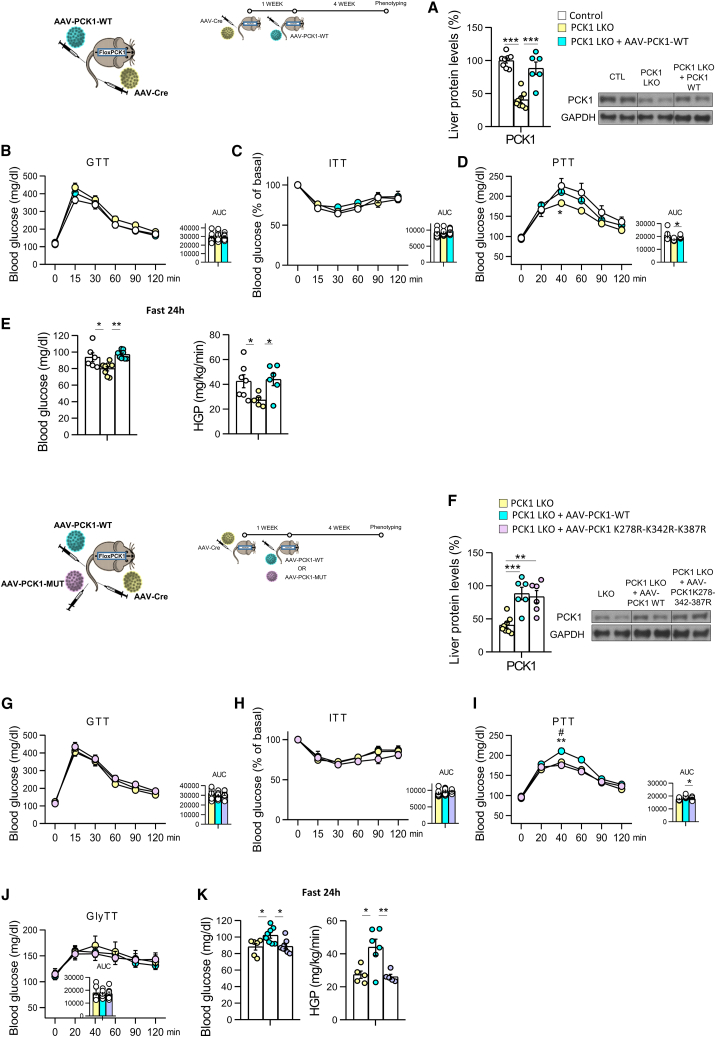
Neddylation is a post-translational mechanism that adds a ubiquitin-like protein, namely neural precursor cell expressed developmentally downregulated protein 8 (NEDD8). Here, we show that neddylation in mouse liver is modulated by nutrient availability. Inhibition of neddylation in mouse liver reduces gluconeogenic capacity and the hyperglycemic actions of counter-regulatory hormones. Furthermore, people with type 2 diabetes display elevated hepatic neddylation levels. Mechanistically, fasting or caloric restriction of mice leads to neddylation of phosphoenolpyruvate carboxykinase 1 (PCK1) at three lysine residues-K278, K342, and K387. We find that mutating the three PCK1 lysines that are neddylated reduces their gluconeogenic activity rate. Molecular dynamics simulations show that neddylation of PCK1 could re-position two loops surrounding the catalytic center into an open configuration, rendering the catalytic center more accessible. Our study reveals that neddylation of PCK1 provides a finely tuned mechanism of controlling glucose metabolism by linking whole nutrient availability to metabolic homeostasis.

Keywords: PCK1; calorie restriction; fasting; glucagon; glucose metabolism; neddylation; type 2 diabetes.


Conflict of interest statement

Declaration of interests The authors declare no competing interests.

Figures

None
Graphical abstract
Figure 1
Figure 1
Neddylation is activated during nutrient deprivation and is required to maintain blood glucose levels (A–E) The hepatic protein levels for NAE1, NEDD8, and neddylated-cullins were determined from mice in the following conditions: (A) after (i) ad libitum feeding (as a control), (ii) 24-h fast; or (iii) 24-h fast plus 24-h refeed (n = 4–5 per group); (B) after (i) ad libitum feeding, (ii) 24-h fast; or (iii) 24-h fast followed by a sugar feeding (n = 5 or 8 per group); (C) after (i) ad libitum feeding, (ii) 24-h fast; or (iii) 24-h fast followed by leptin i.p. (n = 5–8 per group); (D) wild-type and db/db mice; and (E) after (i) ad libitum feeding; or (ii) caloric restriction (CR) (n = 8–18 per group). (F–I) Pyruvate tolerance test (PTT) of (F) wild-type (WT) mice treated with vehicle or the NAE1-inhibitor MLN4924, (G) NAE1+/− mice or their control littermates, (H) Alfp-Cre+/− mice injected with AAV-DIO expressing either GFP or shNAE1 and (I) Alfp-Cre+/− mice injected with AAV-DIO expressing either GFP or shNEDD8. (J–M) Blood glucose levels after 24-h fasting for (J) WT mice treated with vehicle or MLN4924, (K) NAE1+/− mice and their control littermates, (L) Alfp-Cre+/− mice injected with AAV-DIO expressing either GFP or shNAE1 and (M) Alfp-Cre+/− mice injected with AAV-DIO expressing either GFP or shNEDD8. (N–Q) Blood glucose levels of mice subjected to 60% CR for (N) WT mice treated with vehicle or MLN4924, (O) NAE1+/− mice or their control littermates, (P) Alfp-Cre+/− mice injected with AAV-DIO expressing either GFP or shNAE1 and (Q) Alfp-Cre+/− mice injected with AAV-DIO expressing either GFP or shNEDD8; n = 5–15 per group. (R and S) (R) Hepatic glucose production in Alfp-Cre+/− mice injected with AAV-DIO expressing either GFP or shNAE1 upon fasting and (S) caloric restriction; n = 6–10. Expression of glyceraldehyde 3- phosphate dehydrogenase (GAPDH) served as a loading control, and control values were normalized to 100%. Data are presented as mean ± SEM; two-tailed unpaired t test (D–S) and one-way ANOVA followed by Bonferroni post hoc test (A–C) p < 0.05, ∗∗p < 0.01 and ∗∗∗p < 0.001.
Figure 2
Figure 2
Neddylation is required for the gluconeogenic action of counter-regulatory hormones (A–D) Blood glucose after intraperitoneal (i.p.) administration of saline or glucagon (200 μg kg−1) for (A) WT mice treated with vehicle or MLN4924, (B) NAE1+/− mice or their control littermates, (C) Alfp-Cre+/− mice injected with AAV-DIO expressing either GFP or shNAE1 and (D) Alfp-Cre+/− mice injected with AAV-DIO expressing either GFP or shNEDD8. (E–H) Blood glucose levels after i.p. administration of saline or adrenaline (100 μg kg−1) for (E) WT mice treated with vehicle or MLN4924, (F) NAE1+/− and their control littermates, (G) Alfp-Cre+/− mice injected with AAV-DIO expressing either GFP or shNAE1 and (H) Alfp-Cre+/− mice injected with AAV-DIO expressing either GFP or shNEDD8. (I–L) Blood glucose after i.p. administration of saline or hydrocortisone (20 mg kg−1) for (I) WT mice treated with vehicle or MLN4924, (J) NAE1+/− mice or their control littermates, (K) Alfp-Cre+/− mice injected with AAV-DIO expressing either GFP or shNAE1 and (L) Alfp-Cre+/− mice injected with AAV-DIO expressing either GFP or shNEDD8; n = 3–10 per group. Data are presented as mean ± SEM; one-way ANOVA followed by Bonferroni post hoc test: p < 0.05, ∗∗p < 0.01 and ∗∗∗p < 0.001. # denotes differences among the different animal groups treated with the same glucoregulatory hormone.
Figure 3
Figure 3
Inhibition of neddylation reduces high-fat diet-induced-glucose levels (A–K) Pyruvate tolerance test (PTT) from mice fed a HFD (60%) for 4 days, for (A) WT mice treated with vehicle or MLN4924, (B) NAE1+/− mice or their control littermates, (C) Alfp-Cre+/− mice injected with AAV-DIO expressing either GFP or shNAE1 and (D) Alfp-Cre+/− mice injected with AAV-DIO expressing GFP or shNEDD8. NAE1 protein levels detected by immunohistochemistry (E) and western blot (F) in Alfp-Cre+/− mice injected with AAV-DIO-GFP or AAV-DIO-NAE1 to overexpress NAE1. Body weight evolution (G), GTT (H), ITT (I), and PTT (J) for Alfp-Cre+/− mice injected with AAV-DIO expressing GFP or NAE1. Blood glucose levels (K) after 24-h fasting for Alfp-Cre+/− mice injected with AAV-DIO expressing GFP or NAE1. (L) Blood glucose levels in Alfp-Cre+/− mice injected with AAV-DIO expressing GFP or NAE1 and treated with saline or insulin (0.35 U kg−1); n = 5–15 per group. Expression of GAPDH served as a loading control, and control values were normalized to 100%. Data are presented as mean ± SEM; two-tailed unpaired t test (A–K) and one-way ANOVA followed by Bonferroni post hoc test (L): p < 0.05, ∗∗p < 0.01 and ∗∗∗p < 0.001. # denotes differences among animal groups treated with insulin.
Figure 4
Figure 4
Neddylation is elevated in the liver of people with T2D (A–D) (A) Protein levels of neddylated cullins, free NEDD8 and NAE1 in adults with obesity who were subclassified as having normoglycemia (NG) or type 2 diabetes (T2D) (n = 30 per group). (B and C) Correlations between the protein levels of NEDD8 and NAE1 and the fasting glucose (mg dL−1) or oral glucose tolerance test (OGTT) (mg dL−1). (D and E) Protein levels of neddylated cullins, free NEDD8 and NAE1 in (D) men and (E) women with obesity who were subclassified as having normoglycemia (NG) or type 2 diabetes (T2D). Expression of GAPDH served as loading control, and control values were normalized to 100%. Data are presented as mean ± SEM; two-tailed unpaired t test: p < 0.05, ∗∗p < 0.01, and ∗∗∗p < 0.001.
Figure 5
Figure 5
PCK1 is neddylated in three lysines after caloric restriction and fasting (A) Pie chart showing the percentage of neddylated proteins from the total hepatic proteins identified in bionedd8 mice, as determined by LC-MS/MS proteomics (n = 4 or 5). (B–D) (B) PANTHER functional enrichment analysis of neddylated proteins in liver. Neddylation of PCK1 during a 4-day caloric restriction (of 60%) (C) or 24-h fasting (D), as shown by immunoblot after immunoprecipitation of PCK1. (E and F) PCK1 and NAE1 protein levels after the immunoprecipitation of PCK1, and NAE1 protein levels relativized to immunoprecipitated PCK1, from the livers of mice fed ad libitum or subjected to a 4-day caloric restriction (of 60%) (E) or 24-h fasting (F); n = 2–4. (G) Immunoprecipitated PCK1 was subjected to mass spectrometry analysis. Possible modified sites are shown. K, modified with GG. (H) Ribbon representation of M. musculus PCK1 structure with identified neddylation sites colored in dark blue. Loops 95–118 and 460–470 are highlighted in cyan, and the Mn2+ ion, in light green. (I) Average structures of PCK1 (left, olive) and PCK1-K387-NEDD8 (right, red) after molecular dynamics simulation. Neddylation of PCK1 alters the dynamics and conformation of loops 95–118 and 460–470 (cyan dashed lines). In-depth view of the opening the protein’s crevice upon PCK1 neddylation that makes the Mn2+ ion accessible to the substrate.
Figure 6
Figure 6
Neddylation of PCK1 is required for its gluconeogenic function in vitro (A and B) (A) PCK1 activity and (B) glucose production in AML12 cells maintained in complete medium (CM) or fasted in KHH medium, and transfected with small interfering RNA (siRNA)-scrambled or siRNA NAE1. (C) Correlation between glucose production and PCK1 activity. (D–F) (D) PCK1 activity, (E) glucose production, and (F) protein levels of PCK1 in AML12 cells maintained in complete or KHH medium and transfected with empty siRNA-scrambled, siRNA-PCK1, plasmid control, a plasmid encoding wild-type PCK1 or a plasmid encoding triple- or single-mutated PCK1 (pPCK1-K278R-K342R-K387R or pPCK1-K387R). (G–O) PCK1 activity, glucose production, and protein levels of PCK1 in AML12 cells under the same conditions as before and treated with MLN4924. n = 5–6. Expression of GAPDH served as a loading control, and control values were normalized to 100%. Data are presented as mean ± SEM; two-tailed unpaired t test (B) and one-way ANOVA followed by Bonferroni post hoc test (A and D–O) p < 0.05, ∗∗p < 0.01, and ∗∗∗p < 0.001.
Figure 7
Figure 7
Neddylation of PCK1 is required for its gluconeogenic function in vivo (A–E) (A) PCK1 protein levels, (B) glucose tolerance test (GTT), (C) insulin tolerance test (ITT), (D) pyruvate tolerance test (PTT), (E) 24 h fasting blood glucose levels, and hepatic glucose production in control mice, mice lacking PCK1 in the liver (PCK1 LKO) (PCK1 loxP mice injected with AAV-Cre in the tail vein) and PCK1 LKO injected with AAV-PCK1 wild type (WT). (F–K) (F) PCK1 protein levels, (G) GTT, (H) ITT, (I) PTT, (J) glycerol tolerance test (GlyTT), (K) 24 h fasting blood glucose levels and hepatic glucose production in control mice, PCK1 LKO, and PCK1 LKO injected with AAV-PCK1 triple mutant (n = 5–10 animals per group). Expression of GAPDH served as a loading control, and control values were normalized to 100%. Data are presented as mean ± SEM; one-way ANOVA followed by Bonferroni post hoc test: p < 0.05 and ∗∗∗p < 0.001. # denotes differences between PCK1 LKO + AAV-PCK1 WT mice and PCK1 LKO + AAV-PCK1-K278R-K342R-K387R.

References

    1. Petersen M.C., Vatner D.F., Shulman G.I. Regulation of hepatic glucose metabolism in health and disease. Nat. Rev. Endocrinol. 2017;13:572–587. doi: 10.1038/nrendo.2017.80. - DOI - PMC - PubMed
    1. Wang T., Hung C.C.Y., Randall D.J. The comparative physiology of food deprivation: from feast to famine. Annu. Rev. Physiol. 2006;68:223–251. doi: 10.1146/annurev.physiol.68.040104.105739. - DOI - PubMed
    1. Yoon J.C., Puigserver P., Chen G., Donovan J., Wu Z., Rhee J., Adelmant G., Stafford J., Kahn C.R., Granner D.K., et al. Control of hepatic gluconeogenesis through the transcriptional coactivator PGC-1. Nature. 2001;413:131–138. doi: 10.1038/35093050. - DOI - PubMed
    1. Roden M., Shulman G.I. The integrative biology of type 2 diabetes. Nature. 2019;576:51–60. doi: 10.1038/s41586-019-1797-8. - DOI - PubMed
    1. Zhang X., Yang S., Chen J., Su Z. Unraveling the regulation of hepatic gluconeogenesis. Front. Endocrinol. 2018;9:802. doi: 10.3389/fendo.2018.00802. - DOI - PMC - PubMed

Publication types