. 2023 Sep;10(27):e2206380.
doi: 10.1002/advs.202206380. Epub 2023 Aug 4.

EGFR-Induced and c-Src-Mediated CD47 Phosphorylation Inhibits TRIM21-Dependent Polyubiquitylation and Degradation of CD47 to Promote Tumor Immune Evasion

Affiliations

EGFR-Induced and c-Src-Mediated CD47 Phosphorylation Inhibits TRIM21-Dependent Polyubiquitylation and Degradation of CD47 to Promote Tumor Immune Evasion

Linyong Du et al. Adv Sci (Weinh). 2023 Sep.

Abstract

Tumor cells often overexpress immune checkpoint proteins, including CD47, for immune evasion. However, whether or how oncogenic activation of receptor tyrosine kinases, which are crucial drivers in tumor development, regulates CD47 expression is unknown. Here, it is demonstrated that epidermal growth factor receptor (EGFR) activation induces CD47 expression by increasing the binding of c-Src to CD47, leading to c-Src-mediated CD47 Y288 phosphorylation. This phosphorylation inhibits the interaction between the ubiquitin E3 ligase TRIM21 and CD47, thereby abrogating TRIM21-mediated CD47 K99/102 polyubiquitylation and CD47 degradation. Knock-in expression of CD47 Y288F reduces CD47 expression, increases macrophage phagocytosis of tumor cells, and inhibits brain tumor growth in mice. In contrast, knock-in expression of CD47 K99/102R elicits the opposite effects compared to CD47 Y288F expression. Importantly, CD47-SIRPα blockade with an anti-CD47 antibody treatment significantly enhances EGFR-targeted cancer therapy. In addition, CD47 expression levels in human glioblastoma (GBM) specimens correlate with EGFR and c-Src activation and aggravation of human GBM. These findings elucidate a novel mechanism underlying CD47 upregulation in EGFR-activated tumor cells and underscore the role of the EGFR-c-Src-TRIM21-CD47 signaling axis in tumor evasion and the potential to improve the current cancer therapy with a combination of CD47 blockade with EGFR-targeted remedy.

Keywords: CD47; TRIM21; c-Src; epidermal growth factor receptor; immune evasion; polyubiquitylation; tumor cells.


Conflict of interest statement

The authors declare no conflict of interest.

Figures

Figure 1
Figure 1
CD47 is highly expressed in GBM and correlates with a poor prognosis in GBM patients. A) Relative mRNA expression levels of the indicated genes were analyzed in the TCGA cohort of GBM (n = 162). B) Kaplan–Meier 18‐year overall survival analysis comparing CD47 high‐ and low‐expressing patients in the TCGA GBM cohort. The CD47 high and low groups were separated by the median expression. Significance was determined with the log‐rank test. p = 5.6 × 10⁻¹⁶; HR, 2.8. C) IHC staining of 75 human glioma specimens of different grades (II–IV) was performed with an anti‐CD47 antibody. Representative images of IHC staining from the specimens are shown. Scale bar, 100 µm. D) Immunoblotting analysis of CD47 protein expression in paired tumor‐adjacent normal tissues (N) and human GBM specimens (T). E) The protein expression levels of CD47 in NHA cells and the indicated human GBM and glioma stem cells (GSCs) were determined by immunoblotting analyses.
Figure 2
Figure 2
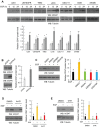
EGFR activation induces CD47 protein upregulation. A) The indicated human tumor cells were serum‐starved for 12 h and then stimulated with EGF (100 ng mL−1) for the indicated periods of time. Immunoblot analyses were performed with the indicated antibodies (top panel). Quantification of relative CD47 protein levels is shown (bottom panel). B) U87 cells were stably transfected with plasmids expressing control vector or EGFRvIII. Immunoblot analyses were performed with the indicated antibodies (left panel). Quantification of relative CD47 protein levels is shown (right panel). C) Serum‐starved U251 cells were stimulated with EGF (100 ng mL−1) for 24 h in the presence or absence of the indicated EGFR inhibitors. Immunoblot analyses were performed (left panel). Quantification of relative CD47 protein levels is shown (right panel). D) Serum‐starved U251 cells were stimulated with or without EGF (100 ng mL−1) for 24 h in the presence of DMSO or actinomycin D (1 µg mL−1). Immunoblot analyses were performed (left panel). Quantification of relative CD47 protein levels is shown (right panel). E) Serum‐starved U251 cells were stimulated with or without EGF (100 ng mL−1) for 24 h in the presence of DMSO or CHX (100 µg mL−1). Immunoblot analyses were performed (left panel). Quantification of relative CD47 protein levels is shown (right panel). The results represent the means ± SD; ANOVA two‐way test. Different letters indicate significant differences (p < 0.05); *, p < 0.05, **, p < 0.01 on the basis of Student's t‐test.
Figure 3
Figure 3
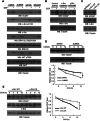
c‐Src activation induces CD47 protein upregulation in response to EGFR activation. Immunoblot analyses were performed with the indicated antibodies (A–E). A) Serum‐starved U251 cells were pretreated with the indicated inhibitors for 2 h and then stimulated with EGF (100 ng mL−1) for 24 h. B) Serum‐starved U251 cells with stable expression of different shRNAs against c‐Src or a control shRNA were stimulated with or without EGF (100 ng mL−1) for 24 h. C) U251 cells were transfected with a control vector, wild‐type (WT) c‐Src, or an active c‐Src (CA) for 48 h. D) U87/EGFRvIII cells were pretreated with DMSO or Su6656 (4 µm) for 2 h and then treated with CHX (100 µg mL−1) for the indicated periods of time. Quantification of relative CD47 protein levels is shown (bottom panel). E) U251 cells stably expressed c‐Src WT or c‐Src CA were treated with CHX (100 µg mL−1) for the indicated periods of time. Quantification of relative CD47 protein levels is shown (right panel).
Figure 4
Figure 4
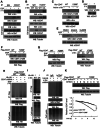
c‐Src binds to and phosphorylates CD47 at Y288, which subsequently upregulates CD47 stability by inhibiting CD47 polyubiquitylation. Immunoblotting analyses were performed with the indicated antibodies (A–K). A) Serum‐starved U251 cells were stimulated with or without EGF (100 ng mL−1) for 1 h. Endogenous CD47 was immunoprecipitated. B) U251 cells were transfected with c‐Src WT or c‐Src CA for 48 h. Endogenous CD47 was immunoprecipitated. C) In vitro kinase assays were performed by mixing purified WT His‐CD47 or His‐CD47 Y288F with or without active c‐Src. D) Serum‐starved U251 cells were stimulated with or without EGF (100 ng mL−1) for 1 h. E) Serum‐starved U251 cells were stimulated with or without EGF (100 ng mL−1) for 1 h in the presence or absence of the indicated inhibitors. F) HEK293T/EGFR cells were transiently transfected with WT Flag‐CD47 or the indicated Flag‐tagged mutants and stimulated with or without EGF (100 ng mL−1) for 24 h. G) HEK293T/EGFR cells were transiently transfected with WT Flag‐CD47 or the indicated Flag‐tagged mutants and stimulated with or without EGF (100 ng mL−1) for 24 h (left panel) or transiently co‐transfected with WT Flag‐CD47 or the indicated Flag‐tagged mutants and wild‐type or c‐Src CA for 48 h (right panel). H) CD47 knockdown U251 cells with reconstituted expression of WT Flag‐rCD47 or Flag‐rCD47 Y288F mutant were transfected with HA‐Ub and then stimulated with or without EGF (100 ng mL−1) for 60 min. MG132 (10 µm) was added to the cells 6 h before they were harvested with guanidine‐HCl‐containing buffer. Immunoprecipitation of Flag was performed with an anti‐Flag antibody. I) HEK293T/EGFR cells were co‐transfected with c‐Src WT or c‐Src CA, CD47‐Flag, and HA‐Ub. The cells were harvested with a guanidine‐HCl‐containing buffer. Immunoprecipitation was performed with an anti‐Flag antibody. J) U87/EGFRvIII cells were co‐transfected with control shRNA, c‐Src shRNA, or HA‐Ub. MG132 (10 µm) was added to the cells 6 h before they were harvested with guanidine‐HCl‐containing buffer. Immunoprecipitation was performed with an anti‐CD47 antibody. K) CD47‐depleted U87/EGFRvIII cells with reconstituted expression of WT Flag‐rCD47 or Flag‐rCD47 Y288F mutant were treated with CHX (100 µg mL−1) for the indicated periods of time. Quantification of relative Flag (rCD47) protein levels is shown (bottom panel).
Figure 5
Figure 5
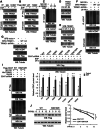
CD47 Y288 phosphorylation inhibits TRIM21‐mediated CD47 K99/102 polyubiquitylation and CD47 degradation. Immunoblotting analyses were performed with the indicated antibodies (A–J). A) U251 cells were treated with or without EGF (100 ng mL−1) for 1 h. Immunoprecipitation was performed with an anti‐CD47 antibody. B) HEK293T/EGFR cells were transiently transfected with Flag‐CD47 or Flag‐CD47 Y288F. The cells were treated with or without EGF (100 ng mL−1) for 1 h. Immunoprecipitation was performed with anti‐Flag beads. C) U251 cells stably expressing the indicated TRIM21 shRNAs or a control shRNA were transfected with HA‐Ub. MG132 (10 µm) was added to the cells 6 h before they were harvested with guanidine‐HCl‐containing buffer. Immunoprecipitation with an anti‐CD47 antibody was performed. D) U251 cells were stably expressed with the TRIM21 shRNAs or a control shRNA. TRIM21 shRNA#1 was used for the subsequent experiments. E) U251 cells were transiently transfected with the indicated amounts of SFB‐TRIM21 for 48 h and then the cells were collected for immunoblotting. F) U251 cells stably expressing TRIM21 shRNA or control shRNA with or without reconstituted expression of WT SFB‐rTRIM21 or SFB‐rTRIM21 ligase‐dead (LD) mutant were transfected with HA‐Ub. MG132 (10 µm) was added to the cells 6 h before they were harvested with guanidine‐HCl‐containing buffer. Immunoprecipitation was performed with an anti‐CD47 antibody. G) U251 cells stably expressing TRIM21 shRNA or control shRNA were reconstituted with WT SFB‐rTRIM21 or the SFB‐rTRIM21 LD mutant. H) CD47‐depleted U251 cells with reconstituted expression of WT Flag‐rCD47 or the indicated Flag‐tagged mutants were stimulated with or without EGF (100 ng mL−1) for 24 h. The results represent the means ± SD; ANOVA two‐way test. Different letters indicate significant differences (p < 0.05). I) CD47‐depleted U251 cells with reconstituted expression of WT Flag‐rCD47 or Flag‐rCD47 K99/102R mutant were co‐transfected with His‐tagged TRIM21 and HA‐Ub. MG132 (10 µm) was added to the cells 6 h before they were harvested with guanidine‐HCl‐containing buffer. Immunoprecipitation was performed with an anti‐Flag antibody. J) U251 cells were reconstituted with WT Flag‐CD47 or Flag‐CD47 K99/102R mutant and then treated with CHX (100 µg mL−1) for the indicated periods of time. Quantification of relative Flag (CD47) protein levels is shown (right panel).
Figure 6
Figure 6
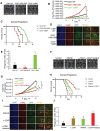
EGFR activation‐induced and c‐Src‐mediated CD47 phosphorylation and stabilization promote immune evasion of tumor cells and brain tumor growth. A) A total of 1 × 10⁵ mouse CT‐2A/Luc‐GFP cells with or without knockout of CD47 or knock‐in of CD47 Y286F or K99/102R mutant were intracranially injected into C57BL/6 mice. After 15 days, the mice were euthanized and examined for tumor growth. Representative tumor growth was shown in vivo by bioluminescence imaging using IVIS 100. B) A bioluminescence imaging analysis of tumor burden was performed on the indicated days. C) The mouse survival times were recorded and visualized using Kaplan–Meier survival curves. D) Immunofluorescent staining of the mouse GBM specimens was performed with the indicated antibodies. The macrophages that engulfed the cancer cells were indicated with arrows. Scale bar, 50 µm. E) Tumor macrophage phagocytosis was estimated by quantification of the phagocytic index (n = 4). The results represent the means ± SD; ANOVA two‐way test. Different letters indicate significant differences (p < 0.05). F) A total of 1 × 10⁵ CT‐2A/Luc‐GFP cells were intracranially injected into syngeneic C57BL/6 mice. After 15 days, the mice were euthanized and examined for tumor growth. Representative tumor growth was shown in vivo by bioluminescence imaging using IVIS 100. G) A bioluminescence imaging analysis of tumor burden was performed on the indicated days. H) The mouse survival times were recorded and visualized using Kaplan–Meier survival curves. I) Immunofluorescent staining of the mouse GBM specimens was performed with the indicated antibodies. The macrophages that engulfed the cancer cells were indicated with arrows. Scale bar, 50 µm. J) Tumor macrophage phagocytosis was estimated by quantification of the phagocytic index (n = 4). The results represent the means ± SD; ANOVA two‐way test. Different letters indicate significant differences (p < 0.05).
Figure 7
Figure 7
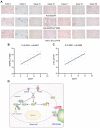
Activation of the EGFR/c‐Src pathway correlates with CD47 expression in human GBM specimens. A) IHC staining of 25 human GBM specimens was performed with the indicated antibodies. Representative images from the staining of seven different specimens are shown. Scale bar, 100 µm. B,C) The IHC stains were scored, and correlation analyses were performed. The Pearson correlation test was used. Note that the scores of some samples overlap. D) A schematic of c‐Src‐regulated CD47 phosphorylation and expression.

References

    1. Iwasaki A., Medzhitov R., Science 2010, 327, 291. - PMC - PubMed
    1. Feng M., Jiang W., Kim B. Y. S., Zhang C. C., Fu Y. X., Weissman I. L., Nat. Rev. Cancer 2019, 19, 568. - PMC - PubMed
    1. a) Brown E. J., Frazier W. A., Trends Cell Biol. 2001, 11, 130; - PubMed
    2. b) Barclay A. N., Van den Berg T. K., Annu. Rev. Immunol. 2014, 32, 25. - PubMed
    1. Chen J., Zheng D. X., Yu X. J., Sun H. W., Xu Y. T., Zhang Y. J., Xu J., Oncoimmunology 2019, 8, e1652540. - PMC - PubMed
    1. Gowda P., Patrick S., Singh A., Sheikh T., Sen E., Mol. Cell. Biol. 2018, 38, e00001. - PMC - PubMed

Publication types

LinkOut - more resources