. 2023 Oct:113:341-352.
doi: 10.1016/j.bbi.2023.07.027. Epub 2023 Aug 2.

Administration of recombinant FOXN1 protein attenuates Alzheimer's pathology in mice

Affiliations

Administration of recombinant FOXN1 protein attenuates Alzheimer's pathology in mice

Jin Zhao et al. Brain Behav Immun. 2023 Oct.

Abstract

Background: Alzheimer's disease (AD) is the most common cause of dementia in older adults and characterized by progressive loss of memory and cognitive functions that are associated with amyloid-beta (Aβ) plaques and neurofibrillary tangles. Immune cells play an important role in the clearance of Aβ deposits and neurofibrillary tangles. T cells are the major component of the immune system. The thymus is the primary organ for T cell generation. T cell development in the thymus depends on thymic epithelial cells (TECs). However, TECs undergo both qualitative and quantitative loss over time. We have previously reported that a recombinant (r) protein containing FOXN1 and a protein transduction domain can increase the number of TECs and subsequently increases the number of T cells in mice. In this study we determined the ability of rFOXN1 to affect cognitive performance and AD pathology in mice.

Methods: Aged 3xTg-AD and APP/PS1 AD mice were injected with rFOXN1 or control protein. Cognitive performance, AD pathology, the thymic microenvironment and immune cells were then analyzed.

Results: Administration of rFOXN1 into AD mice improves cognitive performance and reduces Aβ plaque load and phosphorylated tau in the brain. This is related to rejuvenating the aged thymic microenvironment, which results in enhanced T cell generation in the thymus, leading to increased number of T cells, especially IFNγ-producing T cells, in the spleen and the choroid plexus (CP), enhanced expression of immune cell trafficking molecules in the CP, and increased migration of monocyte-derived macrophages into the brain. Furthermore, the production of anti-Aβ antibodies in the serum and the brain, and the macrophage phagocytosis of Aβ are enhanced in rFOXN1-treated AD mice.

Conclusions: Our results suggest that rFOXN1 protein has the potential to provide a novel approach to treat AD patients.

Keywords: Alzheimer’s disease; Amyloid-beta; FOXN1; T cells; Thymic epithelial cells; Thymus.


Conflict of interest statement

Declaration of Competing Interest The authors declare that they have no known competing financial interests or personal relationships that could have appeared to influence the work reported in this paper.

Figures

Figure 1.
Figure 1.. rFOXN1 protein treatment improves cognitive performance in 3XTg-AD mice.
3XTg-AD mice (12-month-old) were injected i.t. with 40 μg rFOXN1 or control rMyoD protein at days 0, 15, and 30. Age-matched non-transgenic WT mice that were injected i.t. with 40 μg rFOXN1 or control rMyoD protein at days 0, 15, and 30 were also used as controls. Two months later, the mice were evaluated for cognitive performance by Barnes Maze and Object Recognition tests. (A) Timeline for the injection and behavioral tests. (B) The escape latency during the training period, and (C and D) the escape latency and the number of errors committed during the probe trial are shown. (E) NOR index was determined as the time spent interacting with the novel object divided by the total time of exploration during the testing phase. (F) Travel distance (m) was measured for locomotory activity analysis. (B) Overall groups comparisons (n=24/group for the escape latency during the training period) were carried out by using three-way ANOVA (treatment × genotype× training days) followed by post-hoc Tukey’s HSD test. (C-F) Overall groups comparisons (n=24/group for probe trail of Barnes Maze, NOR test, and locomotory activity) were carried out by using two-way ANOVA (treatment × genotype) followed by post-hoc Tukey’s HSD test. The data were from three independent experiments and expressed as mean ± SD or mean ± SEM for escape latency during the training period. *p < 0.05 versus control MyoD protein group.
Figure 2.
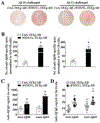
Figure 2.. rFOXN1 protein treatment attenuates AD pathology.
(A-C) 3XTg-AD mice (12-month-old) were injected i.t. with rFOXN1, or control protein as in Figure 1. Two and a half months later, the mice were evaluated for (A-D) brain pathology, and (E) soluble and insoluble Aβ levels. (A-D) The brains were immunostained for Aβ (in red), GFAP (in green) and DAPI nuclear staining. Mean Aβ area and plaque numbers, as well as GFAP area in the hippocampal DG and cortex were measured. (A) Representative immunofluorescent images, and (B-D) quantitative analysis of Aβ and GFAP. (E) Levels of soluble and insoluble Aβ1-40 and Aβ1-42 in the cerebral brain parenchyma of the mice were quantified by ELISA. (F) The levels of p-tau and total tau in the total protein lysates were analyzed. (left) Representative Western blot images, (right) quantification of Western blot data that was normalized to β-actin and control-group. (G-I) 14-month-old APP/PS1 mice were injected i.t. with rFOXN1, or control protein. Two months later, the mice were evaluated for brain pathology. (G) Representative immunofluorescent images, and (H) quantitative analysis of Aβ from the immunofluorescence. (I) Levels of soluble and insoluble Aβ1-40 and Aβ1-42 in the cerebral brain parenchyma of the mice were quantified by ELISA. Group comparison (n=18) was carried out by using two-tailed Student’s t-test. The data were from three independent experiments and expressed as mean ± SD. *p < 0.05 versus control MyoD protein group.
Figure 3.
Figure 3.. rFOXN1 rejuvenates the aged thymic architecture, increases the number of TECs and thymocytes in 3XTg-AD mice.
WT and 3XTg-AD mice (12-month-old) were injected i.t. with 40 μg rFOXN1 or control rMyoD protein as in Figure 1. Two and a half months later, the thymi were harvested. (A, B) Frozen thymic sections were prepared and subjected to (A) H&E staining (for both WT and AD mice) and (B) immunofluorescent staining with anti-K8 and K5 antibodies (for AD mice). (C-F) The thymi were analyzed by flow cytometry. (C, D) The percentages and numbers of total TECs (CD45EpCAM+ MHC II+), cTECs (CD45EpCAM+MHC II+Ly51+), and mTECs (CD45EpCAM+MHC II+Ly51) are shown. (C) Representative flow cytometric profiles showing the percentage of EpCAM+MHC II+ TECs in CD45 thymic stromal cells and Ly51+ cTEC and Ly51 mTECs in CD45EpCAM+MHC II+ TECs from the AD mice. (D) The numbers of total TECs, cTECs and mTECs. (E, F) The percentages and numbers of CD45+ total thymocytes and thymocyte subsets. (E) Representative flow cytometric profiles showing the percentage of CD4 and CD8 DN, DP, and SP thymocytes from the AD mice. (F) The numbers of CD4 and CD8 DP, CD4 SP and CD8 SP thymocytes. (D and F) Overall groups comparisons (n=18) were carried out by using two-way ANOVA (treatment × genotype) followed by post-hoc Tukey’s HSD test. The data were from three independent experiments and expressed as mean ± SD. *p < 0.05 versus control MyoD protein group. #p < 0.05, control MyoD protein-treated WT control group versus control MyoD protein-treated 3XTg-AD group.
Figure 4.
Figure 4.. rFOXN1 protein increases peripheral T cells and CP activity in 3XTg-AD mice.
3XTg-AD and WT mice were injected i.t. with rFOXN1, or control protein as in Figure 1. Two and half months later, the spleen and CP were harvested. (A-F) The splenocytes were analyzed for the percentages of (A-D) CD4 and CD8 T cells, and (E, F) IFN-γ-producing CD4 T cells by flow cytometry. (G-I) The CP was analyzed for (G, H) the percentage of IFN-γ-producing CD4 T cells by flow cytometry, (I) the mRNA expression levels of IFNγ, CCL2, CCL25, CXCL12, and ICAM1 by qRT-PCR., and (J) IFNγ protein expression level by immunofluorescence. The expression levels of the genes in control protein-treated mice were defined as 1. Overall groups comparisons (B, D, F, H and I, n=18) were carried out by using two-way ANOVA (treatment × genotype) followed by post-hoc Tukey’s HSD test. The data were from three independent experiments and expressed as mean ± SD. *p < 0.05 versus control MyoD protein group. #p < 0.05, control MyoD protein-treated WT control group versus control MyoD protein-treated 3XTg-AD group.
Figure 5.
Figure 5.. rFOXN1 protein treatment results in an increased number of anti-Aβ Ab-producing B cells in the spleen and increased levels of anti-Aβ Abs in the serum and the brain of 3XTg-AD mice.
3XTg-AD mice were injected i.t. with rFOXN1, or control protein as in Figure 1. Two and half months later, the spleen, serum, and brain were harvested. (A, B) The splenocytes were placed on culture plates coated with Aβ40 (4 μg/ml) or Aβ42 (4 μg/ml), Anti-Aβ Ab-producing B cells were measured by an ELISpot assay. (C, D) The levels of anti-Aβ40 and anti-Aβ42 Abs in (C) the serum and (D) the brain were measured by ELISA. Group comparison (n=18) was carried out by using two-tailed Student’s t-test. Data are shown as mean ± SD. *p < 0.05 versus control protein MyoD group.
Figure 6.
Figure 6.. rFOXN1 protein treatment increases the proportion and the function of macrophages in 3XTg-AD mice.
3XTg-AD and WT mice were injected with rFOXN1, or control protein as in Figure 1. Two and a half months later, the brain and the spleen were harvested. (A-D) The brain was analyzed for the (A, B) percentage of CD45hiCD11b+ cells, (A, C) the percentage of Ly6C+ in CD45hiCD11b+ cells, and (D) the expression of SRA1 by CD45hiCD11b+ cells. (E) Quantification of Aβ phagocytosis of CD45hiCD11b+ cells by flow cytometry 3 hours after intraperitoneal injection of methoxy-XO4. (F-I) The splenocytes were analyzed for (F, G) the percentage of F4/80+ macrophages, and (H, I) the macrophages were analyzed for the ab ility to phagocytose HiLyte Fluor 647-Aβ42. (J) F4/80+ Macrophages were isolated from untreated 3XTg-AD mice and cultured with CD4+ T cells from rFOXN1 protein- or control protein-treated 3XTg-AD mice in the absence or presence of neutralizing anti-IFNγ or isotype antibody. The macrophages were then analyzed for the ability to phagocytose HiLyte Fluor 647-Aβ42. Overall groups comparisons (B, G, I, n=18) were carried out by using two-way ANOVA (treatment × genotype) followed by post-hoc Tukey’s HSD test, J (n=18) was carried out by using one-way ANOVA, and group comparison (C, D, E, n=18) was carried out by using two-tailed Student’s t-test. The data were from three independent experiments and expressed as mean ± SD. *p < 0.05 versus control MyoD protein group. #p < 0.05, rFOXN1 protein treated 3XTg-AD mice in the absence of neutralizing anti-IFNγ versus isotype antibody.

Similar articles

Cited by

References

    1. 2022. 2022 Alzheimer's disease facts and figures. Alzheimer's & dementia : the journal of the Alzheimer's Association 18, 700–789. - PubMed
    1. Anderson G, Takahama Y, 2012. Thymic epithelial cells: working class heroes for T cell development and repertoire selection. Trends Immunol. 33, 256–263. - PubMed
    1. Arsenault D, Julien C, Tremblay C, Calon F, 2011. DHA improves cognition and prevents dysfunction of entorhinal cortex neurons in 3xTg-AD mice. PloS one 6, e17397. - PMC - PubMed
    1. Baruch K, Deczkowska A, Rosenzweig N, Tsitsou-Kampeli A, Sharif AM, Matcovitch-Natan O, Kertser A, David E, Amit I, Schwartz M, 2016. PD-1 immune checkpoint blockade reduces pathology and improves memory in mouse models of Alzheimer's disease. Nat. Med 22, 135–137. - PubMed
    1. Baruch K, Rosenzweig N, Kertser A, Deczkowska A, Sharif AM, Spinrad A, Tsitsou-Kampeli A, Sarel A, Cahalon L, Schwartz M, 2015. Breaking immune tolerance by targeting Foxp3(+) regulatory T cells mitigates Alzheimer's disease pathology. Nature communications 6, 7967. - PMC - PubMed

Publication types