. 2023 Oct;72(10):1971-1984.
doi: 10.1136/gutjnl-2022-328734. Epub 2023 Aug 4.

Enolase represents a metabolic checkpoint controlling the differential exhaustion programmes of hepatitis virus-specific CD8+ T cells

Affiliations

Enolase represents a metabolic checkpoint controlling the differential exhaustion programmes of hepatitis virus-specific CD8+ T cells

Frances Winkler et al. Gut. 2023 Oct.

Abstract

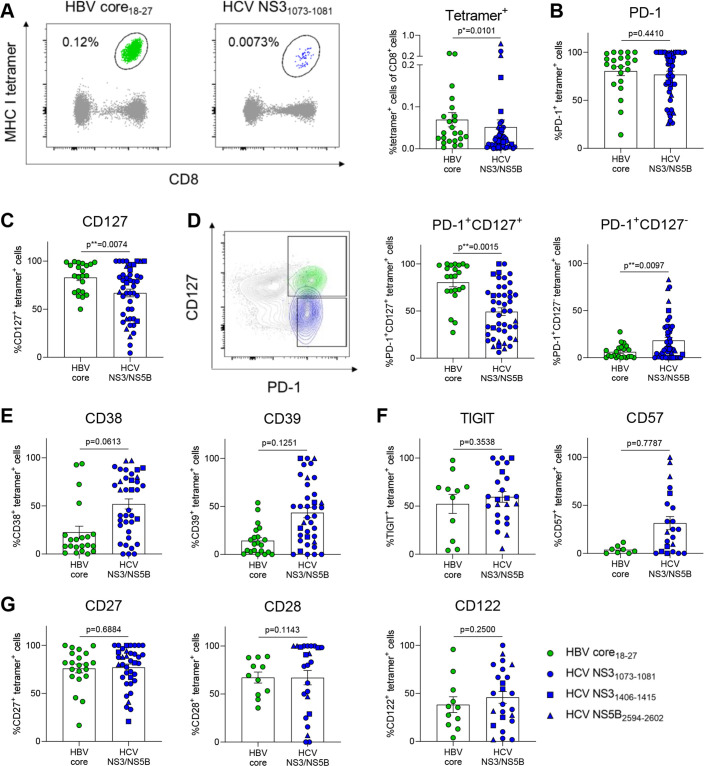
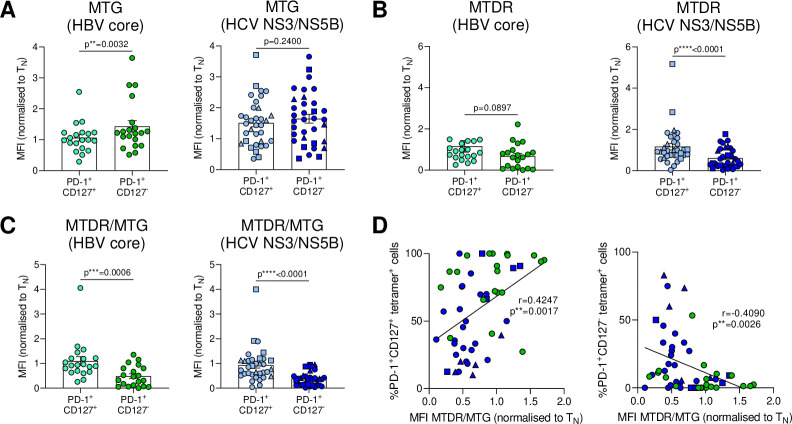
Objective: Exhausted T cells with limited effector function are enriched in chronic hepatitis B and C virus (HBV and HCV) infection. Metabolic regulation contributes to exhaustion, but it remains unclear how metabolism relates to different exhaustion states, is impacted by antiviral therapy, and if metabolic checkpoints regulate dysfunction.

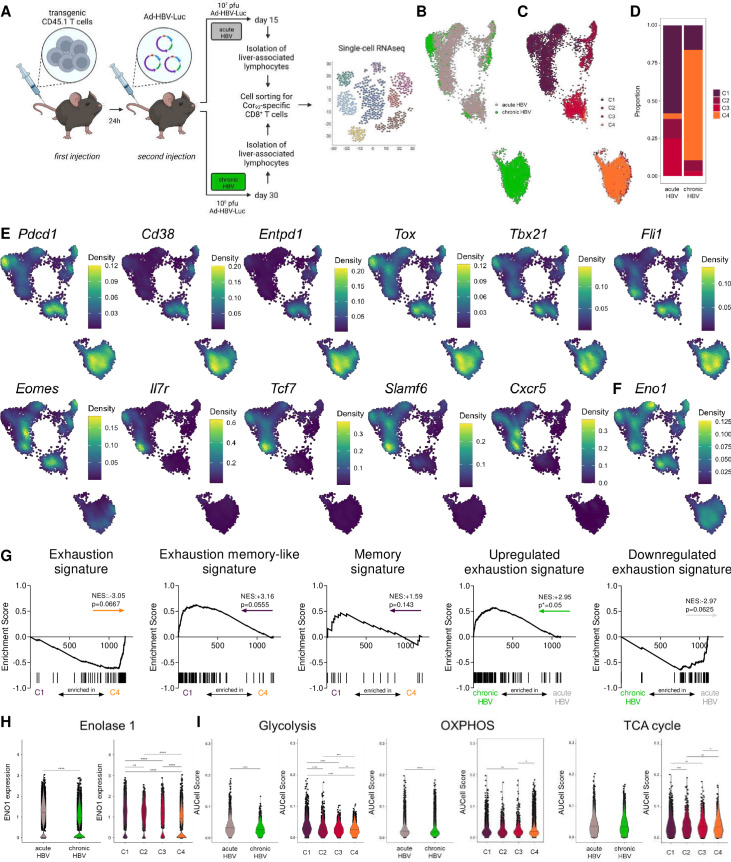
Design: Metabolic state, exhaustion and transcriptome of virus-specific CD8+ T cells from chronic HBV-infected (n=31) and HCV-infected patients (n=52) were determined ex vivo and during direct-acting antiviral (DAA) therapy. Metabolic flux and metabolic checkpoints were tested in vitro. Intrahepatic virus-specific CD8+ T cells were analysed by scRNA-Seq in a HBV-replicating murine in vivo model of acute and chronic infection.

Results: HBV-specific (core18-27, polymerase455-463) and HCV-specific (NS31073-1081, NS31406-1415, NS5B2594-2602) CD8+ T cell responses exhibit heterogeneous metabolic profiles connected to their exhaustion states. The metabolic state was connected to the exhaustion profile rather than the aetiology of infection. Mitochondrial impairment despite intact glucose uptake was prominent in severely exhausted T cells linked to elevated liver inflammation in chronic HCV infection and in HBV polymerase455-463 -specific CD8+ T cell responses. In contrast, relative metabolic fitness was observed in HBeAg-negative HBV infection in HBV core18-27-specific responses. DAA therapy partially improved mitochondrial programmes in severely exhausted HCV-specific T cells and enriched metabolically fit precursors. We identified enolase as a metabolic checkpoint in exhausted T cells. Metabolic bypassing improved glycolysis and T cell effector function. Similarly, enolase deficiency was observed in intrahepatic HBV-specific CD8+ T cells in a murine model of chronic infection.

Conclusion: Metabolism of HBV-specific and HCV-specific T cells is strongly connected to their exhaustion severity. Our results highlight enolase as metabolic regulator of severely exhausted T cells. They connect differential bioenergetic fitness with distinct exhaustion subtypes and varying liver disease, with implications for therapeutic strategies.

Keywords: alpha beta T cells; chronic viral hepatitis; hepatitis B; hepatitis C; immunology in hepatology.


Conflict of interest statement

Competing interests: None declared.

Figures

Figure 1
Figure 1
HCV-specific CD8+ T cells express markers associated with severe exhaustion. (A) Tetramer analysis of PBMCs from therapy-naïve cHBV and cHCV patients. Representative FACS plots of HBV core18-27- and HCV NS31073-1081-specific CD8+ T cells (left). Comparison of tetramer frequencies gated on CD8+ T cells (right). Virus-specific CD8+ T cells from cHBV and cHCV patients were stained for the depicted exhaustion-associated molecules. (B, C) Frequencies of PD-1+, CD127+, (D) PD-1+CD127+, PD-1+CD127-, (E) CD38+, CD39+, (F) TIGIT+, CD57+, (G) CD27+, CD28+ and CD122+ virus-specific CD8+ T cells are indicated. HBV core18-27 (green) and HCV NS31073-1081 epitopes (blue) are represented by circles. HCV NS31406-1415 and HCV NS5B2594-2602 epitopes are visualised by blue squares and triangles, respectively. Mann-Whitney test was performed in (A, B), (D, E) and (G, left). Unpaired t-test was performed in (C), (F, G, centre and right). P values are indicated (p*<0.05, p**<0.01). Error bars indicate mean±SEM. cHBV, chronic hepatitis B virus; cHCV, chronic hepatitis C virus; PBMCs, peripheral blood mononuclear cells.
Figure 2
Figure 2
HBV-specific and HCV-specific CD8+ T cells display different metabolic profiles. (A) Gene-set enrichment analyses (GSEA) of KEGG metabolic pathways were performed on microarray data of sorted therapy-naïve HBV-specific and HCV-specific CD8+ T cells. Significant (p≤0.05) pathways were indicated. (B) GSEA plots for KEGG OXPHOS, TCA cycle and Glycolysis gene sets. Coloured arrows indicate enrichment in HBV-specific or HCV-specific CD8+ T cells. Normalised enrichment scores (NES), false discovery rates (FDR) and p values are shown for GSEA analyses. (C) Naïve CD8+ T cells used as normalisation control for metabolic stainings were gated as CCR7+CD45RA+. (D) Virus-specific CD8+ T cells were analysed for metabolic features by staining for glucose uptake (2-NBDG), (E) mitochondrial membrane potential (TMRE), (F) mitochondrial mass (MTG), (G) mitochondrial mass and potential (MTDR), (H) polarisation (MTDR/MTG) and (I) mitochondrial ROS (MitoSox). Metabolic staining intensity was normalised to naïve CD8+ T cells from the same sample. Exemplary histograms of metabolic stainings are shown. HBV core18-27 (green) and HCV NS31073-1081 epitopes (blue) are represented by circles. HCV NS31406-1415 and HCV NS5B2594-2602 epitopes are visualised by blue squares and triangles, respectively. Kruskal-Wallis test was performed in (D–I). P values are indicated (p*<0.05, p**<0.01, p***<0.005, p****<0.001). Error bars indicate mean±SEM. HBV, hepatitis B virus; HCV, hepatitis C virus; ROS, reactive oxygen species.
Figure 3
Figure 3
Severely exhausted virus-specific CD8+ T cells marked by PD-1+CD127- phenotype show reduced mitochondrial polarisation. (A) PD-1+CD127+ and PD-1+CD127- subsets of HBV-specific and HCV-specific CD8+ T cells were analysed ex vivo for mitochondrial mass (MTG), (B) mitochondrial mass and membrane potential (MTDR) and (C) mitochondrial polarisation (MTDR/MTG). (D) Correlation analyses of PD-1+CD127+ or PD-1+CD127- virus-specific CD8+ T cells and their mitochondrial polarisation are shown. Metabolic staining intensity was normalised to naïve CD8+ T cells from the same sample. HBV core18-27 (green) and HCV NS31073-1081 epitopes (blue) are represented by circles. HCV NS31406-1415 and HCV NS5B2594-2602 epitopes are visualised by blue squares and triangles, respectively. Wilcoxon test was performed in (A, left) and (B, C). Paired t-test was performed in (A, right). Spearman r correlation analysis was performed in (D). P values are indicated (p**<0.01, p***<0.005, p****<0.001). Error bars indicate mean±SEM. HBV, hepatitis B virus; HCV, hepatitis C virus.
Figure 4
Figure 4
DAA therapy improves mitochondrial fitness of HCV-specific CD8+ T cells. cHCV patients were analysed before and during DAA therapy. (A) Tetramer analysis of HCV-specific CD8+ T cells at baseline (BL) and after 2 weeks of therapy (W2). (B) Serum transaminase levels at baseline and week 2. (C) Metabolic ex vivo staining of HCV-specific CD8+ T cells for mitochondrial mass (MTG), mitochondrial membrane potential (MTDR) and mitochondrial polarisation (MTDR/MTG) at BL and W2 time points. (D) Correlation analysis of ALT concentration and mitochondrial polarisation at BL and W2. (E) Frequency of PD-1+CD127+ HCV-specific CD8+ T cells at BL and W2. (F) Correlation of PD-1+CD127+ HCV-specific CD8+ T cells with mitochondrial function. Ex vivo FACS analysis of (G) MTG, (H) MTDR and (I) mitochondrial polarisation (MTDR/MTG) of PD-1+CD127+ or PD-1+CD127- HCV-specific CD8+ T cells during DAA therapy. (J) Fold change of mitochondrial polarisation between W2 and BL was compared between PD-1+CD127+ and PD-1+CD127- subsets. (K) Mitochondrial polarisation of PD-1+CD127+ and PD-1+CD127- subsets at BL and W2 was compared. Metabolic staining intensity was normalised to naïve CD8+ T cells from the same sample. HCV NS31073-1081 epitopes and HCV NS31406-1415 epitopes are represented by blue circles and squares, respectively. Wilcoxon test was performed in (A–C) and (G–K). Paired t-test was performed in (E). Spearman r correlation analyses were performed in (D, F). P values are indicated (p*<0.05, p***<0.005, p****<0.001). Error bars indicate mean±SEM. DAA, direct-acting antiviral; HCV, hepatitis C virus.
Figure 5
Figure 5
HBV core18-27- and polymerase455-463-specific CD8+ T cells exhibit distinct metabolic and exhaustion features and are differentially associated with viral load. (A) HBV-specific CD8+ T cells isolated from therapy-naïve cHBV patients were analysed ex vivo for mitochondrial mass (MTG), mitochondrial mass and membrane potential (MTDR), mitochondrial polarisation (MTDR/MTG), mitochondrial ROS (MitoSox) and (B) frequencies of PD-1+CD127+, PD-1+CD127-, (C) CD38+, CD39+, (D) TIGIT+, CD57+, CD27+ and CD28+ cells. (E) Correlation analyses of quantitative HBs antigen (qHBsAg) and mitochondrial polarisation and (F) frequencies of CD39+ tetramer+ cells are shown for HBV core18-27- and polymerase455-463-specific CD8+ T cells. Metabolic staining intensity was normalised to naïve CD8+ T cells from the same sample. HBV core18-27- and polymerase455-463-specific CD8+ T cells are visualised by light green and dark green circles, respectively. Kruskal-Wallis test was performed in (A). Mann-Whitney U test was performed in (B–D). Spearman r correlation analyses were perfomed in (E, F). P values are indicated (p*<0.05, p**<0.01, p***<0.005, p****<0.001). Error bars indicate mean±SEM. HBV, hepatitis B virus.
Figure 6
Figure 6
ENO1 lowly expressed in severely exhausted virus-specific CD8+ T cells is a metabolic checkpoint controlling glycolytic flux and T cell function. (A) Schematic overview of the glycolytic pathway. (B) Intracellular ENO1 staining of HBV-specific and HCV-specific CD8+ T cells. ENO1 MFIs are normalised to naïve CD8+ T cells of the respective donor. (C) Ex vivo analysis of PD-1+CD127+ and PD-1+CD127- subsets of HBV-specific and HCV-specific CD8+ T cells for ENO1 expression. (D) Correlation analyses of ENO1 expression and frequencies of CD38+ virus-specific CD8+ T cells. (E) Correlation analyses of ENO1 expression and mitochondrial polarisation (MTDR/MTG) of HBV-specific and HCV-specific CD8+ T cells. (F) Correlation analysis of ENO1 expression and serum ALT level of therapy-naïve cHBV and cHCV patients. (G–L) IFN-γ and TNF-ɑ production of PMA-stimulated and ionomycin-stimulated hepatitis virus-specific CD8+ T cells after o/n treatment with DMSO, AP-III-a4 hydrochloride (10 µM) and/or sodium pyruvate (2 mM). Cytokine secretion is shown normalised to DMSO-treated hepatitis virus-specific CD8+ T cells as control samples. HBV core18-27- and polymerase455-463-specific CD8+ T cells are visualised by light green and dark green circles, respectively. HCV NS31073-1081, HCV NS31406-1415 and HCV NS5B2594-2602 epitopes are represented by blue circles, squares and triangles, respectively. Kruskall-Wallis test was performed in (B). Paired t-test was performed in (C). Spearman r correlation analyses were performed in (D–F). Wilcoxon test was performed in (G), (I, K). Friedman test was performed in (H), (J) and (L, left). Two-way ANOVA was performed in (L, right). P values are indicated (p*<0.05, p**<0.01, p***<0.005, p****<0.001). Error bars indicate mean±SEM. ANOVA, analysis of variance; cHBV, chronic hepatitis B virus; HCV, hepatitis C virus.
Figure 7
Figure 7
Differential enolase 1 expression is linked to different metabolic programmes and exhaustion severities in acute versus chronic HBV infection. (A) Schematic illustration depicting experimental procedure. C57Bl/6 mice were intravenously injected with 10 000 transgenic CD45.1 T cells derived from Cor93 TCR-transgenic mice and after 24 hours infected with 107 (acute self-limiting) or 108 pfu (chronic) of adenoviral vector (Ad-HBV-Luc). Liver-associated lymphocytes were isolated after 15 (acute) or 30 days (chronic) and subsequently sorted for Cor93-specific CD8+ T cells. Single-cell RNA sequencing was performed on 3000 Cor93-specific cells per mouse. (B) UMAP projection showing Cor93-specific CD8+ T cells coloured by condition (C) and cluster identity. (D) Ratio of the number of cells in each cluster in acute and chronic samples. (E) Densities of gene expression levels are visualised by Nebulosa for selected genes and (F) Eno1. (G) GSEA plots comparing the differentially expressed genes (DEGs) for cluster 1 (C1) versus cluster 4 (C4) with the signatures reported in Utzschneider et al. (Exhaustion, Exhaustion memory-like and Memory signatures) and the DEGs of acute versus chronic conditions compared with the signatures published in Bengsch et al. (Upregulated and downregulated epigenomic exhaustion signatures). Coloured arrows indicate the cluster or condition in which the gene set is enriched. (H) Enolase 1 expression in acute versus chronic setting and cluster 1–4 across conditions. (I) Pathway scores of glycolysis, TCA cycle and oxidative phosphorylation of acute versus chronic setting and among clusters. Mann-Whitney test was performed in (H–I). P values are indicated (p*<0.05, p**<0.01, p***<0.005, p****<0.001). HBV, hepatitis C virus.

Comment in

References

    1. Boni C, Fisicaro P, Valdatta C, et al. . Characterization of hepatitis B virus (HBV)-specific T-cell dysfunction in chronic HBV infection. J Virol 2007;81:4215–25. 10.1128/JVI.02844-06 - DOI - PMC - PubMed
    1. Bengsch B, Seigel B, Ruhl M, et al. . Coexpression of PD-1, 2B4, CD160 and KLRG1 on exhausted HCV-specific CD8+ T cells is linked to antigen recognition and T cell differentiation. PLOS Pathog 2010;6:e1000947. 10.1371/journal.ppat.1000947 - DOI - PMC - PubMed
    1. Acerbi G, Montali I, Ferrigno GD, et al. . Functional reconstitution of HBV-specific CD8 T cells by in vitro polyphenol treatment in chronic hepatitis B. J Hepatol 2021;74:783–93. 10.1016/j.jhep.2020.10.034 - DOI - PubMed
    1. Maini MK, Boni C, Lee CK, et al. . The role of virus-specific CD8(+) cells in liver damage and viral control during persistent hepatitis B virus infection. J Exp Med 2000;191:1269–80. 10.1084/jem.191.8.1269 - DOI - PMC - PubMed
    1. Wolski D, Foote PK, Chen DY, et al. . Early transcriptional divergence marks virus-specific primary human CD8+ T cells in chronic versus acute infection. Immunity 2017;47:648–63. 10.1016/j.immuni.2017.09.006 - DOI - PMC - PubMed

Publication types

Substances