. 2023 Aug 4;14(8):502.
doi: 10.1038/s41419-023-06007-4.

Exosomal PGAM1 promotes prostate cancer angiogenesis and metastasis by interacting with ACTG1

Affiliations

Exosomal PGAM1 promotes prostate cancer angiogenesis and metastasis by interacting with ACTG1

Jun-Qi Luo et al. Cell Death Dis. .

Abstract

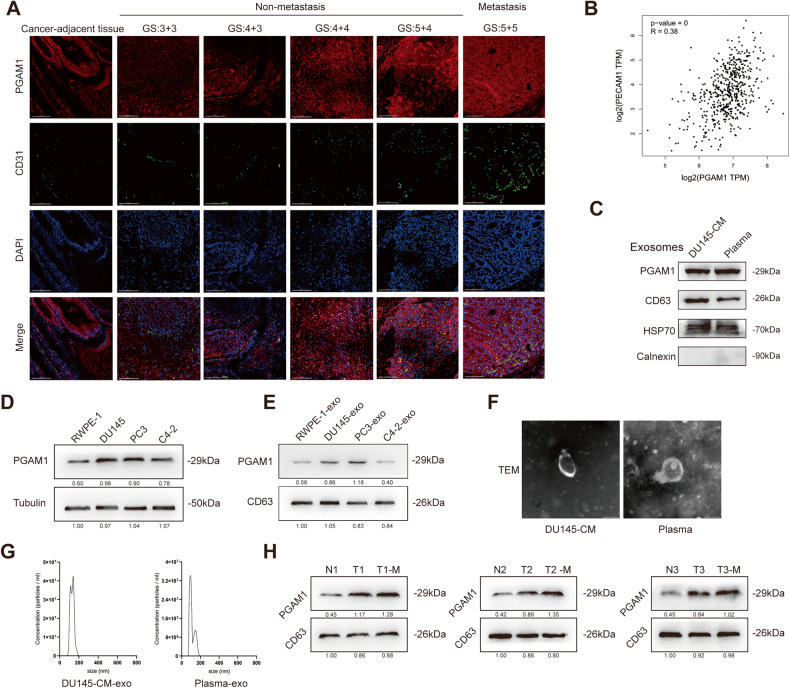
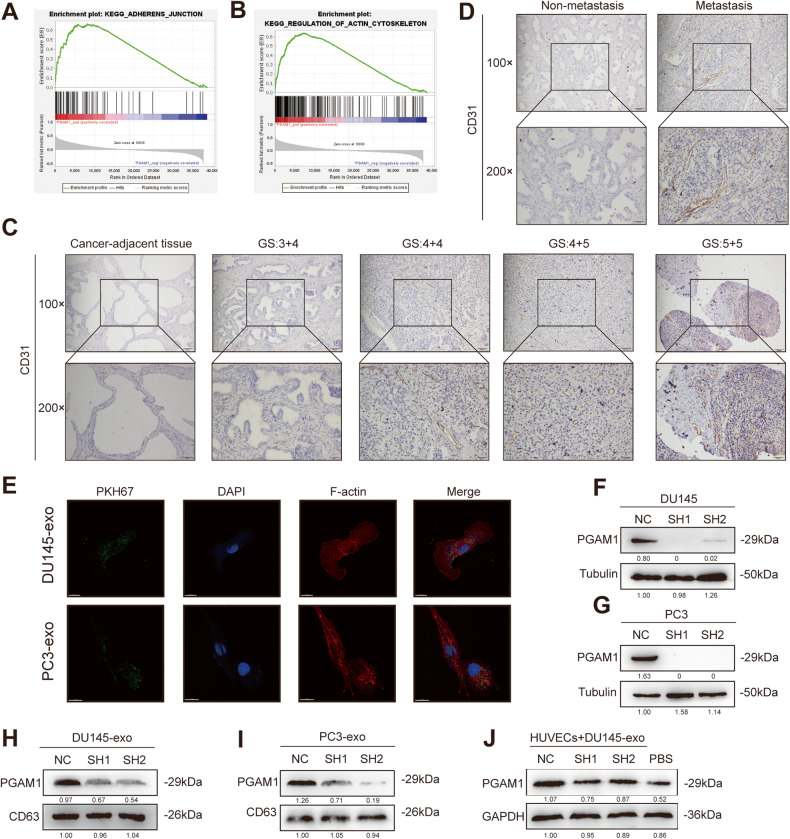
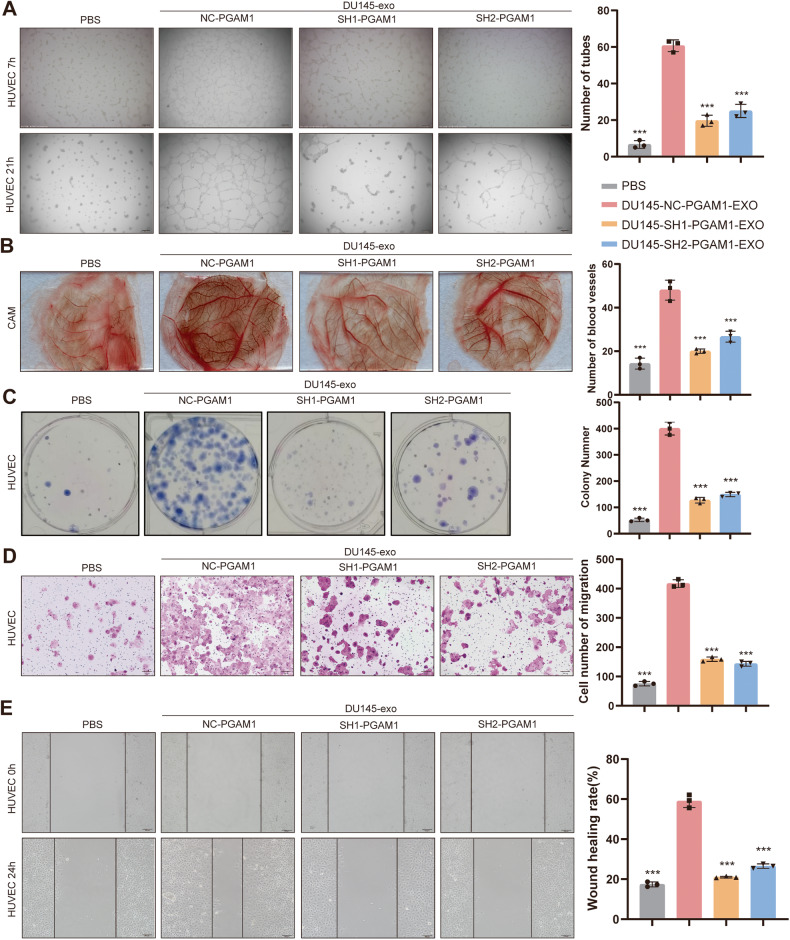
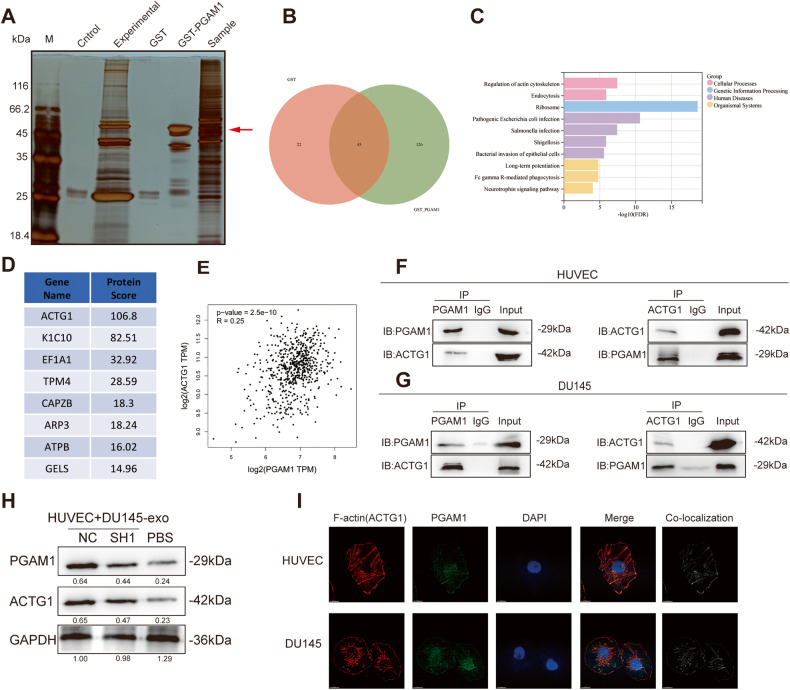
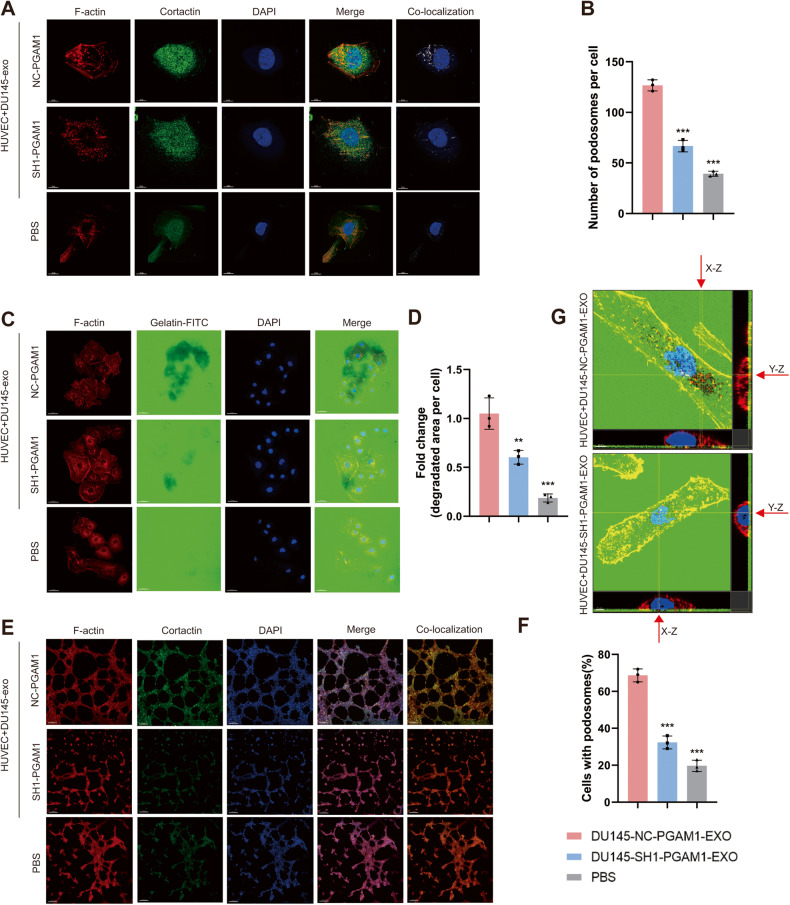
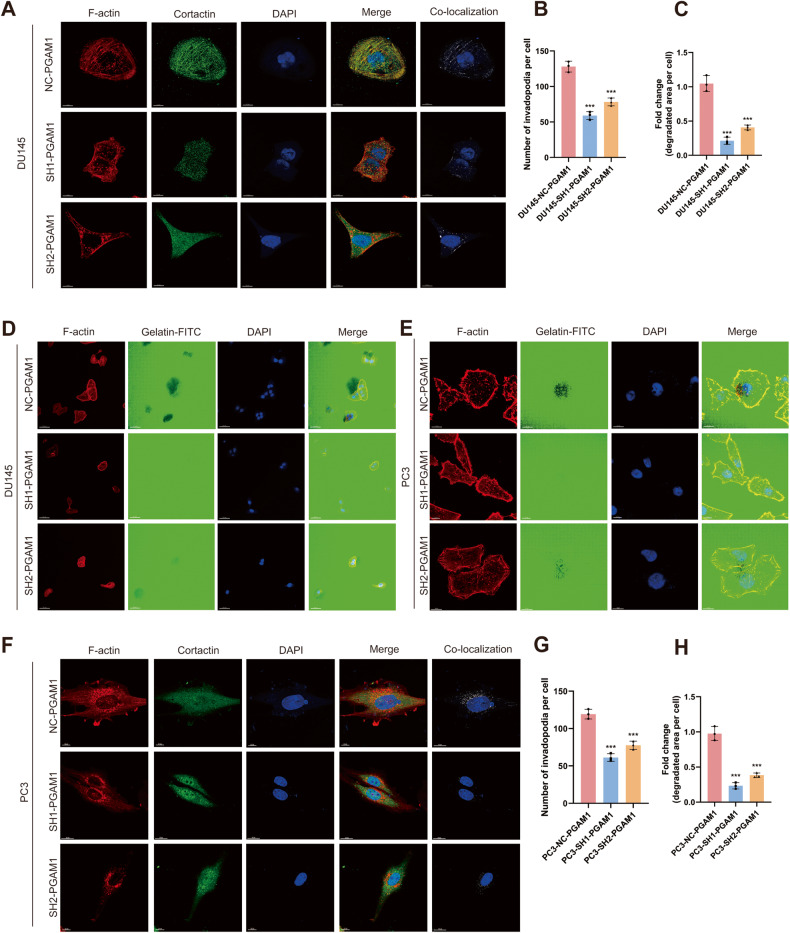
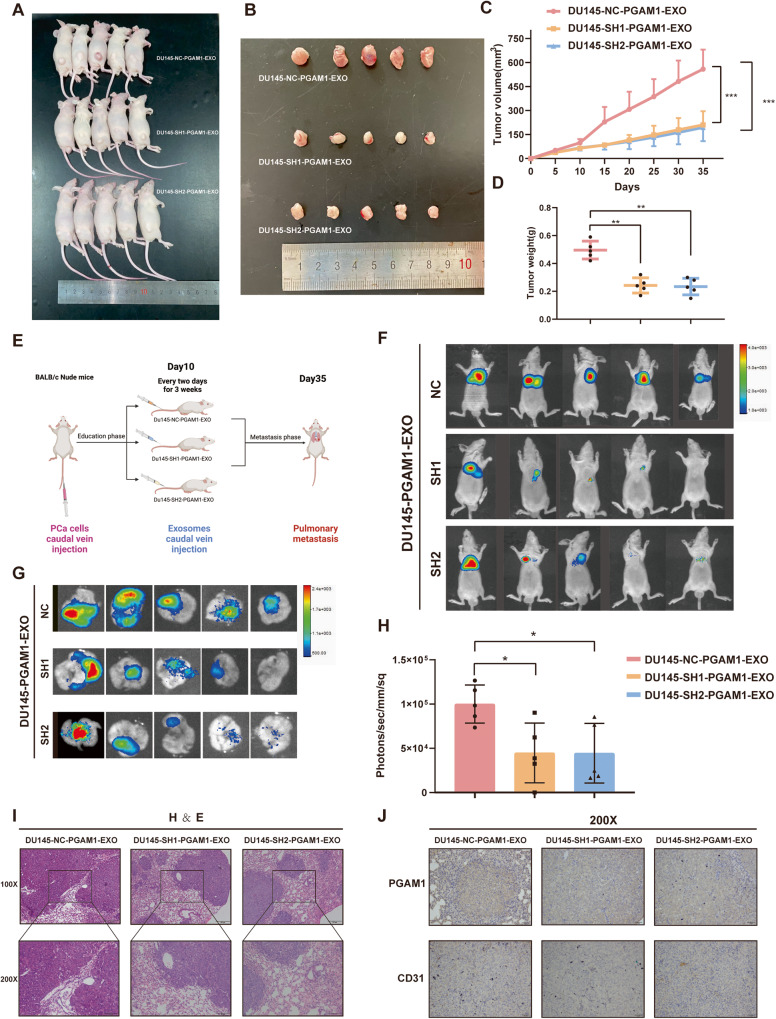
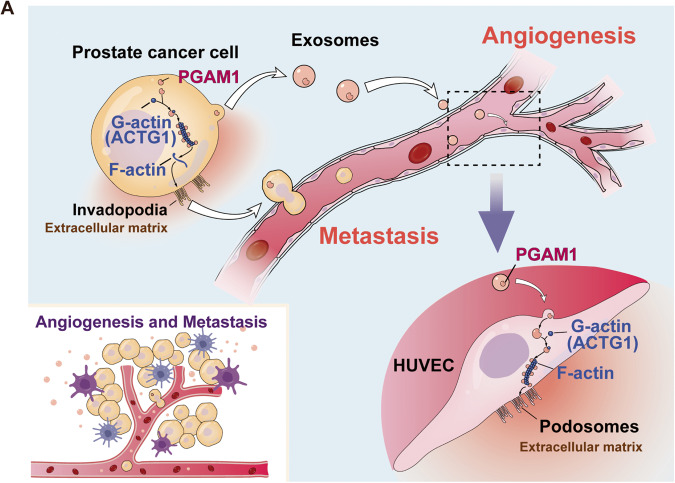
Tumor-derived exosomes and their contents promote cancer metastasis. Phosphoglycerate mutase 1 (PGAM1) is involved in various cancer-related processes. Nevertheless, the underlying mechanism of exosomal PGAM1 in prostate cancer (PCa) metastasis remains unclear. In this study, we performed in vitro and in vivo to determine the functions of exosomal PGAM1 in the angiogenesis of patients with metastatic PCa. We performed Glutathione-S-transferase pulldown, co-immunoprecipitation, western blotting and gelatin degradation assays to determine the pathway mediating the effect of exosomal PGAM1 in PCa. Our results revealed a significant increase in exosomal PGAM1 levels in the plasma of patients with metastatic PCa compared to patients with non-metastatic PCa. Furthermore, PGAM1 was a key factor initiating PCa cell metastasis by promoting invadopodia formation and could be conveyed by exosomes from PCa cells to human umbilical vein endothelial cells (HUVECs). In addition, exosomal PGAM1 could bind to γ-actin (ACTG1), which promotes podosome formation and neovascular sprouting in HUVECs. In vivo results revealed exosomal PGAM1 enhanced lung metastasis in nude mice injected with PCa cells via the tail vein. In summary, exosomal PGAM1 promotes angiogenesis and could be used as a liquid biopsy marker for PCa metastasis.


Conflict of interest statement

The authors declare no competing interests.

Figures

Fig. 1
Fig. 1. The exosome PGAM1 is involved in the metastasis of PCa.
A IF analysis of PCa tissues validated the expression of PGAM1 and CD31 in PCa tissues (GS indicates Gleason grade group). The scale bar represents 100 μm. B The expression correlation between PGAM1 and CD31 was inferred by bioinformatics (GEPIA 2 (cancer-pku.cn)). C Western blotting analysis of PGAM1, CD63, HSP70, Calnexin in exosomes from DU145-CM (cell medium) and PCa plasma. D, E Western blotting analysis of PGAM1 in RWPE-1, PCa cell lines (DU145, PC-3, C4-2) and their exosomes. F Transmission electron microscopy of exosomes derived from DU145-CM and PCa plasma. The scale bar represents 100 nm. G Nanoparticle tracer analysis exhibits the size and distribution of exosomes isolated from DU145-CM and PCa plasma. H Detection of PGAM1 in plasma exosomes of normal persons and PCa patients by western blot. (N represents normal persons, T represents PCa patients, T-M represents PCa patients with metastasis).
Fig. 2
Fig. 2. PCa exosome PGAM1 is taken up by HUVECs.
A, B GSEA analysis exhibited that high PGAM1 expression correlated with Cell Adhesion (NES = 2.23 > 1, FDR-q = 0) and Actin Cytoskeleton (NES = 2.32 > 1, FDR-q = 0) Signaling pathway Gene Signature. C Representative IHC images of CD31 staining in PCa patients and adjacent tissue to the cancer (GS indicates Gleason grade group). D Representative IHC images of CD31 staining in PCa patients with or without metastasis. The scale bar in 100× images represents 100 µm. The scale bar in 200× images represents 50 µm. E PKH67-labeled exosomes of PCa cell lines co-cultured with HUVECs (DAPI blue stained nuclei, PKH67 green stained exosomes, F-actin red stained Cytoskeletons). The scale bar represents 15 μm. F, G Transfection efficiency of two PCa lines (DU145, PC3) was measured by western blot. NC negative control, SH1 shPGAM1-1, SH2 shPGAM1-2. H, I Western blotting analysis of PGAM1 in exosomes from DU145-CM and PC3-CM. J Western blotting analysis of PGAM1 in HUVECs after co-culture with exosomes secreted by DU145-CM. Controls were treated with an equal volume of PBS.
Fig. 3
Fig. 3. PCa exosome PGAM1 promotes angiogenesis in HUVECs in vitro.
HUVECs were treated with exosomes isolated from the DU145-CM for 24 h prior to the following assays. Controls were treated with an equal volume of PBS. A, B An in vitro Matrigel tube formation assay and CAM assays was performed to assess the angiogenic capacity of HUVECs. And The number of branches per highpower field was analyzed. The scale bar represents 200 μm. C Colony-formation assays were performed to assess the proliferative capacity of HUVECs. D Transwell assay was performed to evaluate the invasive ability of HUVECs. The scale bar represents 200 μm. E Wound healing assays were performed to assess the migration ability of HUVECs. The scale bar represents 100 μm. (Error bars represent means ± SD; ***P < 0.001).
Fig. 4
Fig. 4. PGAM1 and ACTG1 bind in HUVECs.
A GST-pulldown enriched protein silver staining assay. B Venn diagram of GST and GST-PGAM1 differential proteins. C GSEA pathway enrichment map of GST-PGAM1 pull-down proteins. D Scoring ranking of GST-PGAM1 pull-down proteins. E The expression correlation between PGAM1 and ACTG1 was inferred by bioinformatics. (GEPIA 2 (cancer-pku.cn)). F, G Co-IP and western blotting assays demonstrated the binding of PGAM1 and ACTG1 in HUVECs and DU145 cells without any intervention. H Western blotting analysis of PGAM1 and ACTG1 in HUVECs after co-culture with exosomes secreted by DU145-CM Controls were treated with an equal volume of PBS. I IF was used to analyze the co-localization of PGAM1 (green), ACTG1 (red) and DAPI (blue) in HUVECs and DU145 cells. Co-localization indicates the co-localization analysis of PGAM1 and ACTG1 within HUVECs and PCa cells. The scale bar represents 15 μm.
Fig. 5
Fig. 5. The PCa exosome PGAM1 promotes the production of podosomes in HUVECs.
HUVECs were treated with exosomes isolated from the DU145-CM before to the following assays. Controls were treated with an equal volume of PBS. A Co-localization of F-actin (red), Cortactin (green) and DAPI (blue) was detected by IF in HUVECs to indicate podosomes. The scale bar represents 10 μm. B Quantification of podosomes in HUVECs. C HUVECs were plated on FITC-gelatin (green) and stained for F-actin (red) and DAPI (blue). The area of gelatin degradation is shown as a black area below the cells. The scale bar represents 50 μm. D Quantification of FITC-gelatin degradation in DU145 cells. E F-actin (red), Cortactin (green) and DAPI (blue) staining was used to perform in vitro Matrigel tube formation assays. The scale bar represents 150 μm. F Quantification of podosomes in HUVECs. G 3D z-stack acquisition was performed in the gelatin degradation experiment, and orthogonal views of the x-z plane and y-z plane are given. The red arrow indicates the area of gelatin degradation. The scale bar represents 5 μm. (Error bars represent means ± SD; **P < 0.01, ***P < 0.001).
Fig. 6
Fig. 6. Reduced invadopodia formation in PCa cells with knockdown of PGAM1.
A Co-localization of F-actin (red), Cortactin (green) and DAPI (blue) was detected by IF in DU145 cells to indicate invadopodia. The scale bar represents 10 μm. B Quantification of invadopodia in DU145 cells. C Quantification of FITC-gelatin degradation in DU145 cells. D DU145-NC-PGAM1 or DU145-SH1-PGAM1 cells were plated on FITC-gelatin (green) and stained for F-actin (red) and DAPI (blue). The scale bar represents 50 μm. E PC3-NC-PGAM1 or PC3-SH1-PGAM1 cells were plated on FITC-gelatin (green) and stained for F-actin (red), Cortactin and DAPI (blue). The scale bar represents 10 μm. F Co-localization of F-actin (red), Cortactin (green) and DAPI (blue) was detected by IF in PC3 cells to indicate Invadopodia. The scale bar represents 10 μm. G Quantification of invadopodia in PC3 cells. H Quantification of FITC-gelatin degradation in PC3 cells. (Error bars represent means ± SD; ***P < 0.001).
Fig. 7
Fig. 7. Exosome PGAM1 promotes PCa angiogenesis and metastasis in vivo.
A, B subcutaneous tumor specimen maps. C Tumor growth curves were plotted for nude mouse xenografts treated with different groups of exosomes (DU145-NC-PGAM1-EXO, DU145-SH1-PGAM1-EXO and DU145-SH2-PGAM1-EXO) given. D The dissected subcutaneous tumor xenografts were weighed and analyzed by One-way analysis of variance (ANOVA). E Schematic diagram of caudal vein injection in nude mice with different groups of exosomes. FH The luciferase activity (radiance values) of lung metastases at 6 weeks was measured by an in vivo imaging system. I Representative images of H&E staining of lung metastatic tumor sections from nude mice. J Representative images of PGAM1 and CD31 from IHC stained nude mice with metastatic lung tumors. The scale bar in 100× images represents 100 µm. The scale bar in 200× images represents 50 µm. (Error bars represent means ± SD; *P < 0.05, **P < 0.01, ***P < 0.001).
Fig. 8
Fig. 8. Schematic diagram of the potential mechanism.
A Schematic representation of the potential molecular mechanism of exosomal PGAM1-induced angiogenesis for PCa metastasis.

References

    1. Liu Y, Cao X. Characteristics and Significance of the Pre-metastatic Niche. Cancer Cell. 2016;30:668–81. doi: 10.1016/j.ccell.2016.09.011. - DOI - PubMed
    1. Rycaj K, Li H, Zhou J, Chen X, Tang DG. Cellular determinants and microenvironmental regulation of prostate cancer metastasis. Semin Cancer Biol. 2017;44:83–97. doi: 10.1016/j.semcancer.2017.03.009. - DOI - PMC - PubMed
    1. Seano G, Chiaverina G, Gagliardi PA, di Blasio L, Puliafito A, Bouvard C, et al. Endothelial podosome rosettes regulate vascular branching in tumour angiogenesis. Nat Cell Biol. 2014;16:931–41. doi: 10.1038/ncb3036. - DOI - PMC - PubMed
    1. Spuul P, Daubon T, Pitter B, Alonso F, Fremaux I, Kramer IJ, et al. VEGF-A/Notch-induced podosomes proteolyse basement membrane collagen-iv during retinal sprouting angiogenesis. Cell Rep. 2016;17:484–500. doi: 10.1016/j.celrep.2016.09.016. - DOI - PubMed
    1. Zhang K, Liu D, Zhao J, Shi S, He X, Da P, et al. Nuclear exosome HMGB3 secreted by nasopharyngeal carcinoma cells promotes tumour metastasis by inducing angiogenesis. Cell Death Dis. 2021;12:554. doi: 10.1038/s41419-021-03845-y. - DOI - PMC - PubMed

Publication types