. 2023 Aug 4;14(1):4677.
doi: 10.1038/s41467-023-39571-6.

Targeting of SLC25A22 boosts the immunotherapeutic response in KRAS-mutant colorectal cancer

Affiliations

Targeting of SLC25A22 boosts the immunotherapeutic response in KRAS-mutant colorectal cancer

Qiming Zhou et al. Nat Commun. .

Abstract

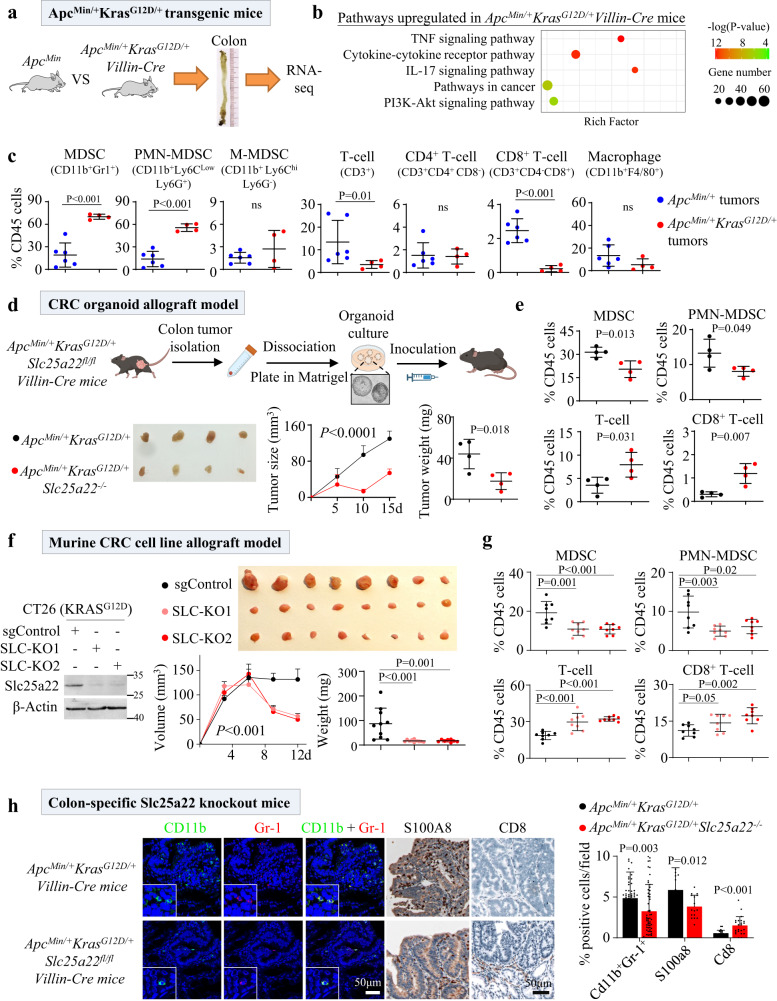
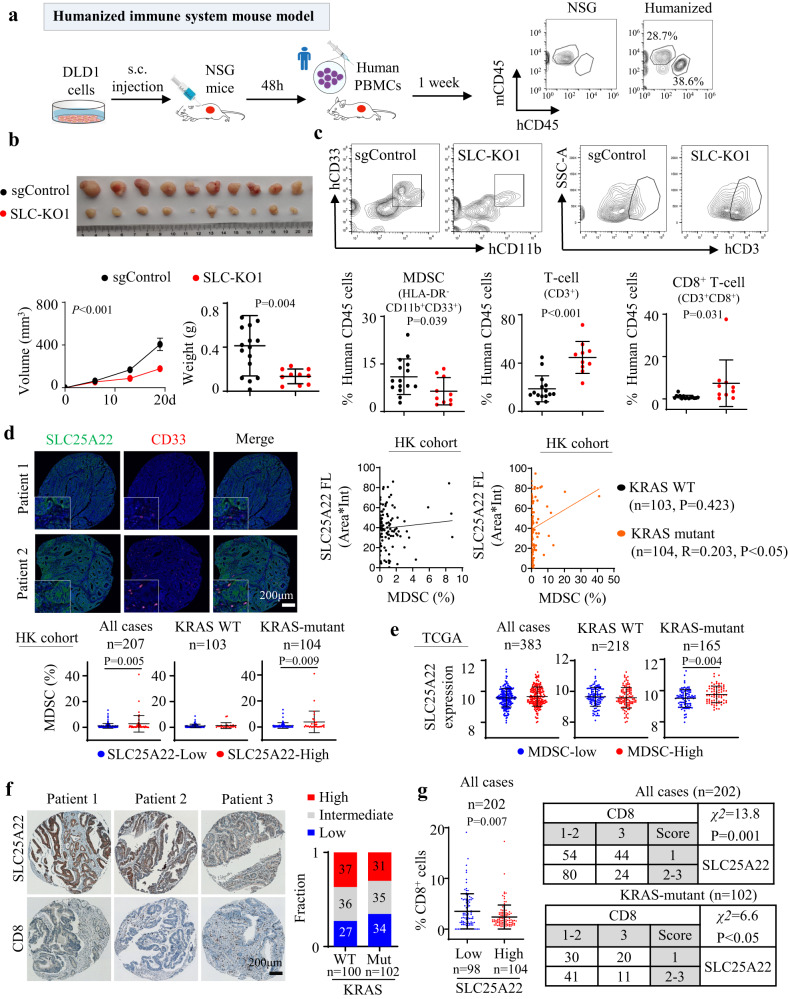
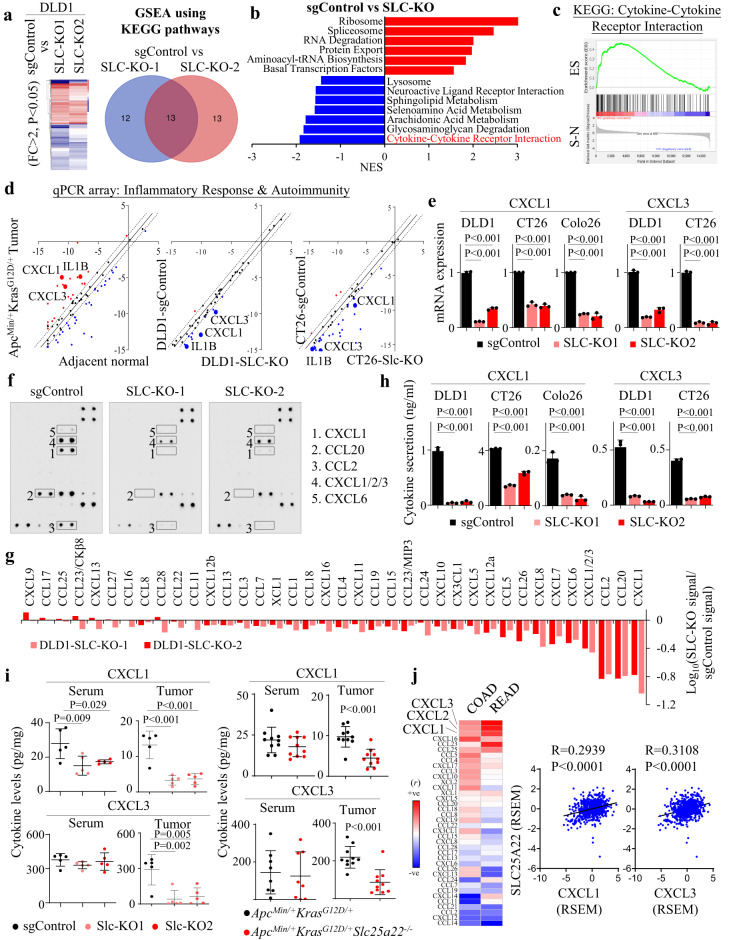
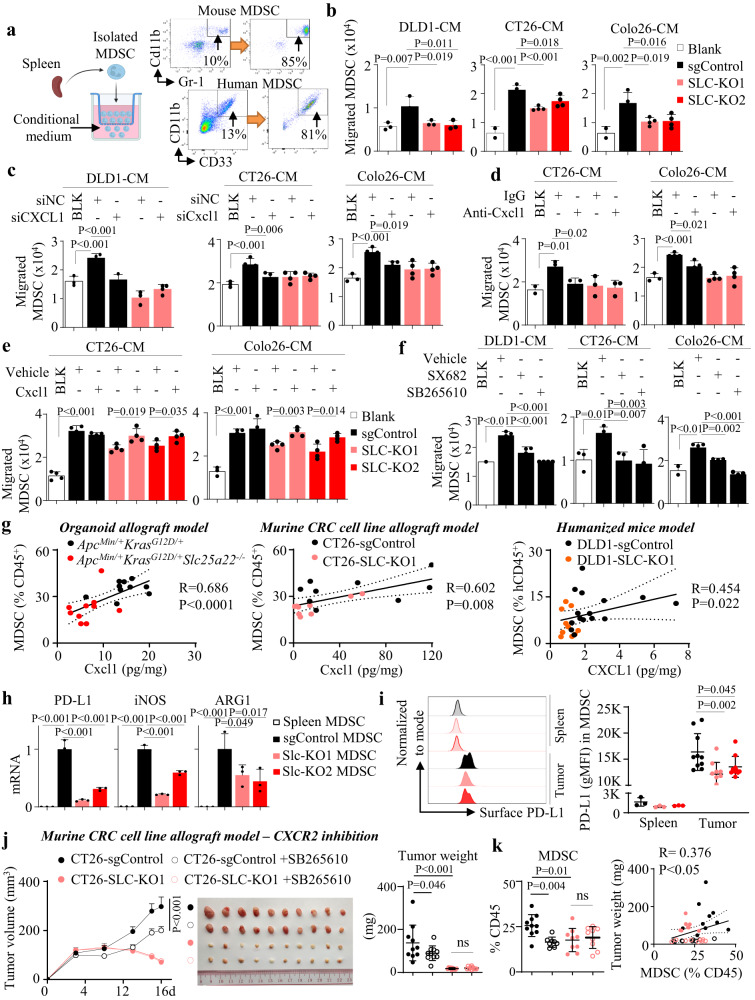
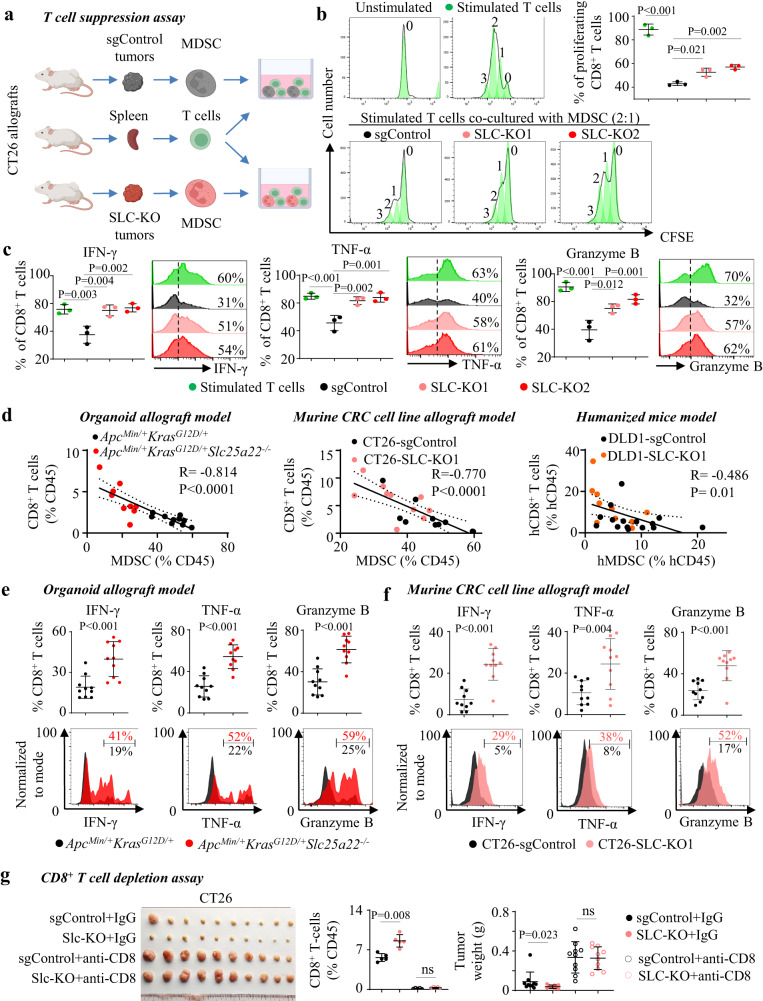
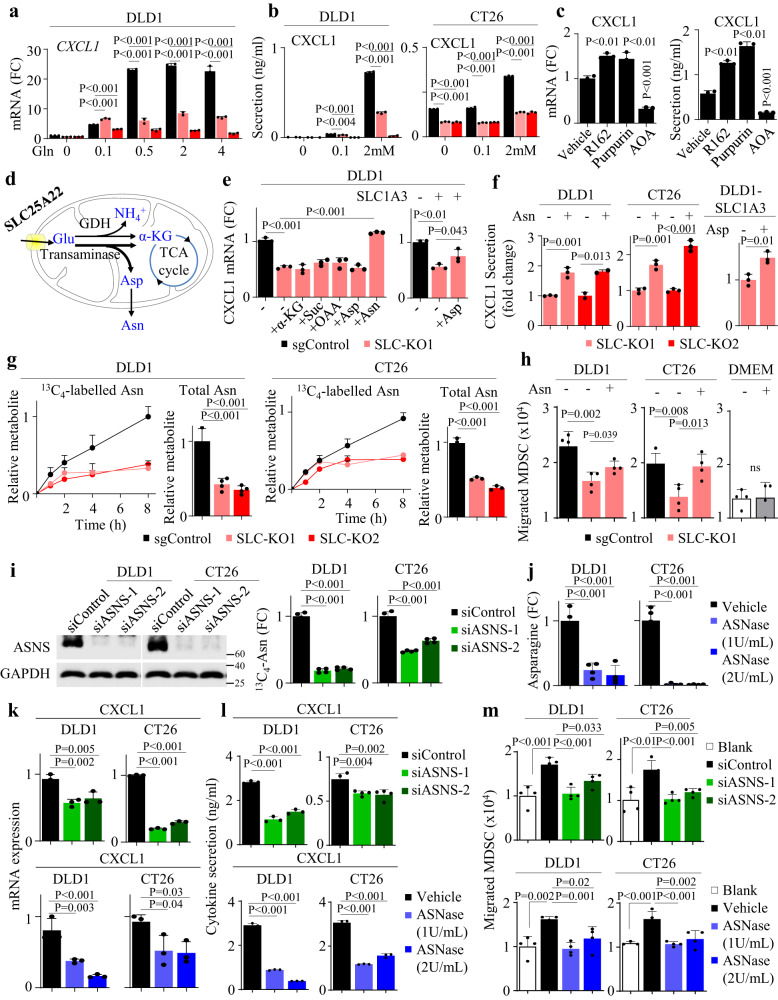
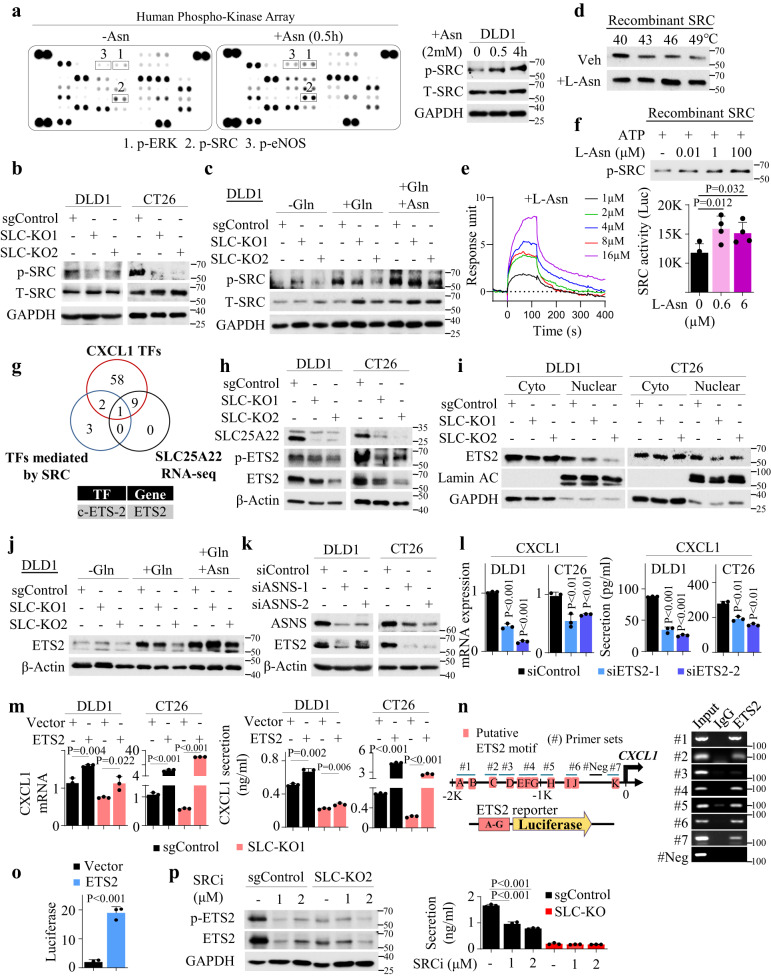
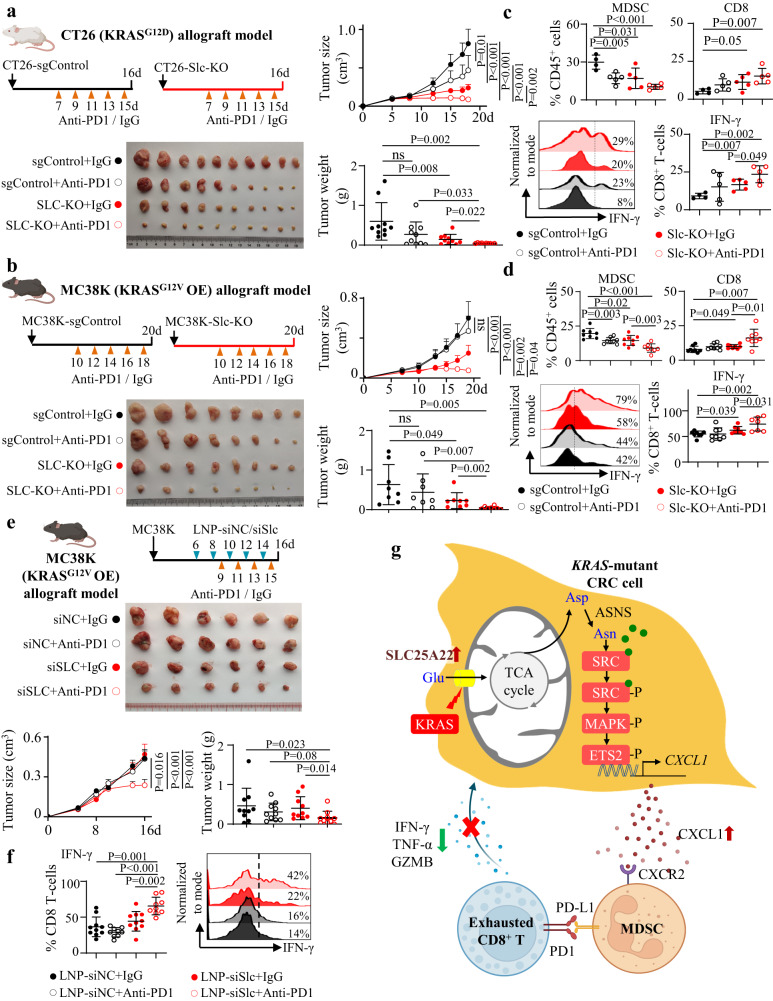
KRAS is an important tumor intrinsic factor driving immune suppression in colorectal cancer (CRC). In this study, we demonstrate that SLC25A22 underlies mutant KRAS-induced immune suppression in CRC. In immunocompetent male mice and humanized male mice models, SLC25A22 knockout inhibits KRAS-mutant CRC tumor growth with reduced myeloid derived suppressor cells (MDSC) but increased CD8+ T-cells, implying the reversion of mutant KRAS-driven immunosuppression. Mechanistically, we find that SLC25A22 plays a central role in promoting asparagine, which binds and activates SRC phosphorylation. Asparagine-mediated SRC promotes ERK/ETS2 signaling, which drives CXCL1 transcription. Secreted CXCL1 functions as a chemoattractant for MDSC via CXCR2, leading to an immunosuppressive microenvironment. Targeting SLC25A22 or asparagine impairs KRAS-induced MDSC infiltration in CRC. Finally, we demonstrate that the targeting of SLC25A22 in combination with anti-PD1 therapy synergizes to inhibit MDSC and activate CD8+ T cells to suppress KRAS-mutant CRC growth in vivo. We thus identify a metabolic pathway that drives immunosuppression in KRAS-mutant CRC.


Conflict of interest statement

The authors declare no competing interests.

Figures

Fig. 1
Fig. 1. SLC25A22 knockout affects immune cell infiltration in KRAS-mutant CRC.
a Breeding of ApcMin/+ and lsl-KrasG12D/+Villin-Cre to give ApcMin/+KrasG12D/+ Villin-Cre mice. At 7 weeks, colon tumors were harvested for RNA-seq. b Immune-related signaling are enriched in colon tumors (n = 2) from ApcMin/+KrasG12D/+Villin-Cre compared to ApcMin/+ mice (n = 2). Rich factor is defined as the ratio of differentially expressed gene number to total gene number in a particular pathway. P value, Fisher’s exact test. c Flow cytometry of immune cell populations in ApcMin/+KrasG12D/+Villin-Cre (n = 4) and ApcMin/+ mice (n = 6). MDSC, including PMN-MDSC, were increased in ApcMin/+KrasG12D/+Villin-Cre mice, together with decreased total T cells and CD8+ T cells in tumors. Each dot represents an independent mouse. d Colon tumor organoids derived from ApcMin/+KrasG12D/+ or ApcMin/+KrasG12D/+Slc25a22−/− mice with intestinal Slc25a22 knockout were implanted into C57BL/6 mice. Tumor growth was inhibited in Slc25a22 knockout organoids (n = 4). Each dot represents an independent mouse. e Slc25a22 knockout inhibited MDSC and PMN-MDSC, but induced total and CD8+ T cells (n = 4). Each dot represents an independent mouse. f SLC25A22 knockout (Slc-KO) in KRAS-mutant CT26 cells inhibited tumor growth in BALB/c mice (sgControl and SLC-KO1: n = 10 per group; SLC-KO2: n = 8). Each dot represents an independent tumor. g SLC25A22 knockout inhibited MDSC and PMN-MDSC, but increased total T cells and CD8+ T cells (n = 8). h Immunofluorescence and immunohistochemistry of immune cells in the tumors from ApcMin/+KrasG12D/+ and ApcMin/+KrasG12D/+Slc25a22−/− mice (n = 6), confirming reduced MDSC but increased CD8+ T cells by SLC25A22 knockout. Each dot represented the value from an independent capture field. Data are shown as mean ± SD (ch) and ± SEM for the growth curves (d, f). Two-tailed Student’s t test (ce, h). Two-tailed one-way ANOVA (f, g). Two-tailed two-way ANOVA for growth curve (d, f). ns, no significance. Source data are provided as a Source Data file.
Fig. 2
Fig. 2. SLC25A22 correlates with immune suppression in PBMC humanized mice and human KRAS-mutant CRC patients.
a The construction and validation of PBMC humanized mice model. b SLC25A22 knockout significantly inhibited the growth of DLD1 xenografts in PBMC humanized mice (sgControl: n = 15; SLC-KO1: n = 10). Each dot represents an independent tumor. c SLC25A22 knockout inhibited tumor infiltration of human MDSC (HLA-DR-CD11b+CD33+) while increasing T-cell (hCD3+CD4+/ hCD3+CD8+) infiltration (sgControl: n = 15; SLC-KO1: n = 10). Each dot represents an independent tumor. d Co-immunofluorescence of SLC25A22 and CD33 in a tissue microarray CRC cohort (n = 207). Positive correlation was revealed in only KRAS-mutant CRC (upper). Increased MDSC infiltration was found in SLC25A22-high CRC with mutant KRAS (lower). Each dot represents an independent patient. e In TCGA cohort (n = 383), SLC25A22 mRNA expression is significantly higher in MDSC-high tumors compared to MDSC-low tumors in KRAS-mutant CRC. Each dot represents an independent patient. f Immunohistochemistry of CD8 and SLC25A22 in CRC tissue microarray (n = 202). CD8+ T cells were reduced in KRAS-mutant CRC compared to wildtype CRC patients. g High SLC25A22 expression correlated with reduced CD8+ T-cell in KRAS-mutant CRC (All cases: n = 202; KRAS-mutant: n = 102). Each dot represents an independent patient. Data are shown as mean ± SD (b, c, d, e, g) and ± SEM for growth curve b. Two-tailed Student’s t test (b, c, d, e, g). Two-tailed two-way ANOVA for growth curves (b). Chi-Square test (g) and Pearson correlation test (d). Source data are provided as a Source Data file.
Fig. 3
Fig. 3. SLC25A22 knockout abrogates secretion of CXCL1 and CXCL3 in vitro and in vivo.
a RNA-seq of SLC25A22 knockout DLD1 cells and gene set enrichment analysis (GSEA) for the identification of common differentially regulated pathways in SLC-KO1 and SLC-KO2 cells (n = 4). b, c GSEA enrichment scores for differentially regulated gene sets unveiled the cytokine-cytokine receptor interaction signaling pathway as the top pathway depleted in SLC25A22 knockout cells. d Inflammatory Response and Autoimmunity PCR array showed that CXCL1, CXCL3 and IL1B were induced in ApcMin/+KrasG12D/+Villin-Cre mice tumors, but were down-regulated by SLC25A22 knockout (FC > 2). e qPCR validated that SLC25A22 knockout inhibited CXCL1/3 mRNA in DLD1, CT26 and Colo26 cells (n = 3). Each dot represents an independent sample. f Antibody array showed SLC25A22 knockout down-regulated cytokine secretion in DLD1 cells. g Densitometry showed CXCL1 and CXCL1/2/3 were top-down-regulated cytokines. h ELISA confirmed SLC25A22 knockout impaired CXCL1/3 secretion in DLD1 (72 h), CT26 (24 h) and Colo26 (24 h) (n = 3). Each dot represents an independent sample. i Detection of CXCL1/3 in serum and tumors of mice implanted with CT26 allografts (left, n = 5) and ApcMin/+KrasG12D/+ organoid allografts (right, n = 10) with or without SLC25A22. Each dot represents an independent mouse. j SLC25A22 mRNA correlates with CXCL1/2/3 mRNA in TCGA CRC (COADREAD) cohort (n = 677). Each dot represents an independent patient. Data are shown as mean ± SD (e, h, i). Two-tailed one-way ANOVA (e, h, i). Two-tailed Student’s t test analysis for two-group comparison i. Pearson correlation test j. Source data are provided as a Source Data file.
Fig. 4
Fig. 4. SLC25A22 knockout abrogates recruitment and activation of MDSC in KRAS-mutant CRC via a CXCL1-CXCR2 axis.
a Flow cytometry validation of isolated mouse MDSC (CD11b+ Gr-1+) and human MDSC (CD11b+CD33+) from the spleens of tumor-implanted syngeneic mice and PBMC humanized mice, respectively. b Conditioned medium from sgControl cells induced MDSC migration, which was impaired by SLC25A22 knockout (n = 4). Each dot represents an independent sample. c siCXCL1, but not siCXCL3, abrogated induction of MDSC migration in sgControl cell conditioned medium (n = 4). Each dot represents an independent sample. d Anti-Cxcl1 neutralizing antibody (0.25 µg/mL) suppressed MDSC migration in sgControl cell conditioned medium; but had no effect on SLC25A22 knockout cells (CT26: n = 3; Colo26: n = 4). Each dot represents an independent sample. e Recombinant Cxcl1 (1 ng/ml) rescued MDSC migration in CT26-Slc-KO and Colo26-Slc-KO conditioned medium (n = 4). Each dot represents an independent sample. f CXCR2 inhibitors SX682 (2 μM) or SB265610 (10 μM) abolished MDSC migration in sgControl cell conditioned medium (n = 4). Each dot represents an independent sample. g Tumoral CXCL1 positively correlated with MDSC infiltration in ApcMin/+KrasG12D/+ organoids (n = 10) in C57BL/6 mice, CT26 allografts (n = 9) in BALB/c mice, and DLD1 xenografts (sgControl, n = 15; SLC-KO1, n = 10) in PBMC humanized mice. Each dot represents an independent mouse. h qPCR of isolated MDSC from CT26 allografts showed that activation markers PD-L1, iNOS, and ARG1 were enhanced in intratumoral MDSC compared to that of splenic MDSC, and was abrogated in SLC25A22 knockout tumors (n = 3). Each dot represents an independent mouse. i Flow cytometry of MDSC from CT26 allografts mice showed that surface PD-L1 protein on MDSC were induced in tumors compared with spleen, which was impaired in SLC25A22 knockout tumors (spleen: n = 3; tumors: n = 10). Each dot represents an independent sample. j SB265610 suppressed the growth of CT26-sgControl allografts (n = 10) and k downregulated MDSC (n = 9), but had no effect on CT26-Slc-KO allografts in BALB/c mice. MDSC positively correlated with tumor weight (n = 36). Each dot represents an independent tumor. Data are shown as mean ± SD. Two-tailed one-way ANOVA (bd, f, hk). Two-tailed Student’s t test analysis for two-group comparison e. Spearman correlation test (g, k). Source data are provided as a Source Data file.
Fig. 5
Fig. 5. SLC25A22-mediated MDSC recruitment represses T-cell proliferation and activation.
a Workflow of T-cell suppression assay. b T-cell suppression assay showed that MDSC isolated from CT26-Slc-KO allografts have attenuated ability to suppress T-cell proliferation (n = 3) and c expression of cytotoxic markers IFN-γ, TNF-α, and Granzyme B (n = 3). Each dot represents an independent sample. d Tumoral MDSC negatively correlated with CD8+ T cells in ApcMin/+KrasG12D/+ allografts (n = 10), CT26 allografts (n = 10), and DLD1 xenografts (sgControl, n = 15; SLC-KO, n = 10). Each dot represents an independent tumor. e In ApcMin/+KrasG12D/+ organoid allografts (n = 10) and f CT26 allografts (n = 10), SLC25A22 knockout increased the tumor-infiltrating CD8+ T cells expressing activation marker (IFN-γ, TNF-α, and Granzyme B). Each dot represents an independent tumor. g CD8+ T cells depletion with anti-CD8 antibody abrogated growth inhibition by SLC25A22 knockout in CT26 allograft (n = 10). Each dot represents an independent mouse (left) or tumor (right). Data are shown as mean ± SD (b, c, eg). Two-tailed one-way ANOVA (b, c). Two-tailed Student’s t test for two-group comparison (e, f). Two-tailed Mann–Whitney U test g. Two-tailed Pearson correlation test d. ns, no significance. Source data are provided as a Source Data file.
Fig. 6
Fig. 6. SLC25A22 drives glutamine-dependent CXCL1 via asparagine.
a In glutamine-depleted (12 h) DLD1 cells, addition of glutamine (72 h) dose-dependently induced CXCL1 mRNA. SLC25A22 knockout selectively inhibited CXCL1 mRNA at high glutamine levels (n = 3). Each dot represents an independent sample. b After glutamine depletion (12 h), glutamine (72 h) dose-dependently induced CXCL1 secretion in DLD1 cells and was impaired by SLC25A22 knockout (n = 3) (left). In glutamine-depleted (12 h) CT26 cells, glutamine (24 h) dose-dependently induced Cxcl1 secretion. SLC25A22 knockout inhibited Cxcl1 secretion at high glutamine (n = 3) (right). Each dot represents an independent sample. c Transaminase inhibition by aminooxyacetate (AOA, 100 μM) inhibited CXCL1 mRNA; whereas blockade of glutamate dehydrogenase 1 (GDH1) by Purpurin (25 μM) and R162 (25 μM) had an opposite effect (n = 3). A similar effect was observed for CXCL1 secretion (n = 3). Each dot represents an independent sample. d Schematic diagram showing the metabolic outputs of glutamine via SLC25A22. e Supplementation of downstream metabolites (2 mM, 24 h) (α-KG, dimethyl α-ketoglutarate; Succ, dimethyl succinate; OAA, dimethyl oxaloacetate; Asp, aspartate; Asn, asparagine) showed that asparagine restored CXCL1 mRNA in SLC25A22 knockout DLD1 cells (n = 3). Aspartate restored CXCL1 mRNA expression in DLD1-SLC-KO cells overexpressing SLC1A3 (n = 3). Each dot represents an independent sample. f Asparagine (2 mM, 24 h) restored CXCL1 secretion in both DLD1 and CT26 cells with knockout of SLC25A22 (n = 3). Aspartate restored CXCL1 secretion in DLD1-SLC-KO cells overexpressing SLC1A3 (n = 3). Each dot represents an independent sample. g After depleting glutamine (12 h), [13C5]-Glutamine stable isotope labeling and LC-MS was performed in DLD1 and CT26 cells with or without SLC25A22 knockout. Total and 13C-labeled asparagine were reduced by SLC25A22 knockout (n = 3). Each dot represents an independent sample. h Treatment with asparagine (2 mM, 24 h) restored the capacity of DLD1-SLC-KO and CT26-Slc-KO cell conditioned medium to promote MDSC migration, without direct effects on MDSC migration (n = 4). i Validation of ASNS knockdown by western blot (left). LC-MS of DLD1 and CT26 cells co-transfected with siASNS and SLC1A3, followed by incubation with 13C4-aspartate (2 mM, 96 h) confirmed the ASNS blockade (n = 4). Each dot represents an independent sample. j LC-MS showed that Asparaginase (ASNase) (24 h) depleted cellular asparagine in DLD1 and CT16 cells (n = 4). Each dot represents an independent sample. k siASNS (upper) or ASNase (lower) reduced CXCL1 mRNA and l secretion in DLD1 and CT26 cells (n = 3). Each dot represents an independent sample. m Conditioned medium from siASNS (upper) or ASNase-treated (lower) DLD1 and CT26 cells had reduced ability to induce MDSC migration. (n = 4). Each dot represents an independent sample. Data are shown as mean ± SD (ac, em) and ± SEM for metabolite curves g. Two-tailed one-way ANOVA (ac, e, gm). Two-tailed Student’s t test f. ns, no significance. Source data are provided as a Source Data file.
Fig. 7
Fig. 7. SLC25A22-asparagine axis is sensed by SRC to activate the ETS2/CXCL1 signaling in KRAS-mutant CRC.
a Phospho-Kinase Array (n = 1 experiment) revealed that asparagine addition (2 mM, 0.5 h, 4 h) in glutamine-low (0.1 M, 12 h) medium activated p-SRC and validation by Western blot (n = 3 independent biological replicates). b SLC25A22 knockout suppressed p-SRC in DLD1 and CT26 cells (n = 2). c Glutamine (1 mM, 12 h) promoted p-SRC in an SLC25A22-dependent manner. Asparagine (2 mM, 12 h) restored p-SRC in SLC25A22 knockout cells (n = 3 independent biological replicates). d Asparagine increased thermal stability (5 min incubation) of recombinant SRC (n = 3 independent biological replicates). e BIAcore analysis of the binding of asparagine to recombinant SRC (n = 2). f Asparagine-induced recombinant SRC phosphorylation and kinase activity (n = 4). Each dot represents an independent sample. g Overlapping of in silico prediction of CXCL1 transcription factors (TFs), SRC-downstream TFs, and SLC25A22 knockout RNA-seq data revealed ETS2 as a putative transcription factor for CXCL1. h SLC25A22 knockout suppressed ETS2 and p-ETS2 expression, and i ETS2 nuclear localization in DLD1 and CT26 cells (n = 2). j Glutamine (1 mM, 12 h) increased ETS2 protein in a SLC25A22-dependent manner. Asparagine (2 mM, 12 h) rescued ETS2 in SLC25A22 knockout cells (n = 2). k ASNS knockdown suppressed ETS2 expression (n = 2). l ETS2 knockdown reduced CXCL1 mRNA and secretion (n = 3). Each dot represents an independent sample. m ETS2 overexpression rescued CXCL1 mRNA and secretion in SLC25A22 knockout cells (n = 3). Each dot represents an independent sample. n In silico identification of ETS2 binding sites on CXCL1 promoter and validation by ChIP-PCR. o Luciferase reporter assay confirmed that ETS2 activated transcription of CXCL1 promoter (n = 3). p SRC inhibitor Bosutinib (24 h) suppressed ETS2, p-ETS2 expression, and CXCL1 secretion in DLD1-sgControl cells, without any effect in SLC25A22 knockout cells (n = 3). Each dot represents an independent sample. Data are shown as mean ± SD (f, l, m, o, p). Two-tailed one-way ANOVA (f, l, p). Two-tailed Student’s t test (m, o). Source data are provided as a Source Data file.
Fig. 8
Fig. 8. SLC25A22 depletion synergized with anti-PD1 therapy in KRAS-mutant CRC.
a SLC25A22 knockout synergized with anti-PD1 in suppressing the growth of CT26 allografts (n = 10) and b MC38-KrasG12V allografts (n = 8). Each dot represents an independent tumor. c CD8+ T-cell and IFN-γ expression was induced by combined SLC25A22 knockout and anti-PD1, whilst MDSC infiltration was reduced by the combination of SLC25A22 knockout plus anti-PD1 therapy in CT26 allografts (n = 5) and d MC38-KrasG12V allografts (n = 8). Each dot represents an independent tumor. e siSlc25a22-encapsulated nanoparticles (VNP-siSLC25A22) synergized with anti-PD1 to suppress MC38-KrasG12V allografts growth and increased CD8+ T-cell activation (n = 10) and f their effect on IFN-γ levels on CD8+ T cells (siNC+IgG and siSLC+IgG: n = 10 per group; siNC+Anti-PD1 and siSLC+ Anti-PD1: n = 9 per group). Each dot represents an independent tumor. g The overall graphical summary of the study (Created with BioRender.com). Data are presented as mean ± SEM for growth curve (a, b, e) and ± SD for others (af). Two-tailed two-way ANOVA for growth curve comparison (a, b, e). Two-tailed Student’s t test for two-group comparison (a, c). Two-tailed Mann–Whitney U test for two-group comparison (b, df). ns, no significance. Source data are provided as a Source Data file.

References

    1. Le DT, et al. Mismatch repair deficiency predicts response of solid tumors to PD-1 blockade. Science. 2017;357:409–413. doi: 10.1126/science.aan6733. - DOI - PMC - PubMed
    1. Overman MJ, et al. Nivolumab in patients with metastatic DNA mismatch repair-deficient or microsatellite instability-high colorectal cancer (CheckMate 142): an open-label, multicentre, phase 2 study. Lancet Oncol. 2017;18:1182–1191. doi: 10.1016/S1470-2045(17)30422-9. - DOI - PMC - PubMed
    1. Guinney J, et al. The consensus molecular subtypes of colorectal cancer. Nat. Med. 2015;21:1350–1356. doi: 10.1038/nm.3967. - DOI - PMC - PubMed
    1. Lal N, et al. KRAS mutation and consensus molecular subtypes 2 and 3 are independently associated with reduced immune infiltration and reactivity in colorectal cancer. Clin. Cancer Res. 2018;24:224–233. doi: 10.1158/1078-0432.CCR-17-1090. - DOI - PMC - PubMed
    1. Liao W, et al. KRAS-IRF2 axis drives immune suppression and immune therapy resistance in colorectal cancer. Cancer Cell. 2019;35:559–572 e557. doi: 10.1016/j.ccell.2019.02.008. - DOI - PMC - PubMed

Publication types

Substances