. 2023 Aug 4;21(1):287.
doi: 10.1186/s12916-023-02989-2.

Decreased TMIGD1 aggravates colitis and intestinal barrier dysfunction via the BANF1-NF-κB pathway in Crohn's disease

Affiliations

Decreased TMIGD1 aggravates colitis and intestinal barrier dysfunction via the BANF1-NF-κB pathway in Crohn's disease

Longyuan Zhou et al. BMC Med. .

Abstract

Background: Disrupted intestinal epithelial barrier is one of the major causes of Crohn's disease (CD). Novel molecular targets for intestinal epithelial barrier are essential to treatment of CD. Transmembrane and immunoglobulin domain-containing protein 1 (TMIGD1) is an adhesion molecule that regulates cell adhesion, migration, and enterocyte differentiation. However, the function and mechanism of TMIGD1 in CD and intestinal epithelial barrier has rarely been studied. Furthermore, the association between TMIGD1 and the clinical features of CD remains unclear.

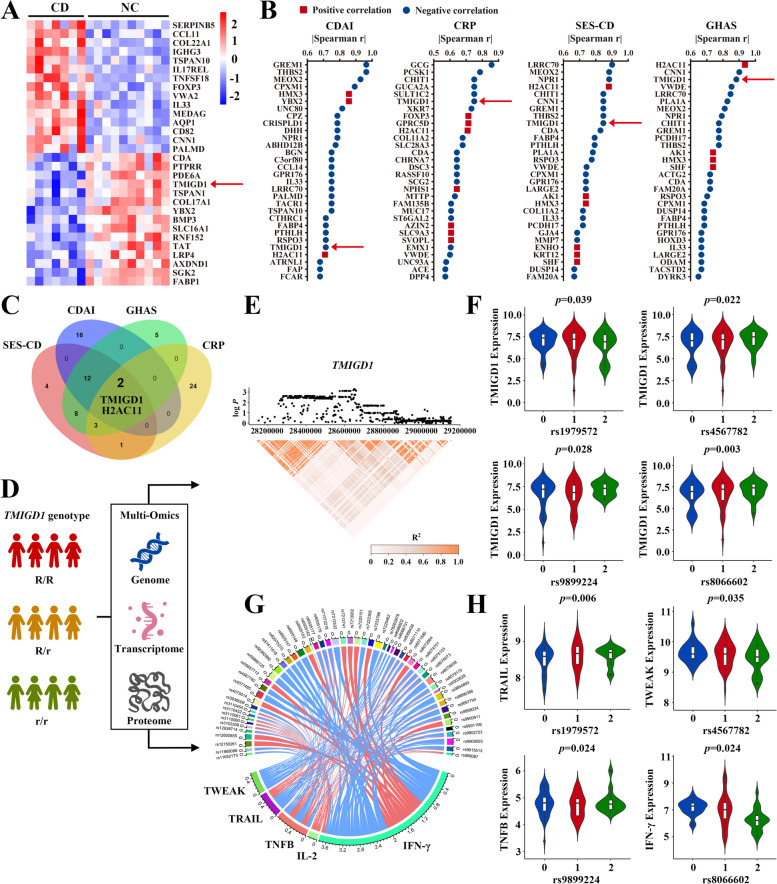
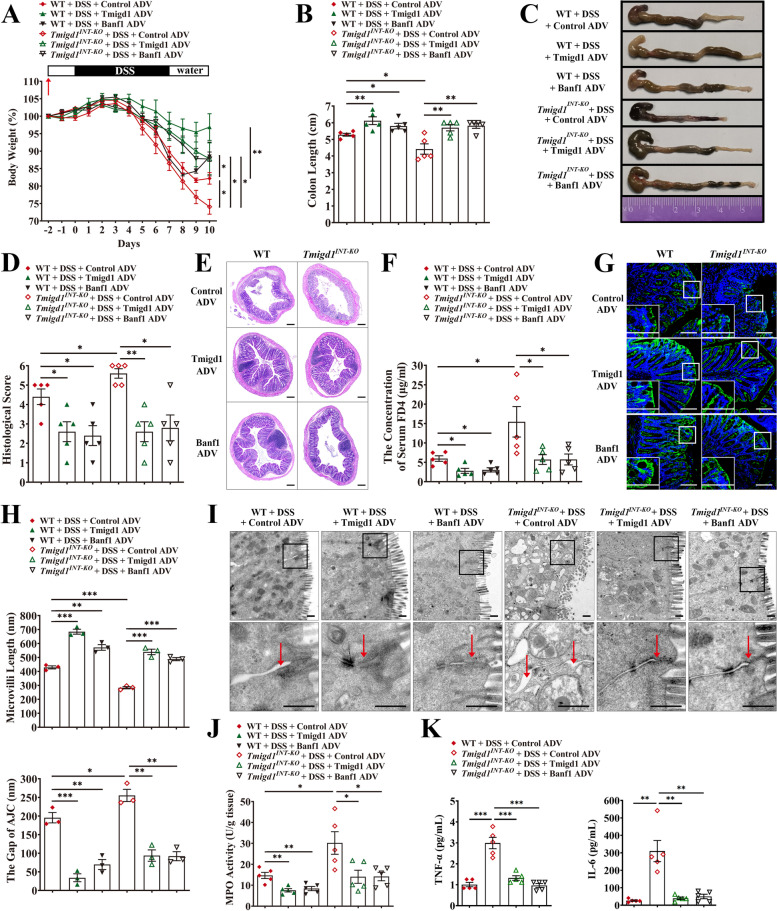
Methods: Transcriptome analysis on colonic mucosa from CD patients and healthy individuals were performed to identify dysregulated genes. Multi-omics integration of the 1000IBD cohort including genomics, transcriptomics of intestinal biopsies, and serum proteomics identified the association between genes and characteristics of CD. Inflammation was assessed by cytokine production in cell lines, organoids and intestinal-specific Tmigd1 knockout (Tmigd1INT-KO) mice. Epithelial barrier integrity was evaluated by trans-epithelium electrical resistance (TEER), paracellular permeability, and apical junction complex (AJC) expression. Co-immunoprecipitation, GST pull-down assays, mass spectrometry, proteomics, and transcriptome analysis were used to explore downstream mechanisms.

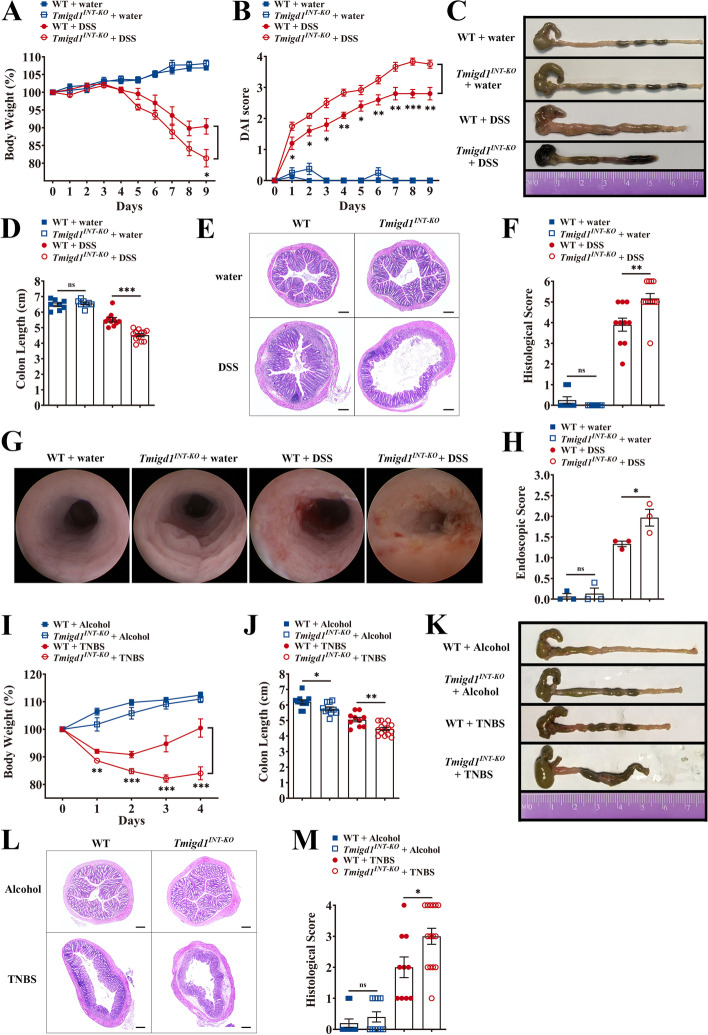
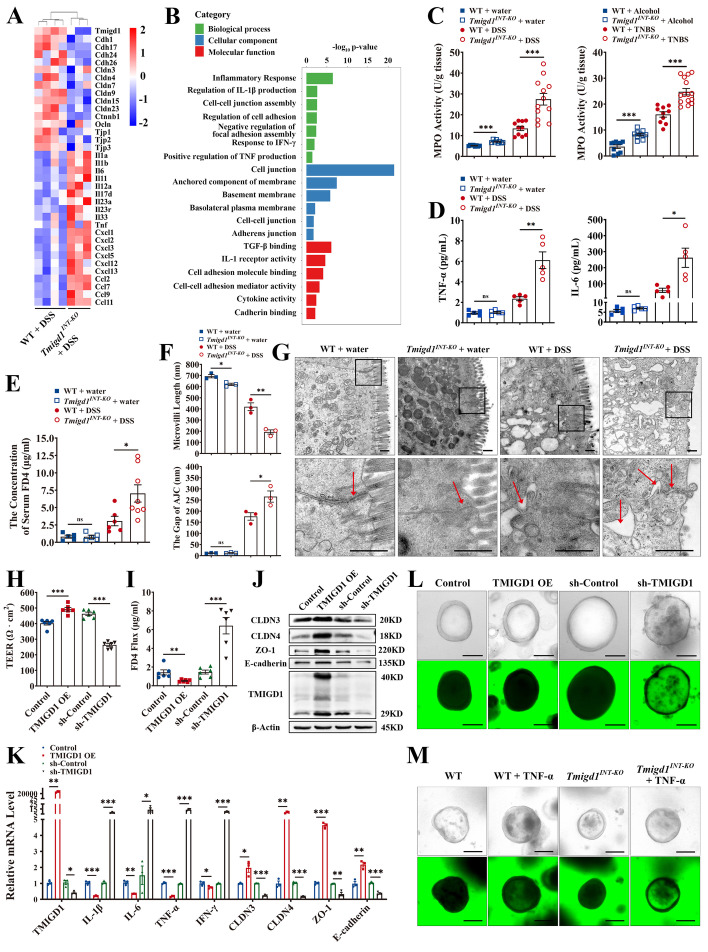
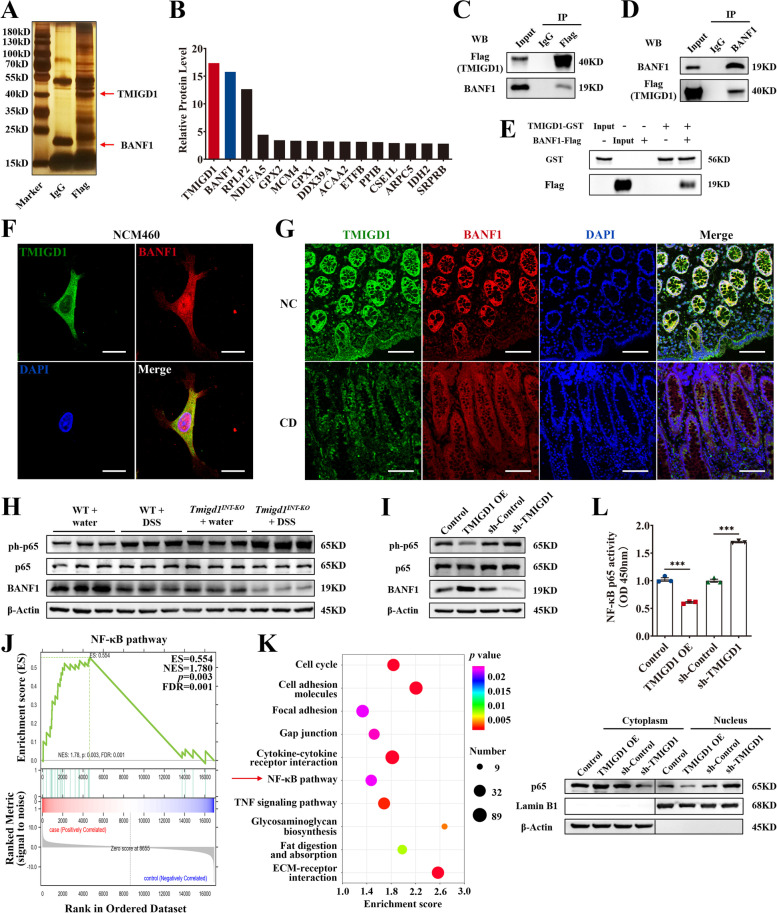
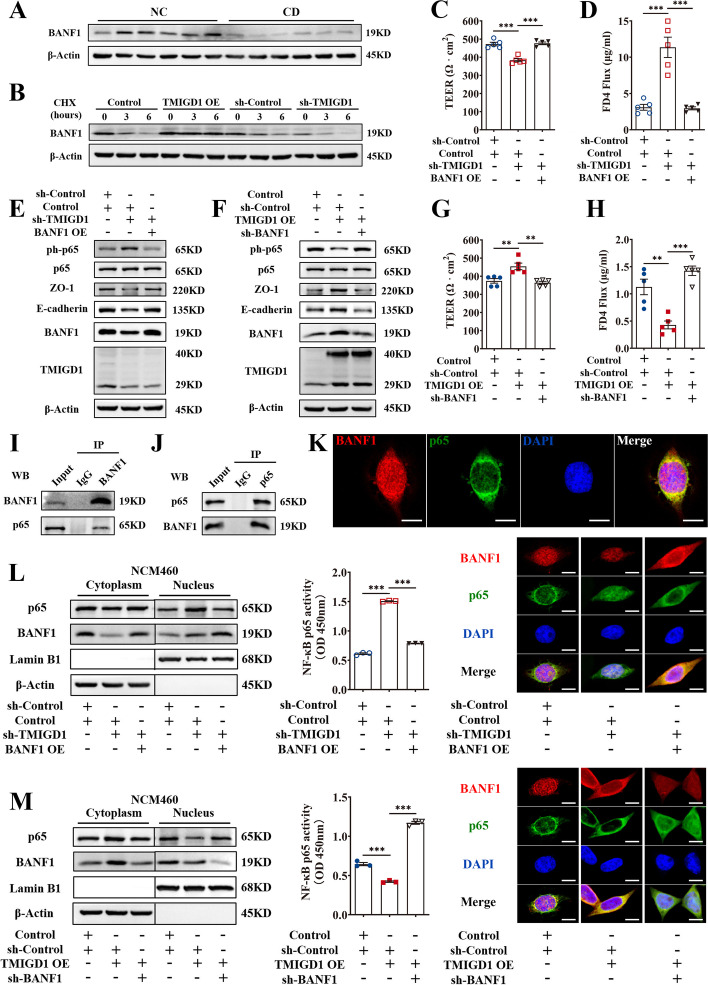
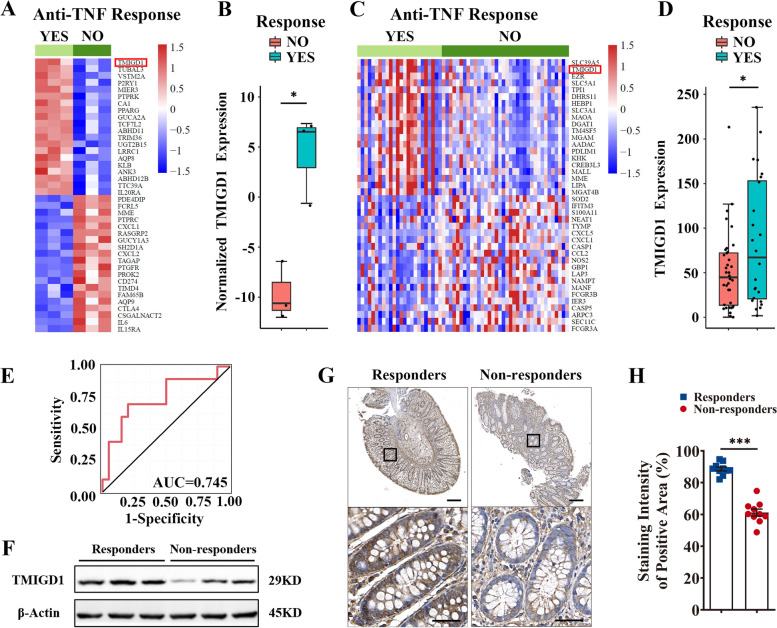
Results: Multi-omics integration suggested that TMIGD1 was negatively associated with inflammatory characteristics of CD. TMIGD1 was downregulated in inflamed intestinal mucosa of patients with CD and mice colitis models. Tmigd1INT-KO mice were more susceptible to chemically induced colitis. In epithelial cell lines and colonic organoids, TMIGD1 knockdown caused impaired intestinal barrier integrity evidenced by increased paracellular permeability and reduced TEER and AJC expression. TMIGD1 knockdown in intestinal epithelial cells also induced pro-inflammatory cytokine production. Mechanistically, TMIGD1 directly interacted with cytoplasmic BAF nuclear assembly factor 1 (BANF1) to inhibit NF-κB activation. Exogenous expression of TMIGD1 and BANF1 restored intestinal barrier function and inhibited inflammation in vitro and in vivo. TMIGD1 expression predicted response to anti-TNF treatment in patients with CD.

Conclusions: Our study demonstrated that TMIGD1 maintained intestinal barrier integrity and inactivated inflammation, and was therefore a potential therapeutic target for CD.

Keywords: BANF1; Crohn’s disease; Intestinal epithelial barrier; NF-κB pathway; TMIGD1.


Conflict of interest statement

The authors declared that they have no competing interests.

Figures

Fig. 1
Fig. 1
Multi-omics integration indicates that TMIGD1 is negatively correlated with inflammatory characteristics of CD. A Heatmap of our in-house dataset showing different expression of mRNA in patients with CD (n=7) vs healthy individuals (NC, n=10). The arrowhead indicates TMIGD1 expression level. B List of top 30 genes correlated with CDAI, CRP, SES-CD, and GHAS; the absolute value of Spearman r using correlation analysis between the FPKM of genes and CDAI, CRP, SES-CD, and GHAS. C Venn diagram showing the common genes in the four groups. D Multi-omics data integration of the Dutch 1000IBD cohort, including genomic information of 1125 patients, transcriptomic data of intestinal biopsies of 171 patients, and serum Olink proteomic data of 1026 patients. E Upper panel indicates the −log10 p value of cis-eQTLs within a region of ±1 Mb around the TMIGD1 gene center. Lower panel indicates the linkage disequilibrium (LD, R2) of 831 variants. F Examples of significant cis-eQTLs. 0, 1, and 2 indicate the homozygotes of reference alleles, heterozygotes, and homozygotes of alternative alleles in patients, respectively. Y-axis indicates the normalized gene expression count. G, H Examples of significant associations between cis-eQTL variants and pro-inflammatory proteins in serum. Blue in (G) indicates the negative associations while red indicates the positive associations. Values around the circle represent the absolute effect size generated from the linear model. Y-axis in (H) shows the normalized expression values of serum proteins
Fig. 2
Fig. 2
TMIGD1 expression is decreased in the intestinal mucosa of patients with CD and mice with chemically induced colitis. A TMIGD1 mRNA expression in intestinal mucosa in the in-house dataset (NC, n=10; CD, n=7; left) and in the 1000IBD cohort (NC, n=107; CD, n=64; right). B The expression of TMIGD1 mRNA in human intestinal mucosa was assessed via qPCR (NC, n=55; CD, n=64). C The level of TMIGD1 protein in human colonic mucosa. D UMAP plot displaying single cells, which are colored as per shared nearest neighboring clusters and cell types based on single-cell sequencing of human colonic biopsy samples (n=9) from the GSE116222 dataset (left). The feature plot demonstrates TMIGD1 expression, with each dot representing a single cell (middle). Relative mRNA expression of TMIGD1 in different cell types (right). E Representative IHC images of TMIGD1-stained colon sections of NC and different stages of CD. Scale bars, 200 μm (top) and 50 μm (bottom). F The staining intensity of TMIGD1-stained colon sections (NC, n=13; CDAI<150, n=10; 150≤CDAI<220, n=12; 220≤CDAI<450, n=15; CDAI≥450, n=5). The staining intensity of the positive area was quantified using ImageJ software. G Spearman’s correlation analysis between the staining intensity of TMIGD1 and CRP, SES-CD, and GHAS (n=42). H The expression of Tmigd1 mRNA in DSS-induced (water, n=8 and DSS, n=10) and TNBS-induced (Alcohol, n=10; TNBS, n=10) colitis was examined via qPCR. I The expression of Tmigd1 protein in DSS-induced (up) and TNBS-induced (down) colitis. J The expression of Tmigd1 protein in DSS-induced (up) and TNBS-induced (down) colitis was measured via IHC. Scale bars, 100 μm. Data are expressed as mean ± SEM. * p<0.05, *** p<0.001
Fig. 3
Fig. 3
Tmigd1INT-KO mice are predisposed to chemically induced acute colitis. A, B Body weight and Disease Activity Index (DAI) score; WT+water (n=8), Tmigd1INT-KO+water (n=8), WT+DSS (n=10), Tmigd1INT-KO+DSS (n=12). C Representative images of mouse colons. D Colon length; WT+water (n=8), Tmigd1INT-KO+water (n=8), WT+DSS (n=10), Tmigd1INT-KO+DSS (n=12). E Representative colonic histopathological images. Scale bars, 200 μm. F Histological scores; WT+water (n=8), Tmigd1INT-KO+water (n=8), WT+DSS (n=10), Tmigd1INT-KO+DSS (n=12). G Representative colonoscopy images. H Endoscopic scores. Every group, n=3. I, J Body weight and colon length; WT+Alcohol (n=10), Tmigd1INT-KO+Alcohol (n=10), WT+TNBS (n=10), Tmigd1INT-KO+TNBS (n=15). K Representative images of mouse colons. L Representative colonic histopathological images. Scale bars, 200 μm. M Histological scores; WT+Alcohol (n=10), Tmigd1INT-KO+Alcohol (n=10), WT+TNBS (n=10), Tmigd1INT-KO+TNBS (n=15). Data are expressed as mean ± SEM. ns, no significance, * p<0.05, ** p<0.01, *** p<0.001
Fig. 4
Fig. 4
TMIGD1 downregulation aggravates inflammation and weakens intestinal epithelial barrier function in the inflammatory environment. A Transcriptomic analysis of genes related to epithelial barrier function and inflammatory cytokines in the colonic tissues of WT+DSS and Tmigd1INT-KO+DSS mice. B The differentiated genes were enriched in barrier function and inflammation-relevant cytokines according to gene ontology (GO) analysis. C Myeloperoxidase (MPO) activity in colon tissues; WT+water (n=8), Tmigd1INT-KO+water (n=8), WT+DSS (n=10), Tmigd1INT-KO+DSS (n=12); WT+Alcohol (n=10), Tmigd1INT-KO+Alcohol (n=10), WT+TNBS (n=10), Tmigd1INT-KO+TNBS (n=15). D Serum TNF-α and IL-6 concentrations were tested using multiELISA; Every group, n=5. E The concentration of serum FD4; WT+water (n=5), Tmigd1INT-KO+water (n=5), WT+DSS (n=6), Tmigd1INT-KO+DSS (n=8). F Measurement of microvilli length and AJC gaps in colonic epithelial cells using TEM. Every group, n=3. G Representative TEM images of the colonic mucosa. The arrowheads indicate AJC. Scale bars, 500 nm. H, I TEER and FD4 permeability of Caco2 monolayer cell model after TNF-α stimulation. J, K The expression of AJC proteins (J) and inflammation-relevant cytokine mRNA and AJC mRNA (K) in NCM460 cells after TNF-α stimulation. L After TNF-α treatment, FD4 permeability of human colonic organoids was detected using confocal microscopy. Scale bars, 100 μm. M The FD4 permeability of colonic organoids from Tmigd1INT-KO and WT mice was detected using confocal microscopy before and after TNF-α treatment. Scale bars, 100 μm. Data are expressed as mean ± SEM. ns, no significance, * p<0.05, ** p<0.01, *** p<0.001
Fig. 5
Fig. 5
TMIGD1 directly interacts with BANF1 and modulates the NF-κB pathway. A Silver stain identified the TMIGD1-protein complex immunoprecipitated by anti-IgG or anti-FLAG antibody from the lysates of NCM460 cells transfected with lentivirus overexpressing FLAG-tagged TMIGD1. The arrowheads indicate bands of TMIGD1 and BANF1. B Proteomics analysis showed the 15 most enriched proteins from the immunoprecipitate of anti-FLAG antibody. C, D Immunoprecipitate by anti-FLAG antibody (C) or anti-BANF1 antibody (D) from the lysates of NCM460 cells transfected with lentivirus overexpressing FLAG-tagged TMIGD1. IP lysate (10%) was used as input. E GST pull-down assays of purified recombinant TMIGD1-GST and BANF1-Flag proteins. F, G Confocal microscope showed colocalization of TMIGD1 and BANF1 in NCM460 cells (F) and human epithelial mucosa (G). Scale bars, 20 μm for NCM460 cells and 100 μm for human epithelial mucosa. H Protein levels of BANF1, p65, and phosphorylated p65. I Protein levels of BANF1, p65, and phosphorylated p65 after TNF-α stimulation in NCM460 cells. J GSEA revealed significant enrichment of the NF-κB pathway. K Genes relevant to the NF-κB pathway were enriched in the comparison of WT+DSS and Tmigd1INT-KO+DSS groups according to KEGG analysis. L After TNF-α stimulation, the p65 protein level in cytoplasmic and nuclear fractions (down) and results of transcription factor binding assay of nuclear p65 (up) of NCM460 cells. Data are expressed as mean ± SEM. *** p<0.001
Fig. 6
Fig. 6
BANF1 is crucial for TMIGD1 to maintain the intestinal epithelial barrier and attenuate inflammation via the NF-κB pathway. A The expression level of BANF1 protein in the colonic tissues of patients with CD and healthy individuals. B Degradation of BANF1 protein in NCM460 cells treated with 50 μg/mL CHX was evaluated. C, D TEER and FD4 permeability were measured after TNF-α stimulation in Caco2 monolayer model. E, F The expression levels of AJC proteins, p65, and phosphorylated p65 after TNF-α stimulation in NCM460 cells. G, H TEER and FD4 permeability were measured after TNF-α stimulation in Caco2 monolayer model. I, J Immunoprecipitate by anti-BANF1 antibody (I) and anti-p65 antibody (J) from the lysates of NCM460 cells. IP lysate (10%) was used as input. K Confocal microscope showing colocalization of BANF1 and p65 in NCM460 cells. Scale bars, 10 μm. L, M After TNF-α stimulation, expression of p65 and BANF1 in cytoplasmic and nuclear fractions (left), transcription factor binding assay of nuclear p65 (middle), and subcellular localization of p65 (right) in NCM460 cells. Scale bars, 10 μm. Data are expressed as mean ± SEM. ** p<0.01, *** p<0.001
Fig. 7
Fig. 7
Restoring TMIGD1 and BANF1 alleviates inflammation and resumes intestinal barrier function. A, B Body weight and colon length. The arrowhead indicates the time point at which ADV was intraperitoneally injected to boost TMIGD1 and BANF1 expression in mice. Every group, n=5. C Representative images of colons. D Histological scores. Every group, n=5. E Representative colonic HE images. Scale bars, 200 μm. F The concentration of serum FD4. Every group, n=5. G Representative images of ZO-1-stained colon sections. Scale bars, 100 μm. H Measurement of microvilli length (up) and AJC gaps (down) in colonic epithelial cells using TEM. Every group, n=3. I Representative TEM images of the colonic mucosa. The arrowheads indicate AJC. Scale bars, 500 nm. J MPO activity in colon tissues. Every group, n=5. K Serum TNF-α and IL-6 concentrations were detected using multiELISA; Every group, n=5. Data are expressed as mean ± SEM. * p<0.05, ** p<0.01, *** p<0.001
Fig. 8
Fig. 8
TMIGD1 expression predicts response to anti-TNF treatment. A, B Heatmap and box plot from GSE111761 showing different baseline expressions of mRNA in LPMCs of 3 anti-TNF responding patients with CD and 3 non-responders. C, D Heatmap and box plot of the GSE134881 dataset showing different baseline expressions of mRNA in intestinal tissues of anti-TNF responding (n=24) and non-responding (n=36) patients with CD. E Receiver operating characteristic (ROC) curve for the prediction of anti-TNF response with baseline TMIGD1 mRNA expression (AUC=0.745, 95% CI: 0.540–0.950). F The expression of TMIGD1 protein in colonic tissues before anti-TNF treatment. G Representative IHC images of TMIGD1-stained sections from responders and non-responders before anti-TNF treatment. Scale bars, 200 μm (top) and 50 μm (bottom). H The staining intensity of TMIGD1-stained sections from responders (n=10) and non-responders (n=10). The staining intensity of the positive area was quantified using the ImageJ software. Data are expressed as mean ± SEM. * p<0.05, *** p<0.001

References

    1. Mao R, Chen M. Precision medicine in IBD: genes, drugs, bugs and omics. Nat Rev Gastroenterol Hepatol. 2022;19:81–82. doi: 10.1038/s41575-021-00555-w. - DOI - PubMed
    1. Torres J, Mehandru S, Colombel JF, Peyrin-Biroulet L. Crohn's disease. Lancet. 2017;389:1741–1755. doi: 10.1016/S0140-6736(16)31711-1. - DOI - PubMed
    1. Piovani D, Danese S, Peyrin-Biroulet L, Nikolopoulos GK, Lytras T, Bonovas S. Environmental risk factors for inflammatory bowel diseases: an umbrella review of Meta-analyses. Gastroenterology. 2019;157:647–659.e4. doi: 10.1053/j.gastro.2019.04.016. - DOI - PubMed
    1. Michaudel C, Sokol H. The gut microbiota at the service of immunometabolism. Cell Metab. 2020;32:514–523. doi: 10.1016/j.cmet.2020.09.004. - DOI - PubMed
    1. Parikh K, Antanaviciute A, Fawkner-Corbett D, et al. Colonic epithelial cell diversity in health and inflammatory bowel disease. Nature. 2019;567:49–55. doi: 10.1038/s41586-019-0992-y. - DOI - PubMed

Publication types