. 2023 Aug 5;42(1):195.
doi: 10.1186/s13046-023-02764-4.

TSPAN18 facilitates bone metastasis of prostate cancer by protecting STIM1 from TRIM32-mediated ubiquitination

Affiliations

TSPAN18 facilitates bone metastasis of prostate cancer by protecting STIM1 from TRIM32-mediated ubiquitination

Qianghua Zhou et al. J Exp Clin Cancer Res. .

Erratum in

Abstract

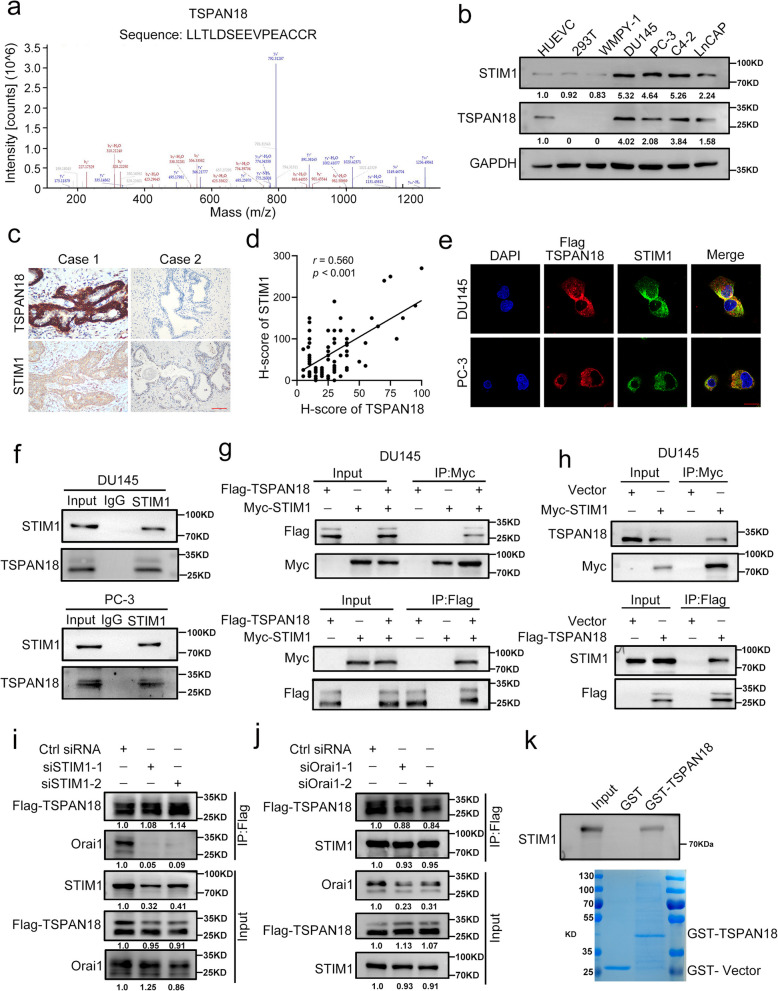
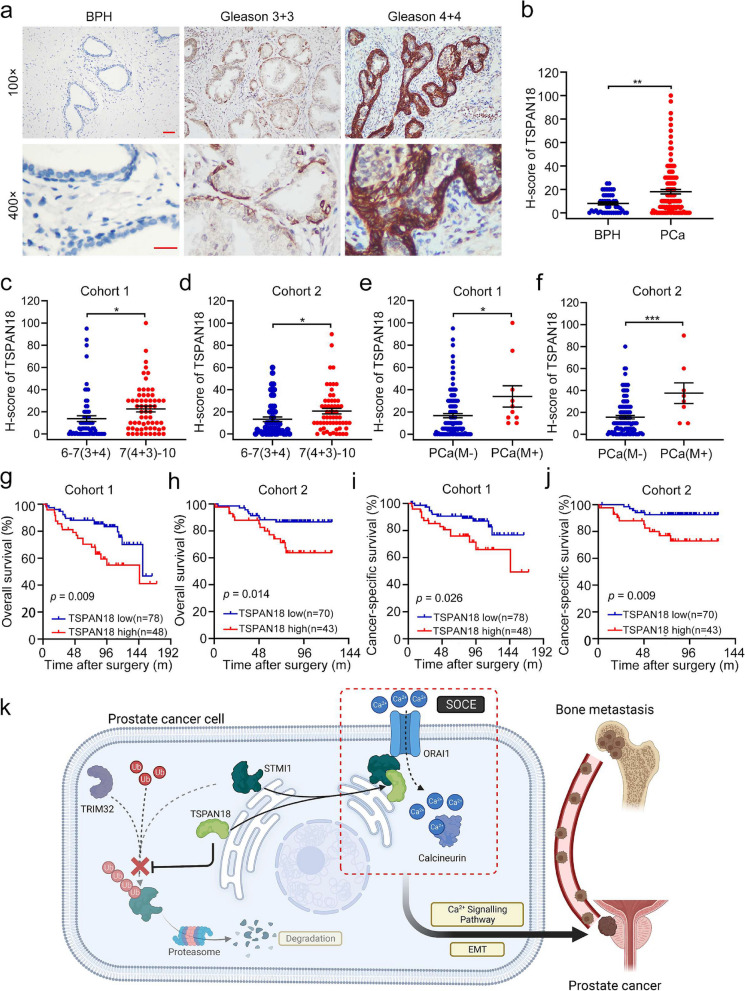
Background: Bone metastasis is a principal cause of mortality in patients with prostate cancer (PCa). Increasing evidence indicates that high expression of stromal interaction molecule 1 (STIM1)-mediated store-operated calcium entry (SOCE) significantly activates the calcium (Ca2+) signaling pathway and is involved in multiple steps of bone metastasis in PCa. However, the regulatory mechanism and target therapy of STIM1 is poorly defined.

Methods: Liquid chromatography-mass spectrometry analysis was performed to identify tetraspanin 18 (TSPAN18) as a binding protein of STIM1. Co-IP assay was carried out to explore the mechanism by which TSPAN18 inhibits STIM1 degradation. The biological function of TSPAN18 in bone metastasis of PCa was further investigated in vitro and in vivo models.

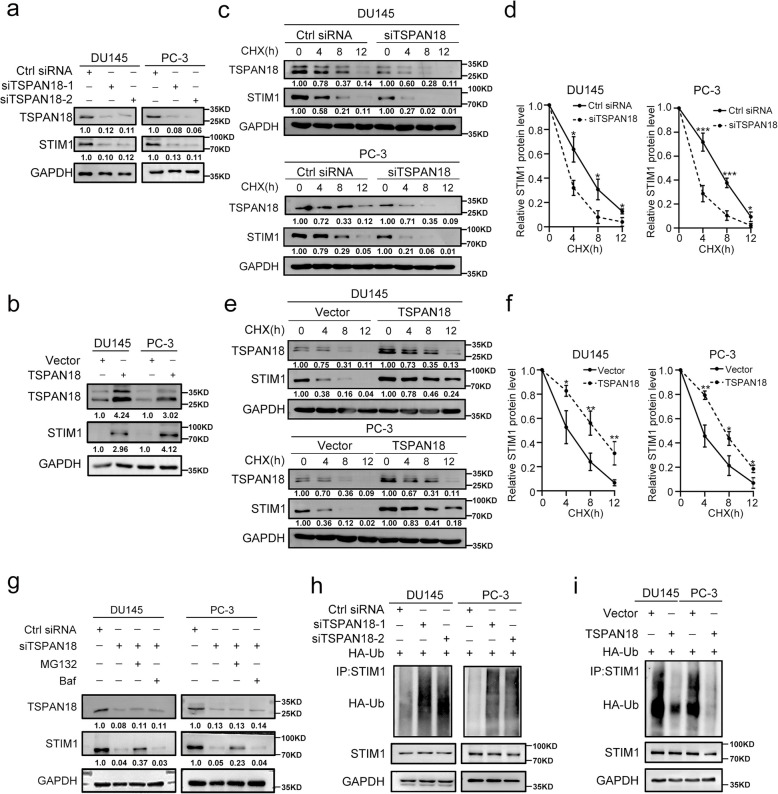
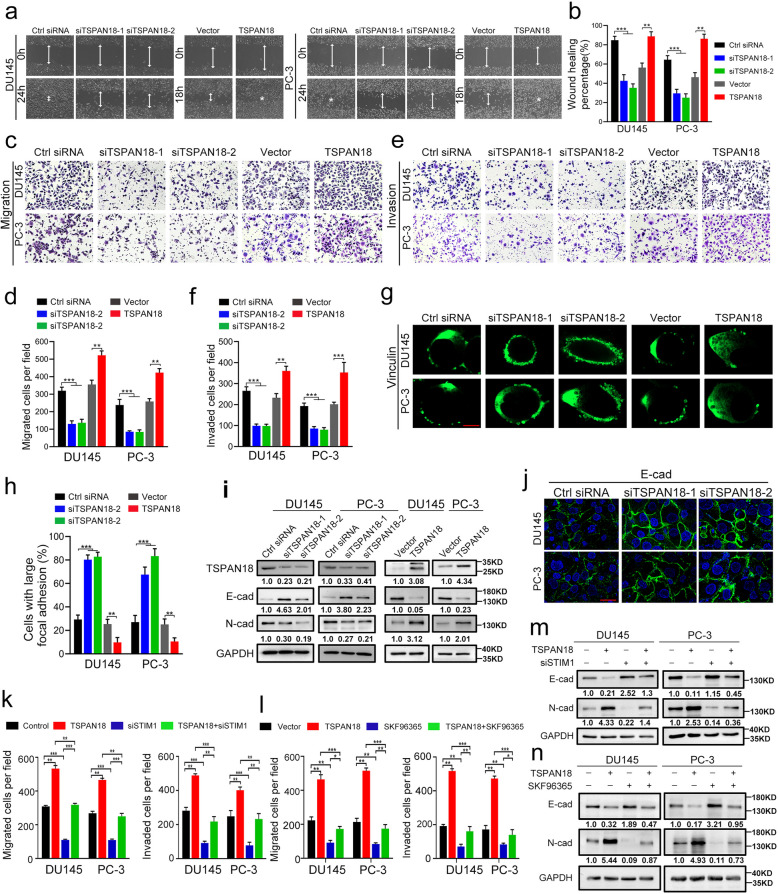
Result: We identified that STIM1 directly interacted with TSPAN18, and TSPAN18 competitively inhibited E3 ligase tripartite motif containing 32 (TRIM32)-mediated STIM1 ubiquitination and degradation, leading to increasing STIM1 protein stability. Furthermore, TSPAN18 significantly stimulated Ca2+ influx in an STIM1-dependent manner, and then markedly accelerated PCa cells migration and invasion in vitro and bone metastasis in vivo. Clinically, overexpression of TSPAN18 was positively associated with STIM1 protein expression, bone metastasis and poor prognosis in PCa.

Conclusion: Taken together, this work discovers a novel STIM1 regulative mechanism that TSPAN18 protects STIM1 from TRIM32-mediated ubiquitination, and enhances bone metastasis of PCa by activating the STIM1-Ca2+ signaling axis, suggesting that TSPAN18 may be an attractive therapeutic target for blocking bone metastasis in PCa.

Keywords: Bone metastasis; Prostate cancer; STIM1; TRIM32; TSPAN18.


Conflict of interest statement

The authors declare that they have no competing interests.

Figures

Fig. 1
Fig. 1
TSPAN18 interacts with STIM1 in vivo and in vitro. a The representative peptide of TSPAN18 from mass spectrometry. B Western blot analysis of the basic expression of STIM1 and TSPAN18 in one normal prostate cell line (WMPY-1) and a panel of prostate cancer cell lines. HUEVC was positive control for TSPAN18, and HEK-293T was negative control for TSPAN18. GAPDH was used as loading control. c-d Representative immunohistochemical staining (c) and correlation analysis (d) of TSPAN18 and STIM1 in prostate cancer. Scale bar, 100 μm. e Representative confocal immunostaining images for TSPAN18 (red) and STIM1 (green) in DU145 and PC-3 cells. Scale bar, 20 μm. f Co-immunoprecipitation (Co-IP) analysis of binding between endogenous STIM1 and endogenous TSPAN18 in DU145 (upper) and PC-3 (lower) cells using anti-STIM1 antibody. g Co-IP analysis of interaction between exogenous STIM1 and exogenous TSPAN18 in DU145, transfected with Flag-TSPAN18 and Myc-STIM1 plasmid using anti-Myc antibody(upper) or anti-Flag antibody (lower). h Co-IP analysis of binding between exogenous STIM1 and endogenous TSPAN18 (upper), or endogenous STIM1 and exogenous TSPAN18 (lower) in DU145 cells transfected with Myc-STIM1 or Flag-TSPAN18 plasmid using indicated antibodies. i-j. Flag-TSPAN18 overexpressing DU145 cells were transfected with siRNA targeting STIM1(i) or Orai1(j), respectively. The Co-IP analyses were conducted with anti-Flag antibody. k GST pulldown analysis was performed by incubating purified GST-only or GST-TSPAN18 with purified Myc-STIM1 protein, then immunoblotting analyses were performed (top panel). Coomassie blue staining of GST-TSPAN18 and GST was performed (bottom panel)
Fig. 2
Fig. 2
TSPAN18 maintains STIM1 stability via inhibiting ubiquitination in PCa. a Western blot (WB) analysis of STIM1 expression in DU145 and PC-3 cells transiently transfected with indicated siRNA. b WB analysis of STIM1 expression in TSPAN18-overexpressing DU145 and PC-3 cells. c-d The protein level of STIM1 in DU145 and PC-3 cells transfected with scramble or si-TSPAN18 were monitored by WB at indicated times after cycloheximide (CHX, 20μg/mL) (c) and were quantified by ImageJ software (d). e-f the protein level of STIM1 in TSPAN18 overexpressing DU145 and PC-3 cells by WB at indicated times after cycloheximide (e) and were quantified by ImageJ software (f). g WB analysis of lysates from DU145 or PC-3 cells transfected with scramble or si-TSPAN18 followed by treatment with DMSO, MG132 (10 μg/ml) or Baf for 4 h. Baf: Bafilomycin. h-i Coimmunoprecipitation (Co-IP) analysis of ubiquitination of STIM1 in TSPAN18-knockdown (h) or TSPAN18-overexpressing (i) DU145 and PC-3 cells co-transfected with Myc-STIM1 plasmid and HA-Ub plasmid. The values are expressed as the mean ± s.d. of three independent experiments. *p<0.05, **p<0.01, ***p < 0.001, Student’s t test
Fig. 3
Fig. 3
TRIM32 promotes STIM1 degradation via the ubiquitin-proteasome pathway in PCa. a Coimmunoprecipitation (Co-IP) analysis of interaction of STIM1 with TRIM32, MIB1 using anti-STIM1 antibody. b Co-IP analysis of interaction between TRIM32 and STIM1 using anti-TRIM32 antibody. c Co-IP analysis of interaction between exogenous STIM1 and exogenous TRIM32 in DU145 cells transfected with His-TRIM32 plasmid and Myc-STIM1 plasmid using anti-Myc antibody(up) or anti-His antibody (down). d-e Western blot (WB) analysis of STIM1 expression in TSPAN18-overexpressing (d) or TSPAN18-knockdown (e) DU145 and PC-3 cells. f the protein level of STIM1 in DU145 and PC-3 cells transfected with scramble or si-TRIM32 were monitored by WB at indicated times after cycloheximide (CHX, 20μg/mL), and were quantified by ImageJ software. The values are expressed as the mean ± s.d. of three independent experiments. *p<0.05, **p<0.01, ***p < 0.001, Student’s t test. g-h Co-IP analysis of ubiquitination of STIM1 in TRIM32-knockdown DU145 and PC-3 cells co-transfected with Myc-STIM1 plasmid and HA-Ub plasmid (g) or HA-Ub-K48 plasmid (h). i Co-IP analysis of interaction between exogenous TSPAN18 and exogenous TRIM32 in DU145 co-transfected with His-TRIM32 plasmid and Flag-TSPAN18 plasmid using anti-Flag antibody(upper) or anti-His antibody (lower). j-k HEK-293T cells were co-transfected with indicated plasmid for 48h, then Co-IP analysis was conducted with anti-STIM1 antibody. l-m WB analysis of whole-cell lysates (left) or IP (right) from cells co-expressing Myc-STIM1 CC1, Myc-STIM1 CAD, Myc-STIM1 CC1-CAD, or Myc-STIM1 CT and Flag-TSPAN18 (l) or His-TRIM32 (m) in HEK-293T cells
Fig. 4
Fig. 4
TSPAN18 activates Ca2+ signal pathway via STIM1-dependent manner. a-b After 20 minutes incubation with Ca2+-sensitive dye Fluo-4, the cytosolic Ca2+ level within indicated cells were measured by confocal laser scanning microscope. The representative time-lapse images (a) and quantification (b) of mean cytosolic Ca2+ level within per high-power field during measurement. Scale bar, 20 μm. RFU: Relative fluorescence unit. c Volcano plots displaying the genes expression change in DU145 transfected with TSPAN18-siRNAs, compared with control-siRNA. Differential expression values were plotted against p-value; Red dots represent the up-regulated genes and blue dots represented down-regulated genes. siT18: siTSPAN18. d A bubble chart exhibiting the enrichment of differentially expressed genes in signaling pathways. Size and color of the bubble represent the amount of differentially expressed genes enriched in pathways and their enrichment significance, respectively. e Gene set enrichment analysis (GSEA) plots of Ca2+ signal pathway in RNA-Seq data upon silencing of TSPAN18 in DU145 cells. NES normalized enrichment score. p-values in panel. f DU145 cells were transfected with indicated siRNAs for 48h, followed by loaded with Fluo-4, and the mean cytosolic Ca2+ level within per high-power field were measured by confocal laser scanning microscope
Fig. 5
Fig. 5
TSPAN18 promotes migration and invasion of PCa cells through STIM1-Ca2+ signal pathway in vitro. a-b Representative images (a) and histogram analysis (b) of wound-healing assay using DU145 and PC-3 cells treated as indicated. c-d Representative images (c) and histogram analysis (d) of migration assays using DU145 and PC-3 cells treated as indicated. e-f Representative images (e) and histogram analysis (f) of invasion assay using DU145 and PC-3 cells treated as indicated. g-h Representative images (g) and histogram analysis (h) of focal adhesions visualized by Vinculin staining within indicated cells. Scale bar, 10 μm. i the protein levels of N-cadherin and E-cadherin were analyzed by Western Blot (WB) within DU145 and PC-3 cells treated as indicated. j The immunofluorescence staining of E-cadherin within DU145 and PC-3 cells transfected with indicated siRNAs. Scale bar, 20 μm. k Histogram analysis of migrated (left) and invaded (right) TSPAN18-overexpressing DU145 and PC-3 cells transfected with indicated siRNAs. l Histogram analysis of migrated (left) and invaded (right) TSPAN18-overexpressing DU145 and PC-3 cells treated with SKF96365 or DMSO. m WB analysis of N-cadherin and E-cadherin within TSPAN18-overexpressing DU145 and PC-3 cells transfected with indicated siRNAs. n WB analysis of N-cadherin and E-cadherin within TSPAN18-overexpressing DU145 and PC-3 cells treated with SKF96365 or DMSO. The values are expressed as the mean ± s.d. of three independent experiments. **p<0.01, ***p < 0.001, Student’s t test or ANOVA with post hoc test
Fig. 6
Fig. 6
TSPAN18 promotes bone metastasis of PCa cells in vivo. a-b Representative images of bioluminescence (a) and X-ray (b) of bone metastasis through caudal artery injection. The red arrows show bone metastases. c Western blot analysis of TSPAN18 expression in stably TSPAN18-knockdown or TSPAN18-overexpressing cells and control cells. d TSPAN18-knockdown, TSPAN18-overexpressing and corresponding control PC-3 cells stably expressing luciferase were injected into nude mice through caudal artery, then the bone metastasis was weekly measured using an in vivo IVIS system. Representative bioluminescence images at indicated weeks from each group were shown. e Kaplan-Meier curves for metastasis-free survival of mice bearing PC-3 cells as indicated. f The counts of metastasis in indicated groups (n=6/group). g Representative immunohistochemical images of micro-CT, H&E and luciferase, and immunofluorescent staining of E-cadherin (green) and N-cadherin (red) in each group as indicated. The nucleus is labeled with DAPI (blue). Scale bars: red, 50 μm. h The tumor volume to the bone volume ratio was calculated for each mouse and presented in the plot at right. *p<0.05, **p<0.01 student’s t test
Fig. 7
Fig. 7
TSPAN18 overexpression correlates with bone metastasis and poor prognosis in PCa. a Representative immunohistochemical staining images of TSPAN18 in benign prostatic hyperplasia (BPH) and PCa with Gleason (3+3) or Gleason (4+4). Scale bars: red, 50 μm. b The expression difference of TSPAN18 between BPH and PCa tissues. c-d The expression difference of TSPAN18 between low Gleason score ((6-7(3+4)) PCa tissues and high Gleason score (7(4+3)-10) PCa tissues in Cohort 1 (c) and Cohort 2 (d). e-f The expression difference of TSPAN18 between PCa tissues with or without bone metastasis in Cohort 1 (e) and Cohort 2 (f). g-h Kaplan-Meier curves for overall survival of PCa patients with high or low expression of TSPAN18 in Cohort 1 (g) and Cohort 2 (h). i-j Kaplan-Meier curves for cancer-specific survial of PCa patients with high or low expression of TSPAN18 in Cohort 1 (i) and Cohort 2 (j). k Working model for regulation of STIM1 stability and bone metastasis of PCa by TSPAN18. The error bars mean standard deviations of three independent experiments. *p<0.05, student’s t test

References

    1. Siegel RL, Miller KD, Fuchs HE, Jemal A. Cancer Statistics, 2021. CA Cancer J Clin. 2021;71(1):7–33. - DOI - PubMed
    1. Bekelman JE, Rumble RB, Chen RC, Pisansky TM, Finelli A, Feifer A, et al. Clinically Localized Prostate Cancer: ASCO Clinical Practice Guideline Endorsement of an American Urological Association/American Society for Radiation Oncology/Society of Urologic Oncology Guideline. J Clin Oncol. 2018;36(32):3251–8. - DOI - PubMed
    1. Smith MR, Saad F, Oudard S, Shore N, Fizazi K, Sieber P, et al. Denosumab and bone metastasis-free survival in men with nonmetastatic castration-resistant prostate cancer: exploratory analyses by baseline prostate-specific antigen doubling time. J Clin Oncol. 2013;31(30):3800–6. - DOI - PMC - PubMed
    1. Himelstein AL, Foster JC, Khatcheressian JL, Roberts JD, Seisler DK, Novotny PJ, et al. Effect of longer-interval vs standard dosing of Zoledronic acid on skeletal events in patients with bone metastases: a randomized clinical trial. JAMA. 2017;317(1):48–58. - DOI - PMC - PubMed
    1. Kyriakopoulos CE, Chen YH, Carducci MA, Liu G, Jarrard DF, Hahn NM, et al. Chemohormonal therapy in metastatic hormone-sensitive prostate cancer: long-term survival analysis of the randomized phase III E3805 CHAARTED trial. J Clin Oncol. 2018;36(11):1080–7. - DOI - PMC - PubMed

MeSH terms